Trading The Pinocchio Bar (Pin Bar) With Four Detailed Price Action Examples
By Galen Woods ‐ 9 min read
Learn the concept of behind the popular pin bar trading pattern. Find pin bars that penetrate support and resistance for high probability reversal trades.
The Pinocchio Bar or Pin Bar is a popular price pattern among traders who use technical analysis. The Pin Bar is easy to spot, and you can trade it effectively within the market’s support and resistance structure. The dynamics underlying this simple price pattern is intriguing.
In Martin Pring’s Technical Analysis Explained, he calls the pattern Pinocchio because it lies.
It lies about the market direction. And its long nose exposes its lie.
Let’s expose the Pin Bar below.
The Trading Psychology Behind The Pin Bar
To appreciate how the Pin Bar works, you will find it helpful to understand the market dynamics it capitalizes on.
Trading breakouts is a common strategy. The usual approach for breakout trading is to place entry orders and stop orders at support and resistance levels.
By making a momentary break of these levels, Pin Bars trigger the orders of these breakout traders before trapping them into an adverse situation.
As the Pin Bar closes back within the support or resistance, prices make a run for the other direction, trapping the traders.
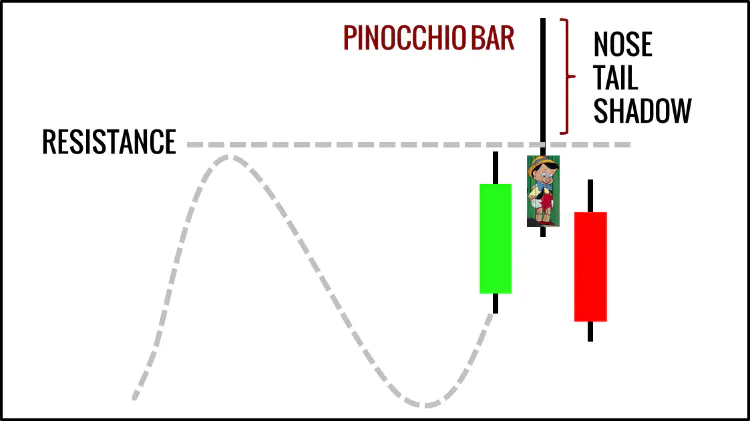
Look at the diagram above.
Let’s say you are bullish here. It’s not surprising that you will consider placing a buy stop order at the resistance. This tactic will create a long position for you as the market surges up and proves your bullish hypothesis right.
Here, the market dashed up and triggered your buy stop order. But price action reversed down within the very same candlestick.
Are you anxious now? Do you feel trapped in a losing position?
Will you consider selling your long position?
The bearish Pin Bar anticipates the selling pressure created by such anxious traders trapped in bullish positions.
As you can see, the idea behind the Pin Bar pattern is simple. And that is why it works over a variety of time frames. It also explains its immense popularity among technical traders.
However, like all price patterns, do not rely solely on it for taking a trade. Although the Pin Bar works as a valid trade trigger, you can only realize its true potential by factoring in the overall market context.
That is why it’s crucial to go through the trading examples below.
Pin Bar Trading Rules
But before we dive into the in-depth chart examples, let’s define our trading rules.
Rules For Long Setups
- Bar opens above a support level
- Bar trades below the support level for most of the range of the bar
- Bar closes above the support level
Rules For Short Setups
- Bar opens below a resistance level
- Bar trades above the resistance level for most of the range of the bar
- Bar closes below the resistance
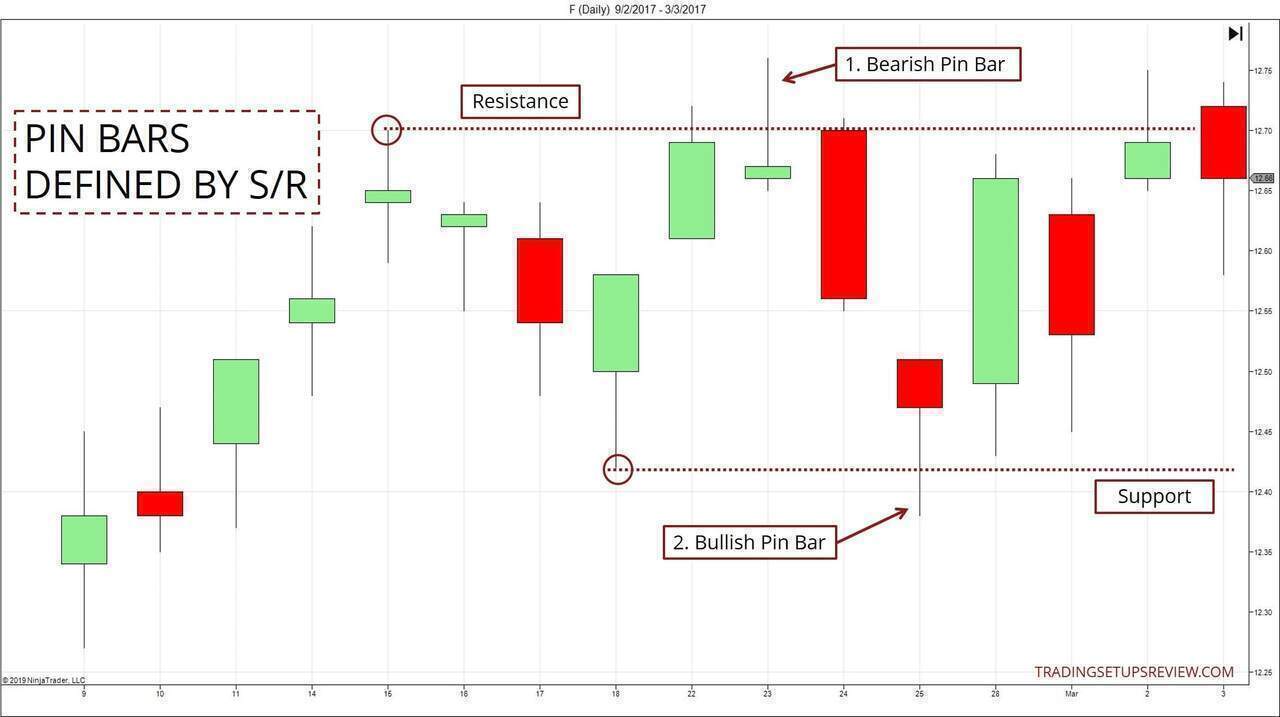
Notice that our trading rules focus on the interaction between the Pin Bar and the support/resistance levels. This approach reminds us that the market context is the key to trading price patterns like the Pin Bar.
You’ll find some traders emphasizing the structure of the Pin Bar itself. Those rules focus on how Pin-like the bar is. Those considerations include:
- The proportion of the candlestick shadow to the body
- The direction of the body (bullish or bearish body)
While these factors play a role in defining a Pin Bar, they are less pivotal when it comes to taking actual trades with it. The context matters more.
For a straightforward rule of thumb, check that:
- The upper shadow of a bearish Pin Bar is at least two-thirds of the bar range.
- The lower shadow of a bullish Pin Bar is at least two-thirds of the bar range.
These are guidelines and not strict rules. Also, I do not place much emphasis on the color of the candle body.
Trading Examples - Pin Bar
There are four trading examples below. For a balanced perspective, one of them shows a losing trade.
Also, don’t miss Example #4 as it uses another tactic to take advantage of Pin Bar failures.
Example #1: Pin Bar With 50% Retracement Zone
For a sensible Pin Bar trading method, you need to have a support and resistance framework in place. One tactic for identifying S/R zones is the 50% retracement method.
In this example, I am using this price action pattern indicator to mark out the Pin Bars. Of course, this indicator is not definitive. However, it offers consistency and helps to focus my analysis.
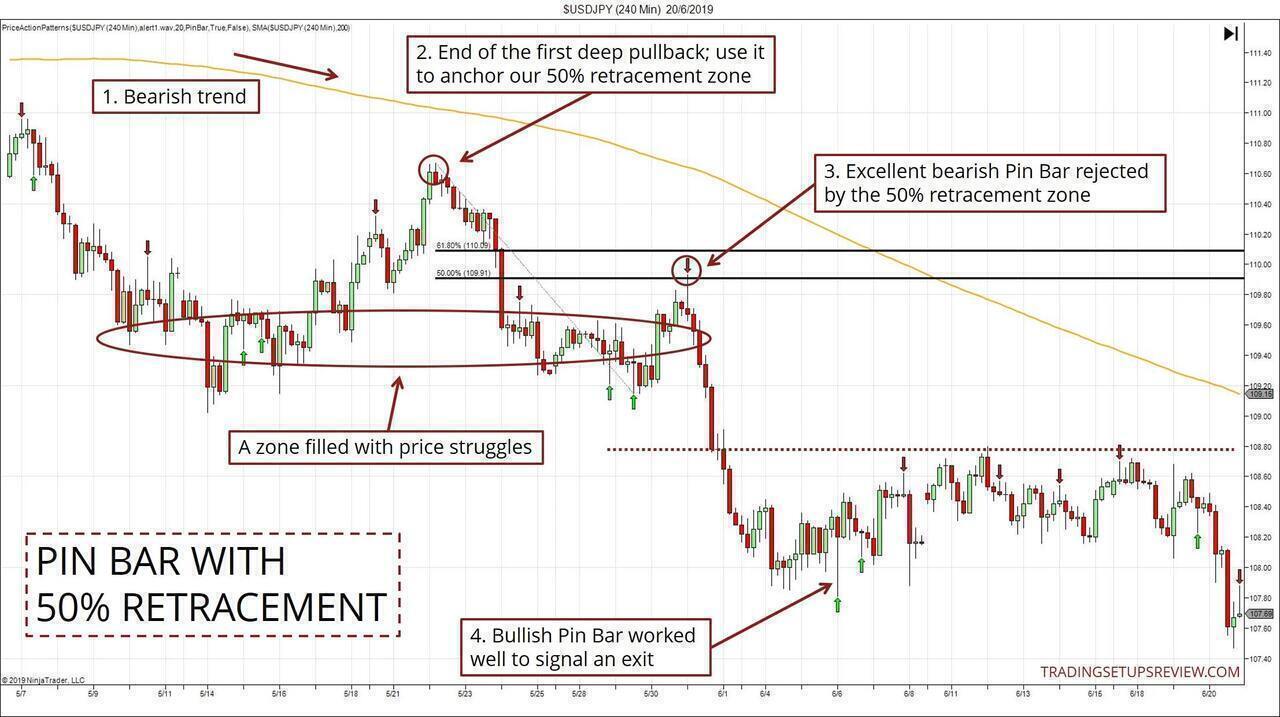
- In this 4-hour chart of the USDJPY currency pair, we are using a 200-period SMA to gauge the market’s long term bias.
- This point was the end of the trend’s first deep pullback. It was a reasonable candidate to anchor a swing for projecting a 50% retracement zone.
- This bearish Pin Bar had an excellent form with a long upper shadow. It showed that the 50% resistance zone rejected the market swiftly.
- The first bullish Pin Bar that followed our short entry worked great as an exit signal here. However, you should not expect this always to be the case. Look out for other exit signals for taking profits.
Now, let us return to the bearish Pin Bar. There are two more price action observations:
- The Pin Bar was also a bearish outside bar that signaled the strength of the rejection.
- The circled region had multiple congestion zones within it. Filled with numerous price struggles, it was a significant market zone. Hence, we should pay attention to any breakout or failed breakout from this zone. And the Pin Bar here was a failed upside breakout of this zone.
Example #2: Cup & Handle With Bearish Pin Bar
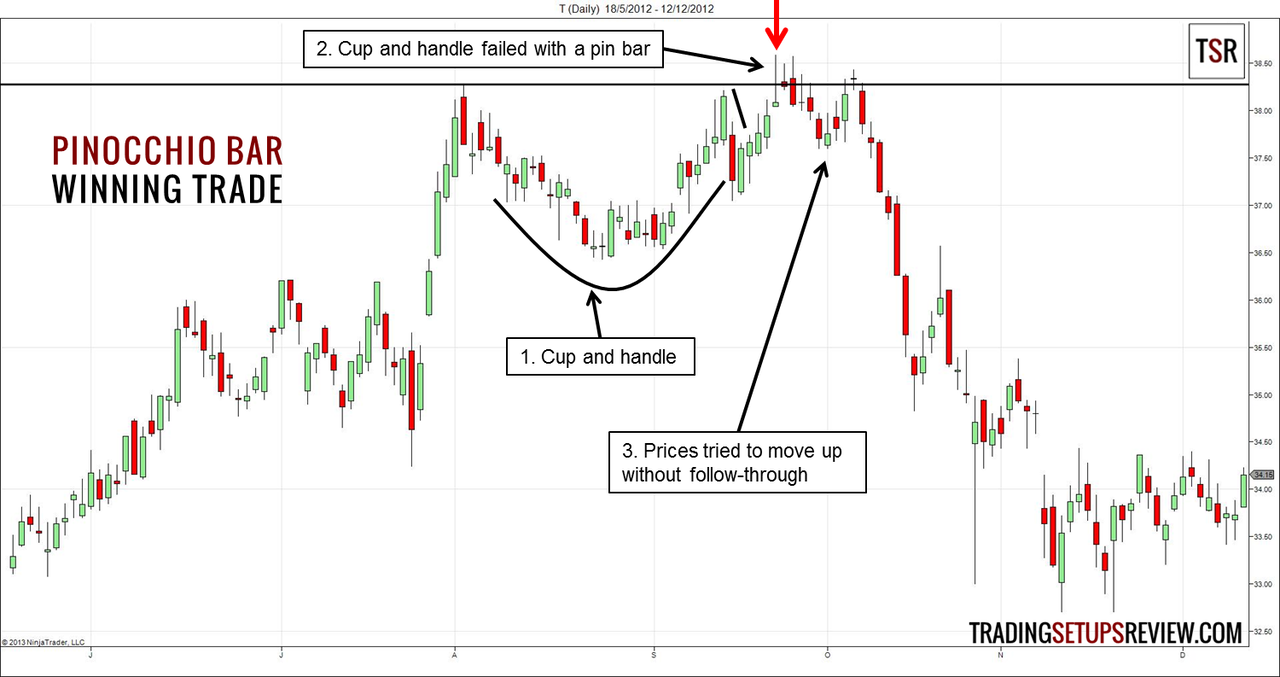
This daily chart of AT&T shows a Pin Bar that kicked off a swift downtrend.
- There was an existing uptrend followed by a cup and handle pattern. It was a bullish continuation chart pattern.
- However, the cup and handle formation failed quickly with a Pin Bar that poked above the “cup rim” before closing below the resistance.
- After the Pin Bar triggered a short entry, the market tried to move up. However, it could not gain momentum despite several tries. For the prudent trader, you might want to wait and enter after the failed bullish attempts.
Example #3: Bullish Pin Bar At Last Session Low (Losing Trade)
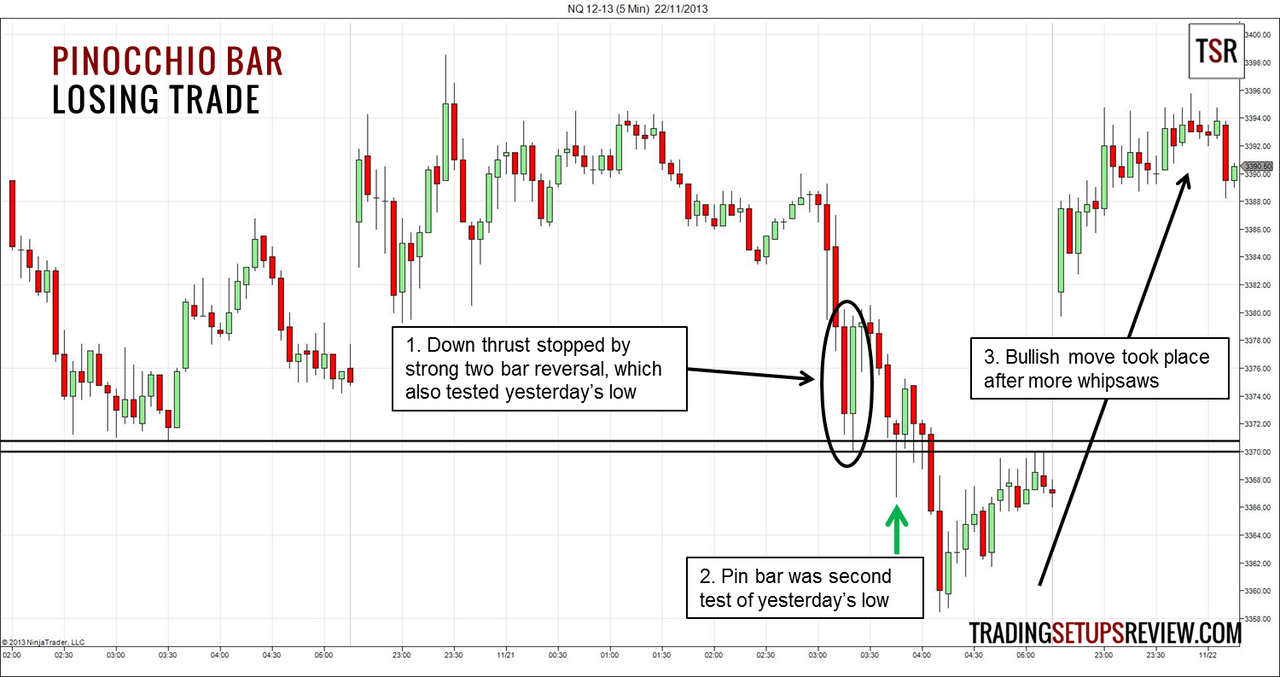
This 5-minute chart shows the E-mini futures of NASDAQ 100. We included part of the previous and next trading sessions for more context.
- After prolonged congestion, prices broke down sharply and stopped at the last session low with a two-bar reversal pattern.
- The Pin Bar was the second test of the low of the previous session. Given that it was the second test of the last day’s low, it was an acceptable day trade. However, our position got stopped out quickly.
- After a final thrust down, the market drifted up. The next day, it gapped up before continuing its way up. This showed that there was indeed buying pressure below the support level that the Pin Bar tested. However, the Pin Bar failed to offer the optimal timing in this case.
Example #4: Capitalizing On Pin Bar Failures
This example shows a different approach to trading Pin Bars.
Novice traders get excited when they see a Pin Bar. So excited that some of them forget about the market trend and trade them as reversal setups. You can capitalize on their failures for great with-trend trades.
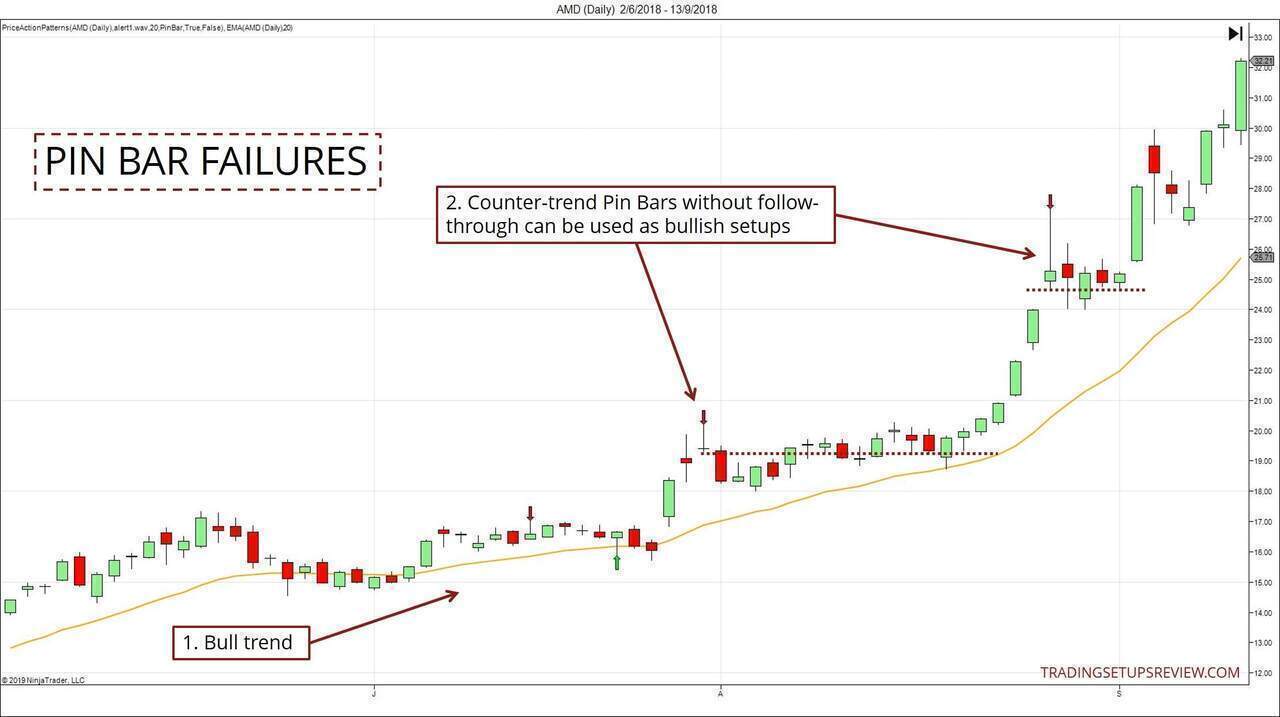
- The market was in a healthy bull trend, staying mostly above the 20-period EMA.
- These bearish Pin Bars formed as the market pushed to a new high. Instead of shorting these Pin Bars, wait, and see how the market responds.
- If there’s no follow-through downwards, the bearish traders would be trapped. Use their exits as your entry into the bullish trend. Here, both setups failed and offered reliable long entries.
(Note to course students: These are basically Anxiety Zone setups that are premised on Pin Bars.)
Scroll up and review Example #3. Could we have taken a short trade based on the failure of the bullish Pin Bar?
Pin Bar Indicators and Scanners
Trading Pin Bars mechanically is not a sound strategy. You need to examine each Pin Bar within the market structure to evaluate its profit potential and risk profile.
Hence, it’s a massive advantage if you can scan for Pin Bars automatically. Having Pin Bars marked out on your charts by a simple script is also helpful.
Here are some resources to help you scan and mark out Pin Bars.
Pin Bar Indicators
- NinjaTrader Price Action Pattern Indicator for five price patterns, including the Pin Bar. This is the indicator applied for Example #1 and #4 above.
- A free MT4 Pin Bar Indicator that allows extensive customization of Pin Bar parameters.
- Pin Bar code for thinkorswim platform shared by BenTen on useThinkScript.
Pin Bar Scanners
- Chartink Pin Bar Scan
- Advanced Pin Bar Scanner for ProRealTime users
Each of the tools above has different Pin Bar implementations. To have complete control over how you define a Pin Bar, you need to learn some basic scripting. I highly encourage doing so as knowing how to code is beneficial for testing new trading ideas.
However, remember that you do not need to pay for expensive Pin Bar scanners. After all, your trading edge lies in your market bias analysis. When you get the market bias right, most price patterns work well.
Review - Pinocchio Bar Trade Setup (Pin Bar)
A pin bar is a unique price pattern because it is not defined by one, two, or even three bars. It is determined by the market structure.
We can only label a Pin Bar after looking at the support or resistance levels that it penetrated.
Given the right context, the Pin Bar offers a reliable point of entry.
- Focus on Pin Bars that penetrate significant support or resistance.
- Then, find confirmation from other indicators or chart patterns, and you’ll find a high probability trade.
When you lack confirmation from other trading tools, consider delaying your entry. Patience is often rewarding. Allow more price action to unfold after the Pin Bar, and enter after it confirms your trading premise.
Finally, stay open to the possibility of trading Pin Bar Failures. They open up more trading opportunities for Pin Bar traders.
Are you fascinated by bar patterns? Hungry for more? Check these out:
- Martin Pring’s solid work on technical analysis: Technical Analysis Explained
- Three-Bar Inside Bar Pattern - another interesting bar pattern to use in your trading.
- ID/NR4 - Finding small range Inside Bars as trade triggers to reduce trade risk.
- The Hammer and Inverted Hammer candlestick patterns are often compared to Pin Bars. In isolation as individual price bars, they look the same. However, the context you expect to find them is different. Click here to learn more.
This article was first published on 6 December 2013 and updated on 11 October 2019.