Trading Pullbacks Using Trend Lines and Price Channels
By Galen Woods ‐ 8 min read
Learn how to find the best pullback setups with two simple trading tools - a trend line and a channel. Trading pullbacks can be simpler than you think.
If you ask a group of price action traders about their favorite tool for trading pullbacks, one of their top answers will be trend lines. And there is a solid reason for that. Trend lines and their channels are simple but powerful tools for amplifying the value of price action.
This article will show you a pullback trading strategy that works for multi-legged pullbacks in an established trend. It is a simple approach that uses only trend lines and channels.
The Trading Tools
Before we dive into the strategy, let’s recap the trading tools:
- Trend lines
- Trend line channels
NOTE: The explanations below are for bullish price action. Invert the rules for their bearish equivalents.
Trading Tool #1: The Trend Line
As its name suggests, a trend line is a line that tracks trends. Following the market bias is a crucial stage for price analysis.
The method for drawing this line is to connect two swing pivots we observe from price action.
The chart below shows an example of a bull trend line.
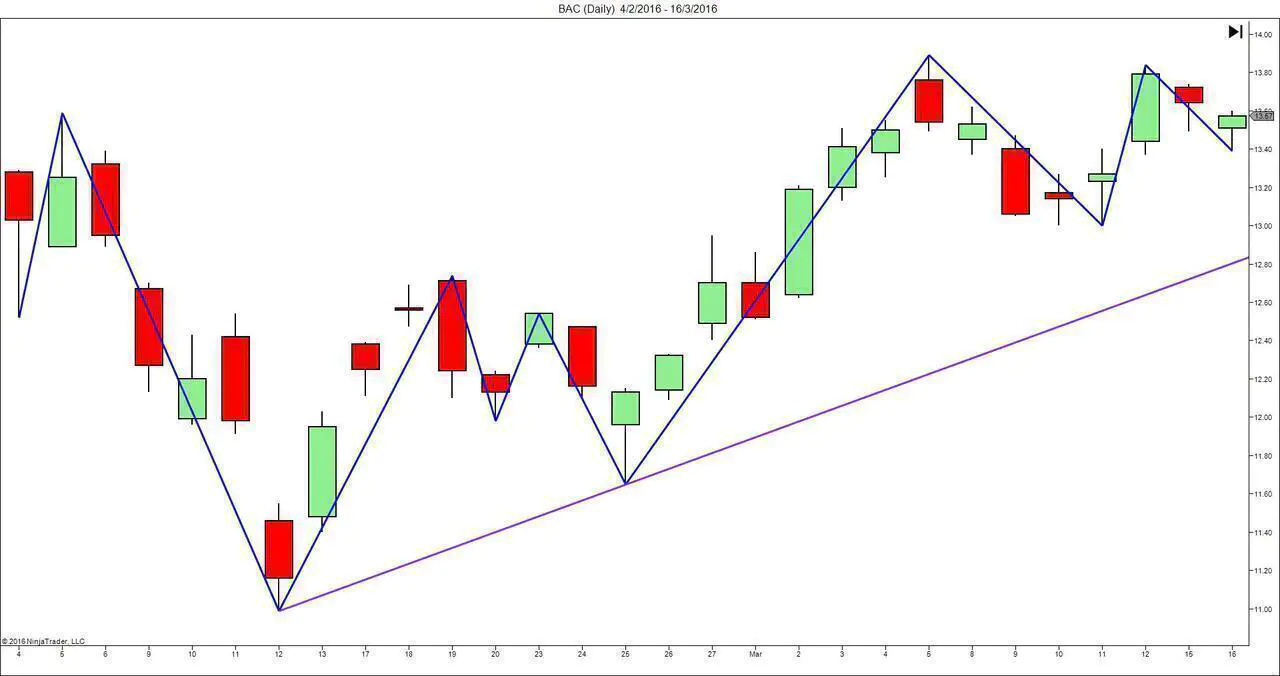
How to Draw a Trend Line
- Choose two swing lows. (Make sure that the second swing low is higher than the first.)
- Connect the two points with a straight line. (Price action must not dip below the line between the two points.)
- Project the line to the right.
You will end up with an upwards sloping line that highlights a bull trend.
How to Use a Trend Line
When unbroken, it acts as a price support level.
When broken decisively, it flips and serves as potential resistance.
Remember that here, we are referring to a bullish trend line that is sloping upwards. The reverse is valid for a bear trend line.
Trading Tool #2: The Channel
A trend line channel is a natural extension of a trend line. A trend line serves as the basis for a trend line channel.
Hence, make sure you know how to draw a trend line before trying to master the channel.
The chart below shows the same price action as the one above. But here, we added a parallel line to form a channel that encompasses the price action.
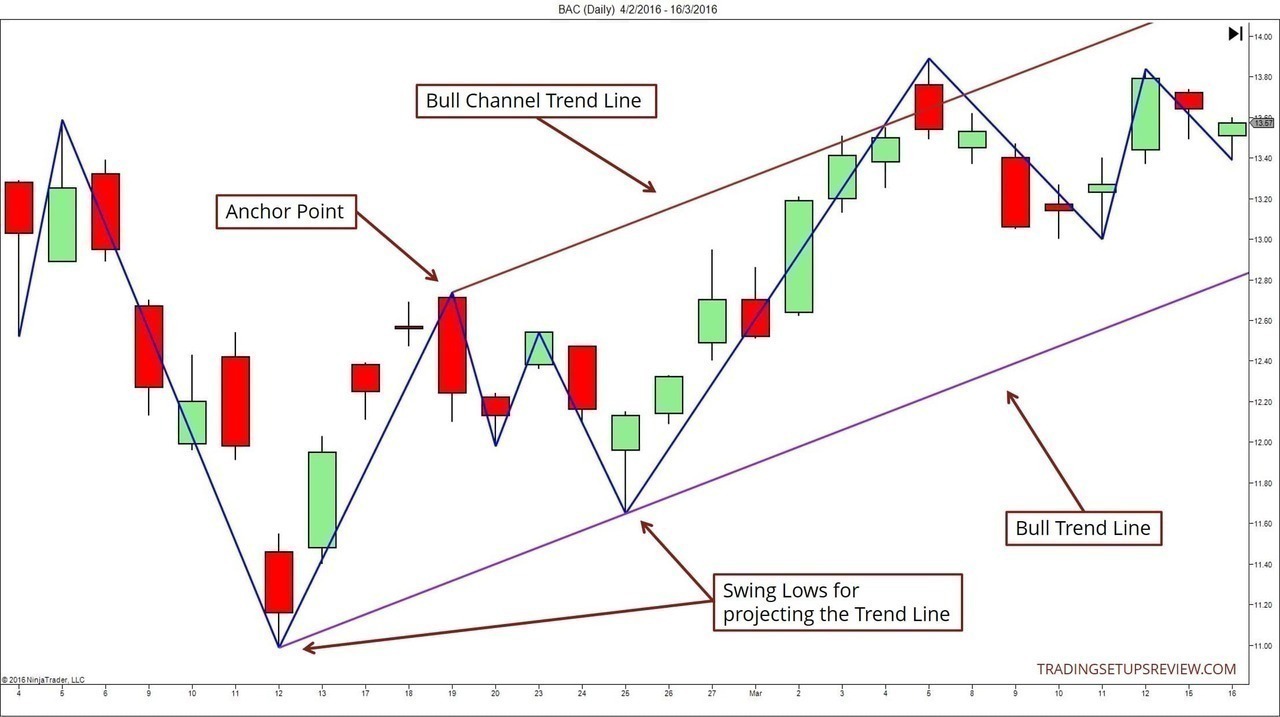
How to Draw a Channel
- Identify the trend line you want to use as the basis for the channel.
- Recall that a bull trend line is drawn with two swing lows. Find the highest swing high between the two swing lows. This swing high is the anchor point.
- From the anchor point, project a line that is parallel to the trend line. This line is the channel trend line. (Maroon line above)
Following these steps, you should have two parallel lines sloping upwards.
Taken together, they form a bull trend line channel.
How To Use a Channel
In theory, the channel is supposed to contain price action.
Hence, when the market overshoots the channel trend line, it is likely to be repelled back into the channel.
This means that while the trend line acts as a support, the channel trend line acts as a resistance. Ideally, the price action will oscillate between the two parallel lines.
The macro trend of the market can help us decide if the channel would hold up.
The Pullback Strategy
Now, let’s apply these tools using a standard pullback strategy template.
A pullback strategy requires us to:
- Define the market bias
- Identify an overextended pullback
- Time the trade entry
The trend line and its related channel offer the tools we need to complete these steps.
Long Setup Rules
- Highlight a bull trend with a bull trend line.
- Look for a bear channel that goes against the trend. (This is the pullback channel.)
- Go long when the market bounces off the support from the confluence of the bull trend line and the bear channel trend line.
Short Setup Rules
- Highlight a bear trend with a bear trend line.
- Look for a bull channel that goes against the trend. (This is the pullback channel)
- Go short when the market reflects off the resistance from the confluence of the bear trend line and the bull channel trend line.
Strategy Concepts
To pick the best setups for a strategy, you need to understand its underlying concepts.
In this strategy, we are taking advantage of the tension between two dueling trend lines.
From the rules above, you must’ve noticed that this method uses two trend lines:
- One for marking the trend
- One for marking the pullback against the trend (the one we expand into a channel)
Our trading premise here depends on the tension resolving in favor of the 1st trend line. We perceive a higher likelihood of the macro trend holding up, and this determination is what forms our trading edge.
The chart below illustrates the concepts.
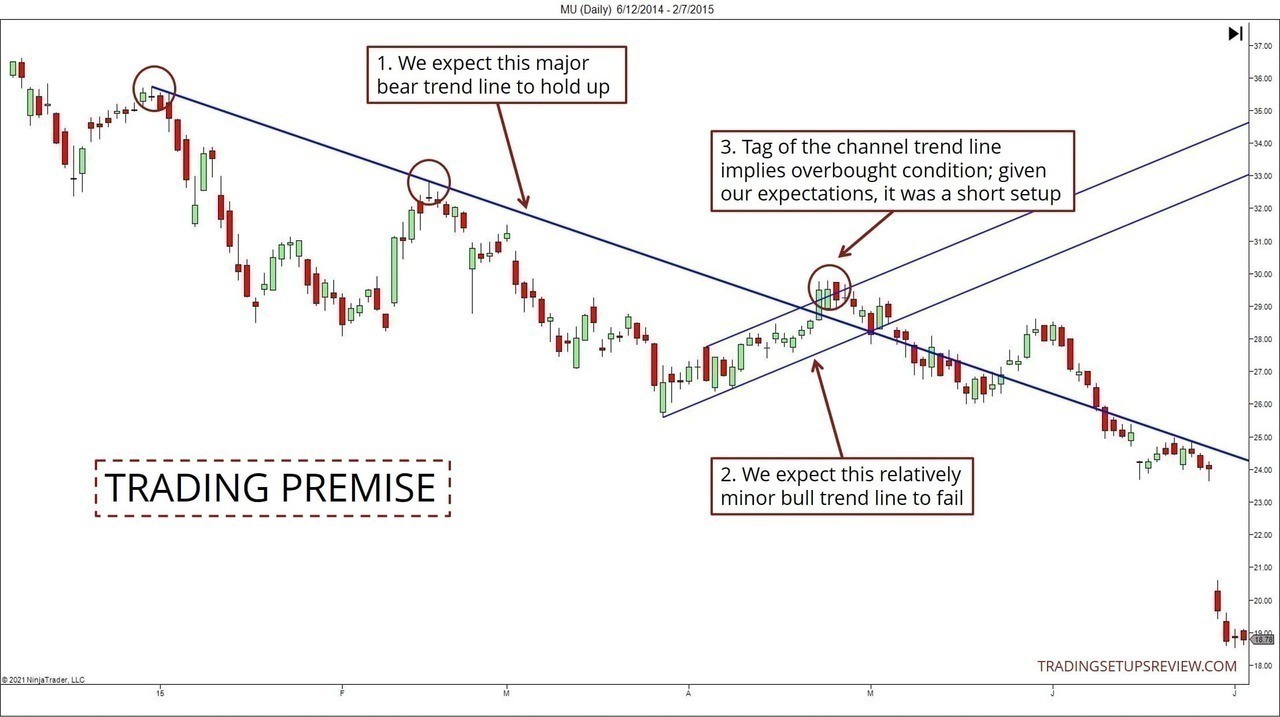
Don’t worry if you are unsure of how it works in detail. The examples below will reinforce the relevant price action concepts.
Trading Examples
In this section, you’ll find three examples of trading pullbacks with trend lines and price channels.
Example #1 - Complex Pullback in a Bull Trend
In the chart below, you might find it hard to see the detailed price action at the individual candlestick level.
But the scale of this chart is needed to show the market context. The critical aspect here is to note that the pullback took place in a steady bull trend.
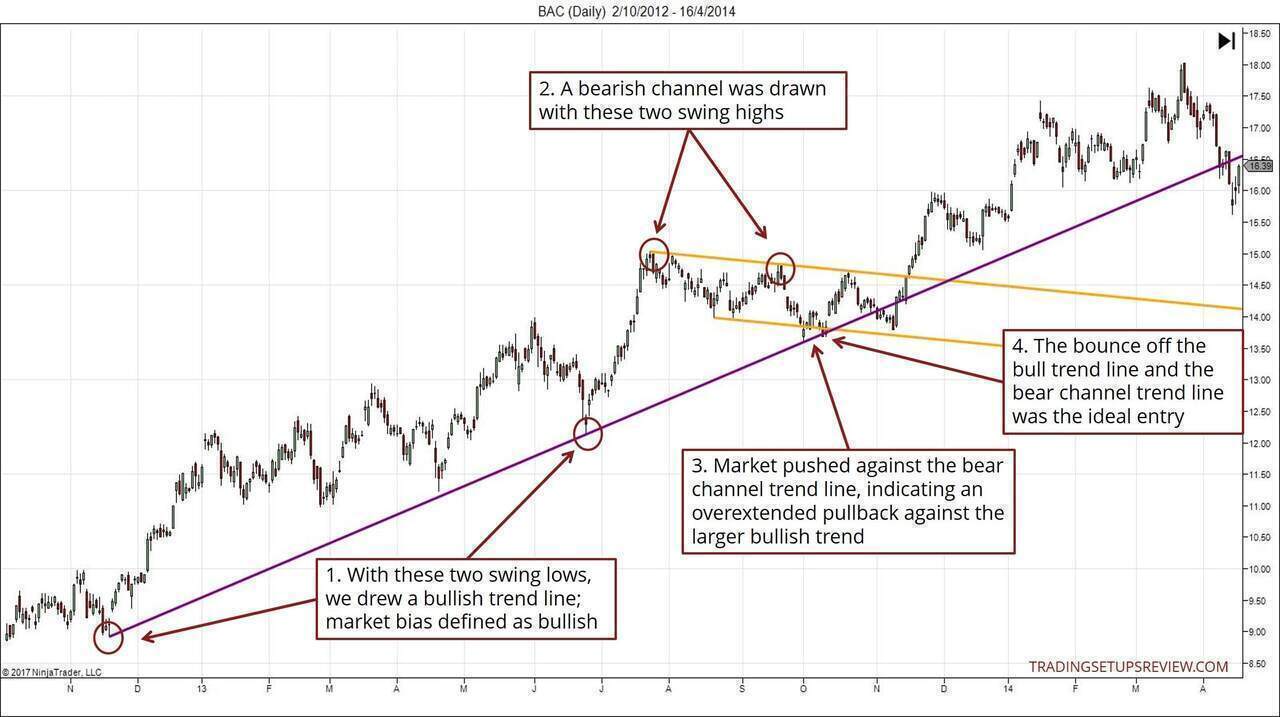
1. These are the two swing lows used to draw the bullish trend line (purple). This trend line highlighted the bullish market bias.
2. These two swing highs form the basis for the bear channel (orange).
3. When the price hits the bear channel trend line, it signaled that the pullback might be over soon.
4. The bounce off both the bull trend line and the bear trend channel line implied solid market support. It was an ideal long entry.
Example #2 - 6E Futures (EUR/USD) 30-Min Chart
Let’s take a look at how this simple strategy works for intraday time frames too.
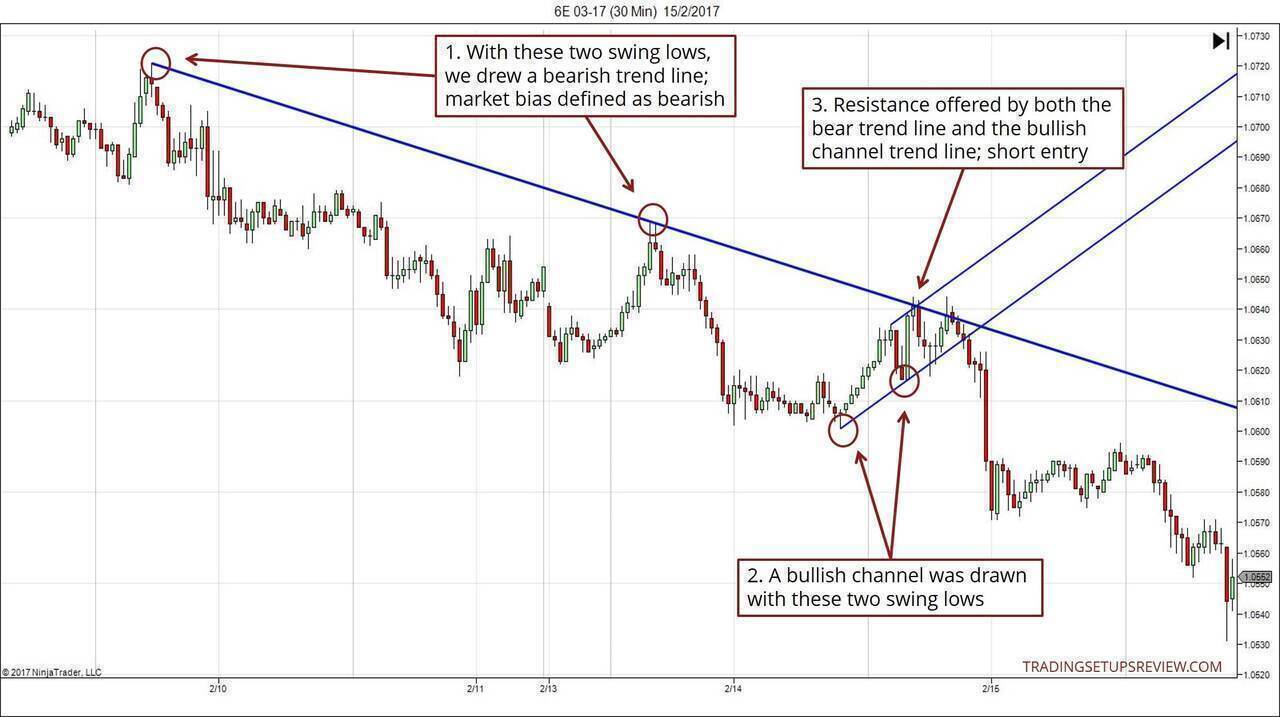
1. With these two swing highs, we projected a bear trend line.
2. We drew an opposing bull channel with these two swing lows.
3. Both the bear trend line and the bullish channel trend line resisted the pullback. The point where they intersected offered an excellent short entry point.
Look closely at both examples. You will notice that both charts showed double bounces off the trend line, before resuming the trend in each case. Such mini double top/bottom formations are common in setups featuring complex pullbacks.
Example#3 - Close-up Price Action
This chart shows two instances of the setup at a scale that displays individual candlestick detail.
(Click on the chart to enlarge.)
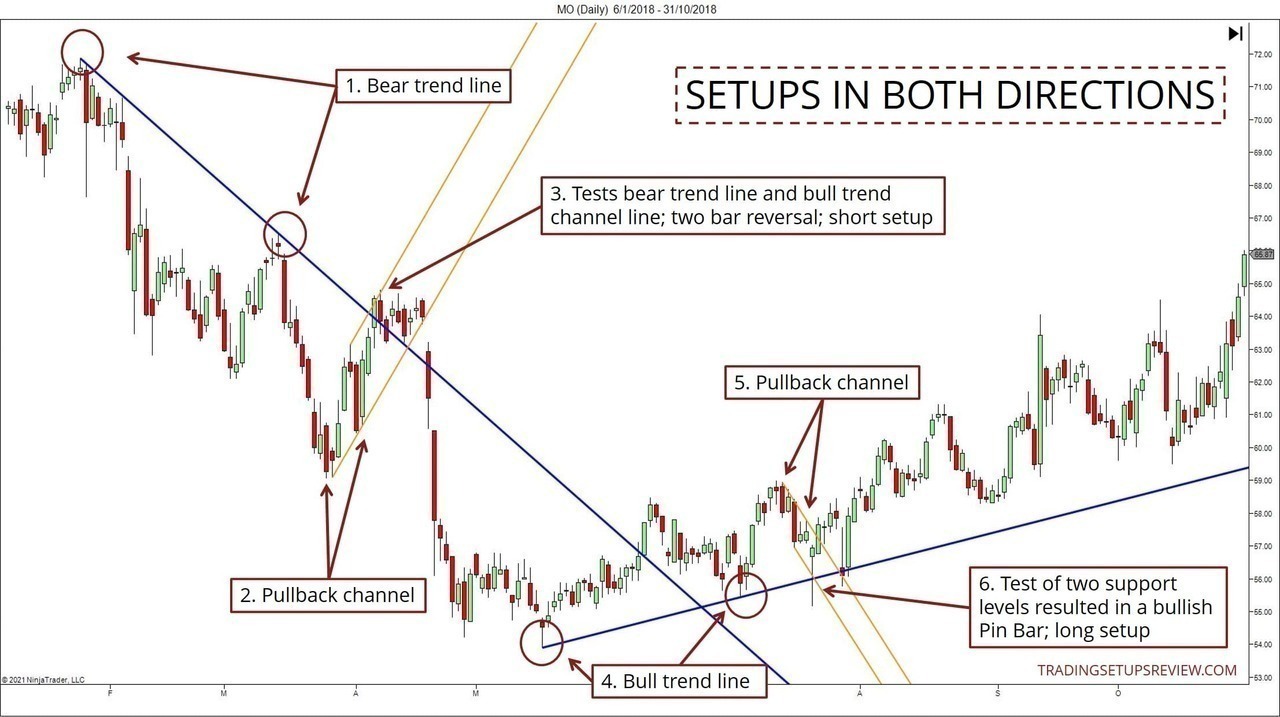
- From these two swing highs, we projected a bear trend line.
- With the swing lows formed in the pullback upwards, we marked out a bullish trend line channel.
- The test of the bear trend line coincided with the market trying to poke above the channel. The two-bar reversal at the resistance area offered a chance to short.
- As the market trend reversed, we projected a bull trend line from these two swing lows.
- A minor pullback channel formed here.
- The bull trend was not as established as the bear trend we relied on for the first setup. However, the bullish Pin Bar improved the outlook of this potential trade.
The trick to finding these trades is to pay attention to the formation of swing pivots. With practice, you can even spot these trades before you actually mark out the pullback channels.
Conclusion - Pullback Trading With Trend Lines and Channels
This pullback strategy is a minimalist trading method with great potential. Importantly, it reinforces good trading habits through the usage of trend lines and channels.
- First, the trend line forces you to pay attention to the trend and price action.
- Then, the price channel helps you to find extended and probably steep pullbacks against the trend. These high-angle pullbacks tend to fail spectacularly, leading us into the best pullback trades.
But there is a common pitfall. Traders often get confused because they are unsure how to select the swing pivots for drawing the trend lines. They also lack a clear set of rules for drawing the trend lines and channels. So first, you must figure that out.
Develop a systematic way to identify swing pivots, and to draw trend lines and channels. Then, make an effort to stay consistent. Don’t look back in time and try to adjust your trend lines after a trade.
In practice, maintaining consistency is crucial for making the most out of any trading strategy.
In the examples here, I’m using the trend line and channel techniques taught in the Day Trading With Price Action Course. You need not use the same methods. Instead of chasing after the best trend line drawing method, remember that consistency is more important.
Strategy Notes for the Day Trading With Price Action Course
In the examples above, we drew the trend lines using valid pivots as taught in the course. For consistency, it’s a rule you should stick to.
As for the opposing channels we use to identify pullbacks, it’s okay to mark them with basic pivots. This relaxation is a tweak for this approach to find spot setups. (That’s what we did in Example #2 and #3. It explains why the pullbacks in those examples are less complex than the one in Example #1.)
After all, as mentioned, we are relying on the tension to resolve in favor of the market trend. In essence, we are fading the opposing channels. Hence, it makes sense to use the less significant basic pivots to draw them.
The article was first published on 10 March 2017 and updated on 27 May 2021.