How To Exit Your Momentum Trades With Trend Line Channels
By Galen Woods ‐ 6 min read
Trend line channels are excellent tools for exiting your trades. They are valuable tools for momentum traders who must take their profits in a timely way.
How many times have you caught a powerful burst of market momentum in your trades? Did you hesitate to grab your profits?
How often did you end up giving back a huge chunk of your paper profits to the market?
Profit-taking is critical for momentum traders. Momentum does not last long. Not grabbing your profits in time risks turning a great momentum setup into a breakeven trade.
To avoid this painful situation, you must have a clear exit plan in place for your momentum trades. You need to choose a suitable trading tool and use it to time your trade exits.
There are many ways to exit your trades. But if you’re looking for a simple method rooted in price action, a price channel is ideal.
How do you exit your trade using a price channel?
Let’s take a look at three examples below. In the following charts, we’ll also take the chance to introduce a variety of momentum trading strategies.
Chart Examples - Channel Exit For Momentum Trades
Example #1: Impulse System - Forex EURUSD 5-Minute
You will find it easier to understand this example if you’re familiar with the Impulse System. You can click here to learn more about this setup by Dr. Alexander Elder.
Or, you can take the entry signal below as a given and proceed.
As this is the first example, we’ll dwell more on how to draw the channel.
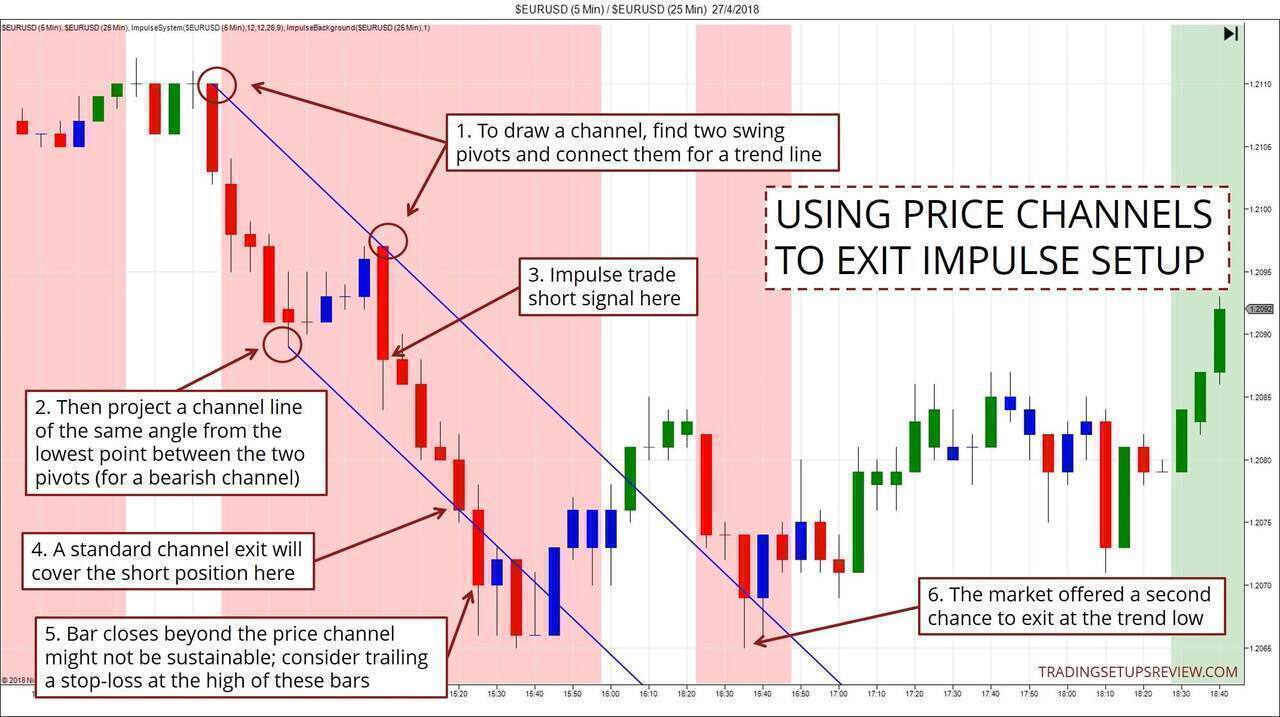
- To draw a price channel, you need two swing pivots. Connect them to get a trend line. Here, we connected two swing highs for a bear trend line.
- Then, project a line (at the same angle as the trend line) from the lowest point between the two pivots. The channel must contain all price action before the market falls below this point.
- The Impulse System fired a short signal here. The red background reflects the bearish momentum on the higher time frame (25-minute).
- Applying a standard channel exit, you would cover the short position here.
- You might be tempted to let the trade run further. But be cautious as a pullback is more likely once the market exceeds the channel. Consider tightening your stop-loss at this point.
- For this trade, the market formed a double bottom and offered a second chance for us to exit at the trend low. Many momentum trades are less forgiving. Furthermore, some traders would have covered their position earlier when the market rose near the breakeven point.
Example #2: Bollinger Band Breakout - Stock KO Daily
Let’s move on and look at a more advanced example here.
The tricky parts of this example are the multiple price channels and the introduction of the 200% line.
Work through it slowly, and you’ll gain more insight into the potential of using channels to take your profit.
This example focuses on a simple Bollinger Band breakout.
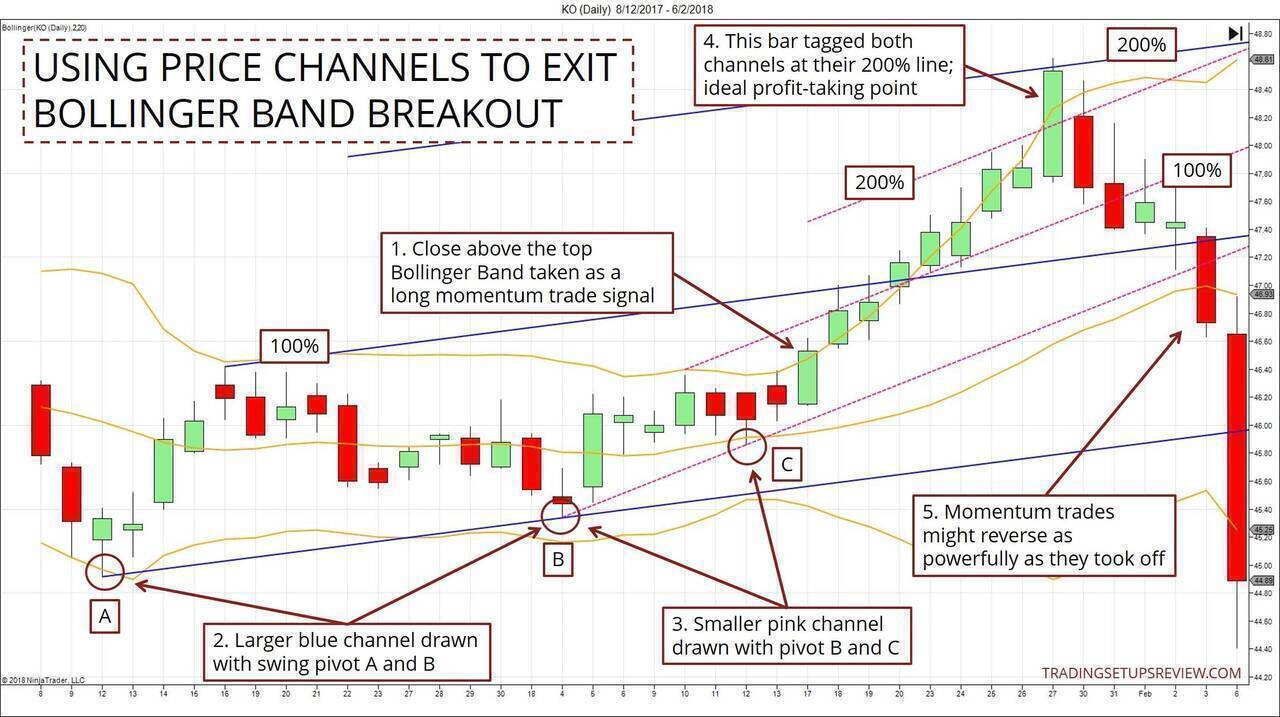
- A close above the top Bollinger Band triggered a long momentum trade.
- This larger channel (blue) was drawn using pivot A and B.
- This smaller channel (pink) was drawn with pivot B and C.
- This bar tagged the 200% channel lines of both channels. It was a clear signal for the momentum trader to exit. It’s extremely rare for trades to move substantially beyond the 200% line without a correction. (Exceptions include incredibly narrow channels, not unlike the pink channel here.)
- This example also showed the importance of trade management for quick momentum trades. A few price bars can make the difference between great profits and a regretful loss.
This example prompts obvious questions.
- Why did we consider the 200% channel line as potential targets in this example?
- Why did we then use the 100% channel line in the first example?
Let’s say you considered the typical channel lines (100%) as potential targets here. In that case, you would not have entered this trade due to its poor reward-to-risk ratio.
The 200% channel line is a more ambitious price target. Hence, we can only justify it if we expect a powerful breakout trade. This is exactly what we were gunning for in this example - a breakout from a period of sideways price action.
Compare this to Example #1.
In that example, the momentum trade took place within a trend continuation context. The market has been descending, and the potential momentum is smaller than that of Example #2. Hence, in that example, we stayed conservative and used the 100% line.
Note for Course students: B was a valid pivot. C was a basic pivot. For trend determination, always use valid pivots. But you can use basic pivots for drawing price channels used for targeting.
Example #3: Triangle Breakout Trade - Stock MSFT Daily
A channel is not always the best choice for exiting a momentum trade. Always examine the setup as a whole to choose the most suitable targeting option.
In the example below, there’s a choice between using a channel or a chart formation for profit-taking.
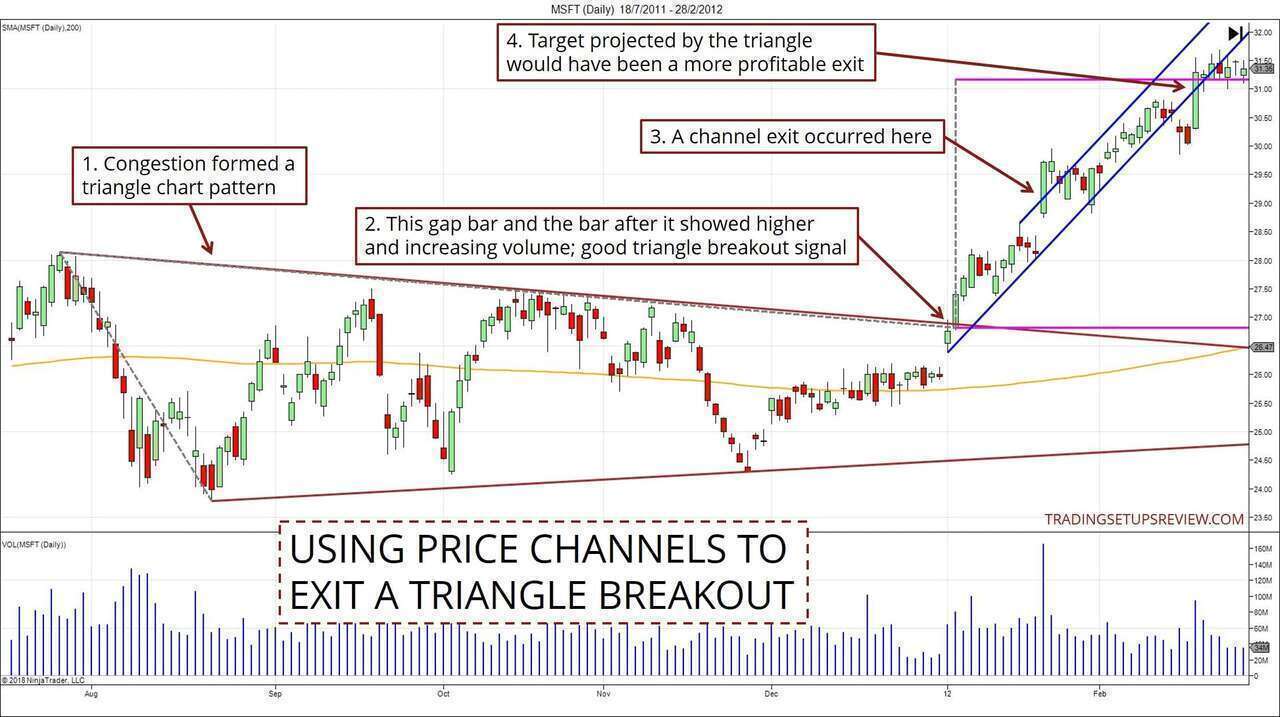
- In this example, let’s zoom in on this triangle chart formation.
- The upward gap took place with increased volume. The next day’s price action also continued the upthrust with increasing volume. These are signals of impending bullish momentum.
- If we were using a channel exit, we would have exited here. Together with the climactic volume, it was reasonable to judge that the market was exhausted. (There were other channels we could draw, but this price channel anchored to the gap bar was the most recent one.)
- This pink line showed the target projected by the triangle formation. It provided a more profitable exit for this trade.
With hindsight, it’s easy to say that the target projected by the triangle worked better.
But was there a valid reason to think so as the trade was unfolding?
There’s no straightforward answer. You must consider this within the context of your entire trading plan.
Some food for thought:
- Since the triangle is the basis for this trade, its projected target takes precedence. Also, this chart pattern formed over a considerable period. Hence, its breakout should lead to a more significant market move.
- Taking half your position off at the channel exit and letting the other half run to the triangle-projected exit is an option.
- Given that you expect an extended move, why not consider targetting the 200% line instead?
Conclusion - Price Channels As An Exit Tool
A price channel is a useful tool for profit-taking, but it’s not perfect.
Also, bear in mind that exiting with a price channel means that you are using a dynamic target. It’s not set-and-forget. You need to modify the trend line according to new price action. You also need to adjust your target limit order along with new price bars.
To make the most out of price channels, observe how the market interact with channels of different degrees. (e.g. 100%, 200%)
If you like this article and want to learn more about trading with channels, check out: