Three Black Crows Candlestick Pattern Trading Guide
By Galen Woods ‐ 9 min read
The Three Black Crows candlestick pattern offers a great price action tool to anchor our market analysis. Learn to make the most out of this pattern.
Three Black Crows is a bearish candlestick pattern that you can identify quickly. This pattern does not form frequently, but they stand out visually. While the convention sees it a short setup, you’ll learn that this is not always the case.
The Three Black Crows pattern is worth studying because it shows sustained bearish action. But it does not mean that you should take on a short position indiscriminately. This reminder is the main thrust of this guide.
You’ll learn that it is your assessment that is important. Your evaluation of the market decides how you should trade the Three Black Crows pattern.
But first, let us define this ominous candlestick pattern.
What is the Three Black Crows Candlestick Pattern?
I have come across a few variations of the Three Black Crows pattern. They generally comprise three bearish candlesticks pushing lower.
Some traders define them qualitatively.
Others take a more quantitative approach. These traders can encode their identification with price action rules.
Here, we will use NinjaTrader’s CandleStickPattern indicator, which is available by default on the platform. The pattern definition below corresponds to it.
Pattern Definition
The image below shows the Three Black Crows pattern.
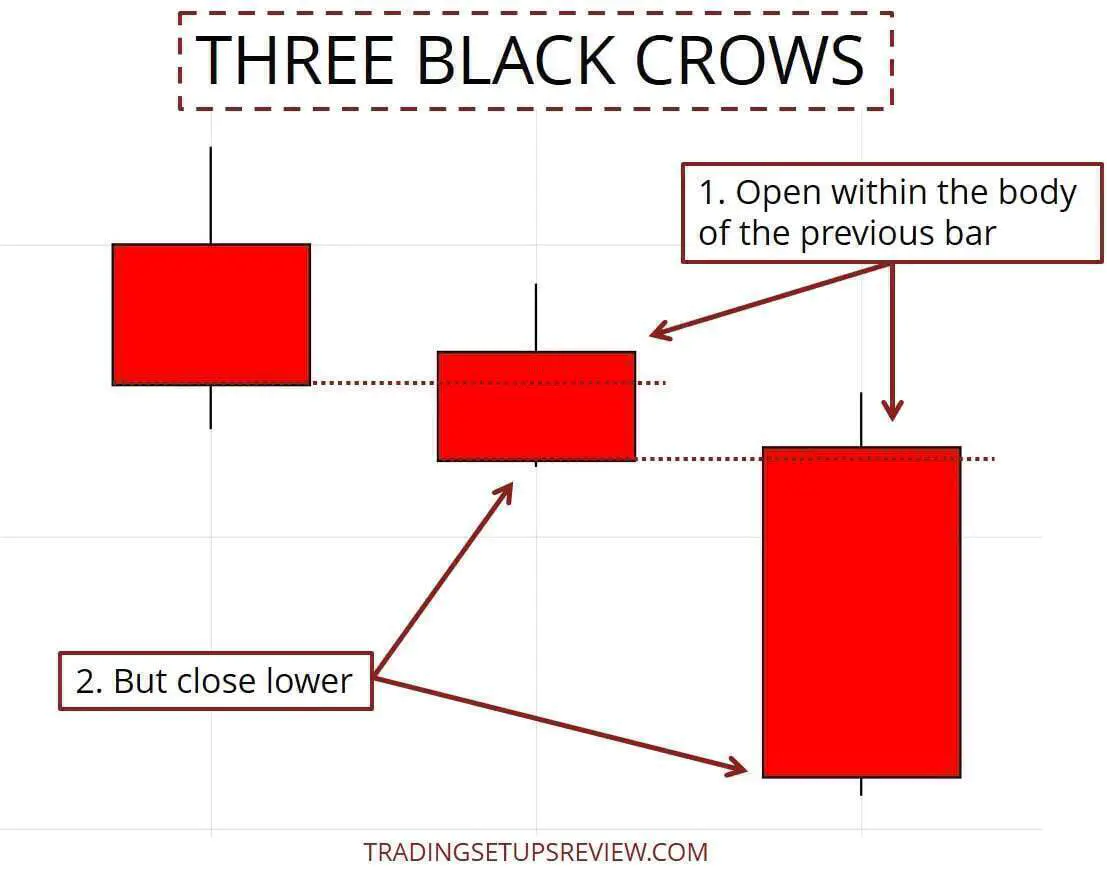
This pattern requires three consecutive candlesticks. All three candlesticks must have bearish bodies. (Close < Open)
The second and third candlesticks must:
- Open within the body of the previous candlestick; and
- Close below the closing price of the previous candlestick
Together, these rules mean that the candlesticks open with an up gap before closing lower than before.
Some traders are not strict with the presence of these up gaps. But I find that the up gap is the cornerstone feature of the Three Black Crows candlestick pattern.
Each period opens with an up gap, before closing even lower than before.
Hence, each period begins with high bullish hopes that were smashed by the end of that period.
This feature charges the Three Black Crows pattern with strong market emotions.
For the code readers, this is the relevant pseudocode extracted from NinjaTrader:
Close[0] < Open[0] && Close[1] < Open[1] && Close[2] < Open[2]
&& Close[0] < Close[1] && Close[1] < Close[2]
&& Open[0] < Open[1] && Open[0] > Close[1]
&& Open[1] < Open[2] && Open[1] > Close[2]
Pattern Failure
This pattern is fascinating, not because it always works.
Instead, it is worth a close look because it grabs the market’s attention. It stirs up emotions among traders.
Hence, in our discussions below, we will also highlight the failure of the Three Black Crows pattern.
This pattern fails when the market rises above the high of its first bar. The chart below shows an example.
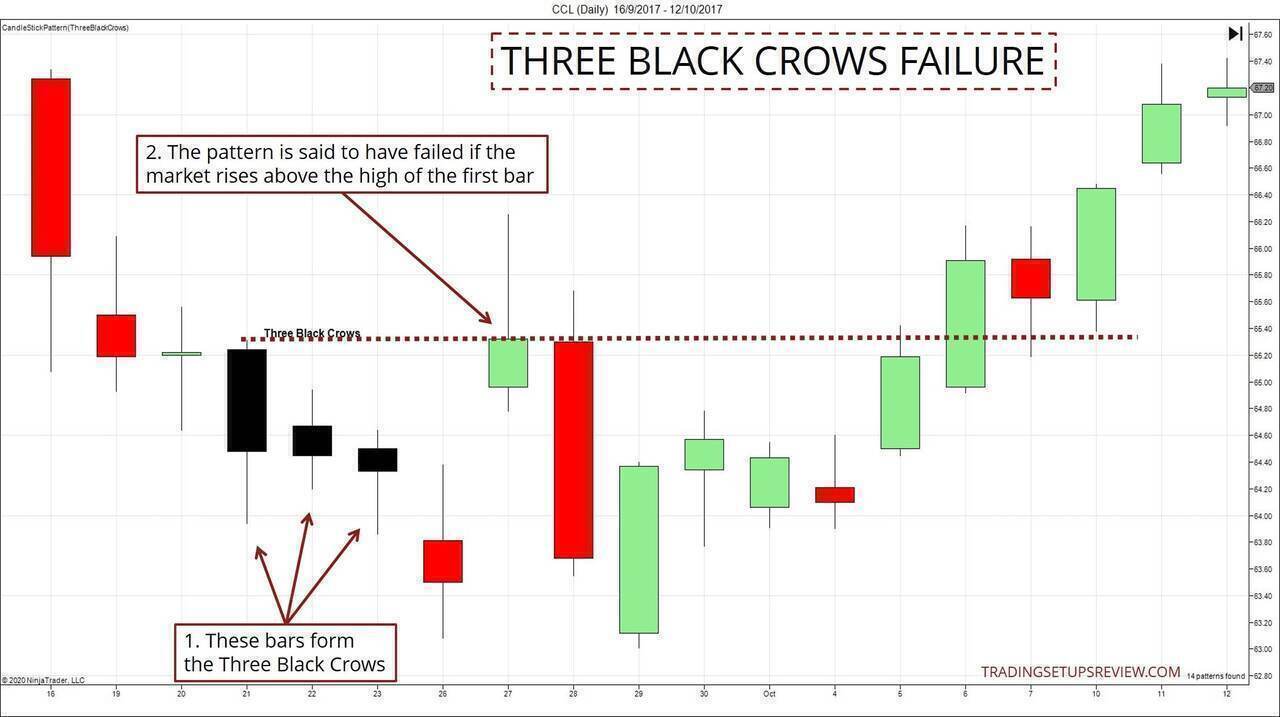
- These three candlesticks form the Three Black Crows.
- When the market rises above this level, we get a pattern failure.
How Do We Trade It?
The Three Black Crows is a bearish formation in the sense that it pushes the market down. But we can trade it both ways, as you’ll see in the examples below.
We have one rule:
- Do not enter the market immediately after a Three Black Crows candlestick pattern.
The response of the market to a Three Black Crows pattern is crucial. And we want to factor that into our trading decisions.
- Will the bearish force continue?
- Are the bears exhausted? (Sharp bullish reversal?)
To answer these questions, we need to examine the context.
Traders gravitate towards price patterns that stand out. The Three Black Crows candlestick pattern is one of them.
There are two ways to approach price patterns:
- We can look for every candlestick pattern and try to incorporate them into our analysis.
- Or, we can focus on a couple of significant patterns. Then, concentrate our effort on relating them to the context in which they emerged.
I find the latter to be more productive. It is also more accessible for traders who are new to price action analysis.
In essence, we will look for Three Black Crows patterns and use them as an anchor for our price action analysis.
This is why we will focus on reviewing chart examples instead of stating rigid trading rules.
Trading Examples - Three Black Crows
Example #1: Crows and Windows
In this example, we are using windows (or gaps) to define the market environment.
In candlestick-speak, windows are unfilled gaps that the market has not traded within. They are useful for marking potential support and resistance zones.
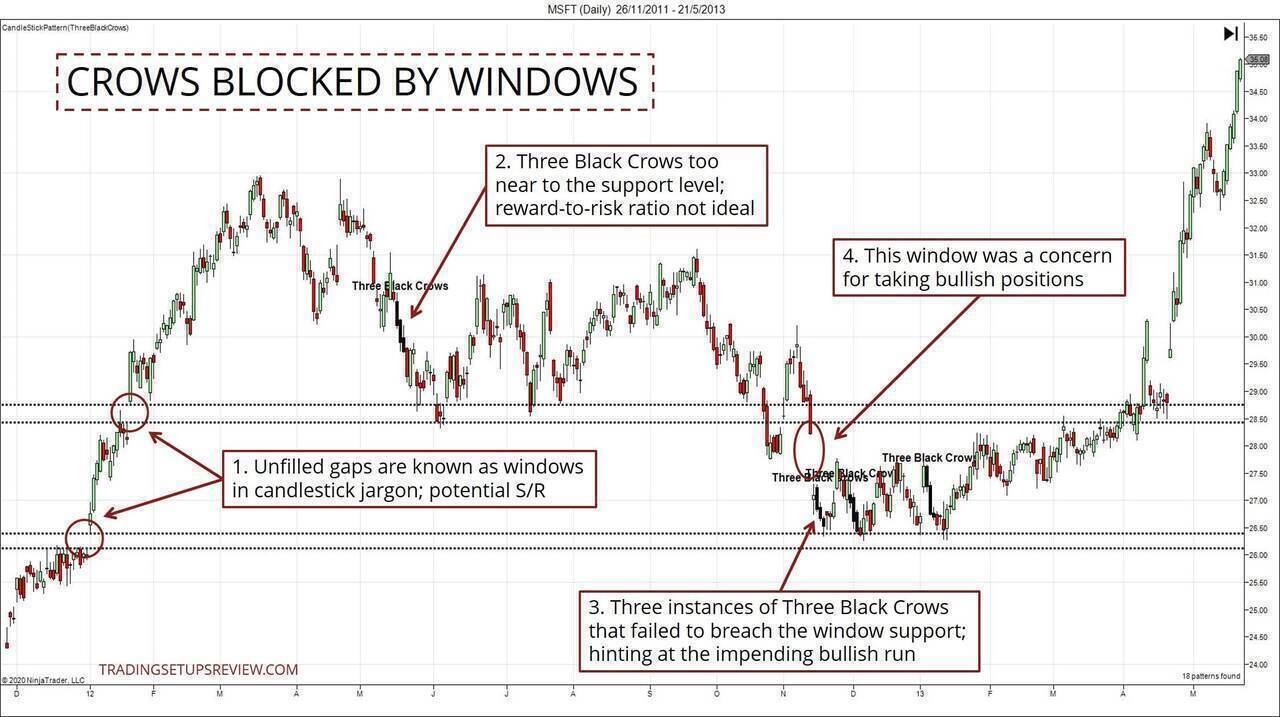
- These are two windows formed by the rising market. These windows served as potential support zones.
- The first Three Black Crows pattern on this chart formed just above a support zone. Its proximity to the support limited its profit potential, so it was not a tempting bearish setup.
- Here we found three instances of Three Black Crows forming around the same price region. It was a fascinating formation. But the most important takeaway here is this. Despite such bearish formations, the market could not breach below the support zone. This observation had massive bullish implications.
- However, realistically, it was not easy to commit to a long position. This is because of another window hovering just above the market then.
One practical way to trade the bullish reversal is to wait for the market to test the gap (pointed out in Point #4).
Then, place a buy limit order at the lower end of the gap. The working hypothesis was that the lower end of the gap was a support level. In this case, volatility stop-loss offers a way to control our risk.
Example #2: Three Black Crows With Different Meanings
We are working with an objective definition of a Three Black Crows candlestick pattern. But it’s never a good idea to interpret them indiscriminately as a bearish formation.
The chart below shows two patterns that point to entirely different directions.
(I’ve applied a tool from my course to help highlight the congestion zones below. They are the blue shaded zones. You can click the image to enlarge.)
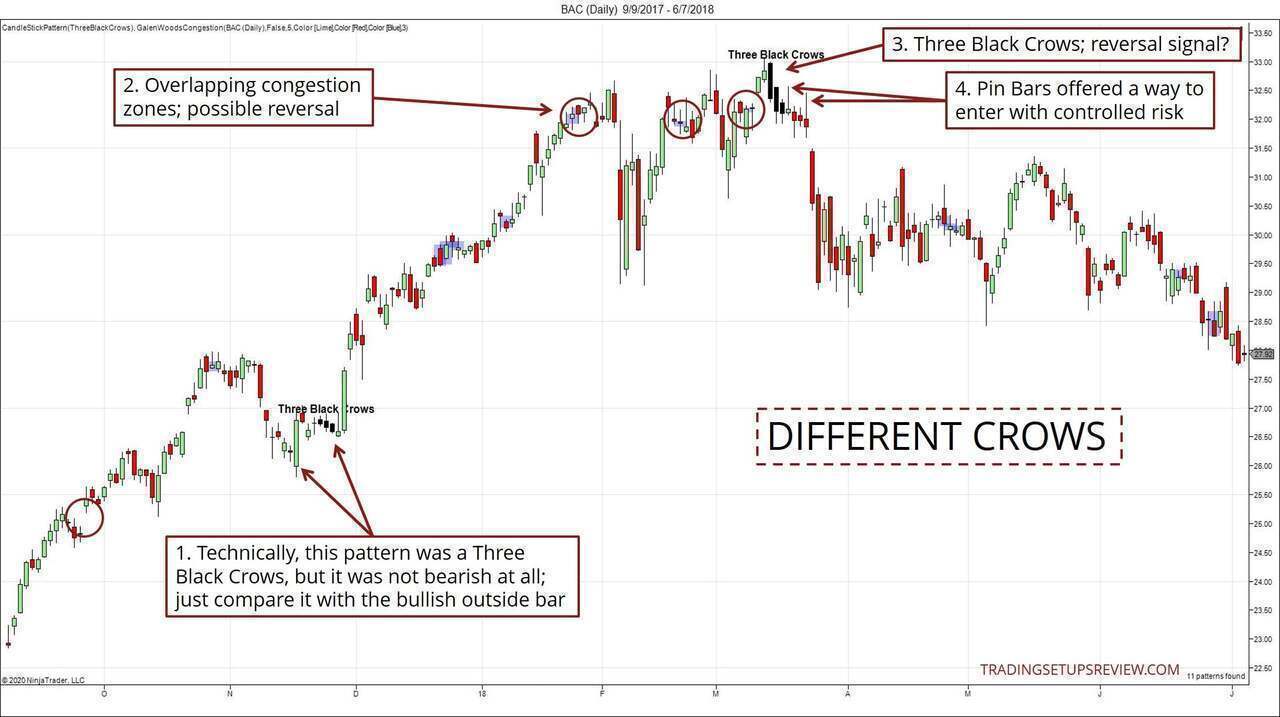
- Technically, this pattern satisfied our definition of Three Black Crows. But the range it covered was just a fraction of the bullish outside bar formed a few bars earlier. Hence, it was hardly bearish, and we could even take this disappointing Three Black Crows as a bullish sign.
- These three circles point out congestion zones forming around the top of the bull trend. Such clusters signal a struggling trend. This offered a bearish context for the subsequent Three Black Crows.
- The market tried to rise and move away from the consolidation range. But it was rejected with force. The result was a Three Black Crows pattern. Unlike the first instance, we can see this pattern as a reversal signal.
- For aggressive traders, these Pin Bars offered reversal setups with controlled risk. They could place stop-losses above these Pin Bars.
Example #3: Trend Lines and Channels
As you have seen, the context is critical for analyzing candlestick patterns. And trend lines and channels are among the best tools for tracking the market bias.
In this example and the next, we’ll see how these essential tools work. They help interpret Three Black Crows candlestick patterns.
If you’re not familiar with trend lines and channels, check out these articles:
- 4 Effective Ways To Trade A Channel
- Trend Line Channel Trading Strategy
- Combining Trend Lines And Channels For Trading Pullbacks
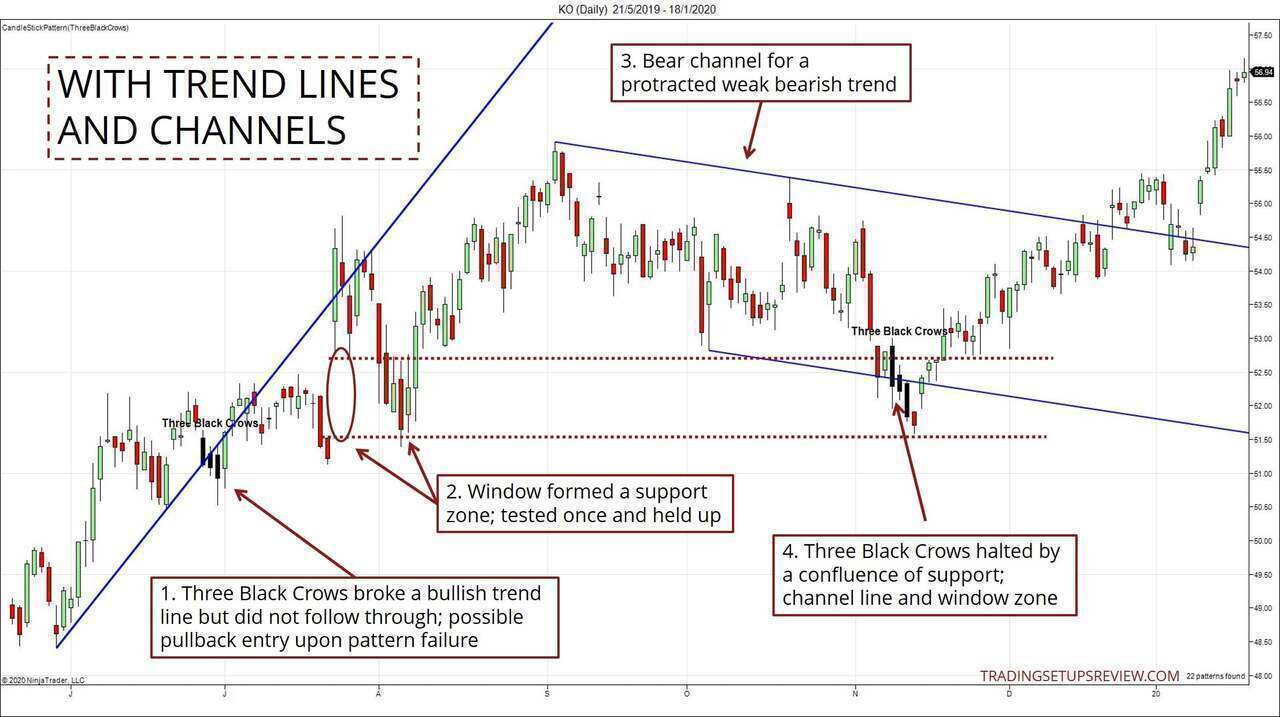
- This pattern kicked off with a small down gap to test the bull trend line. There was no decisive break of the trend line, which could be serving as support. Consider a long pullback entry upon the failure of the Three Black Crows.
- This gap, or window, held up as a support level. The market tested it once, and it held up.
- The sideways action here defined a broad and gentle trend channel.
- This second pattern pushed into a confluence of support: the window and the channel trend line. Fading this bearish thrust was a reasonable bullish strategy.
For a long setup based on a Three Black Crows pattern failure, the lowest point of the pattern is the natural stop-loss.
Example #4: Bearish Reversal
Traditionally, the Three Black Crows point to a bearish reversal. However, so far, our examples showed more bullish setups.
This example shows how this pattern works in pinpointing a bearish reversal. But again, I want to emphasize that it’s the market context, not the pattern, that is the key.
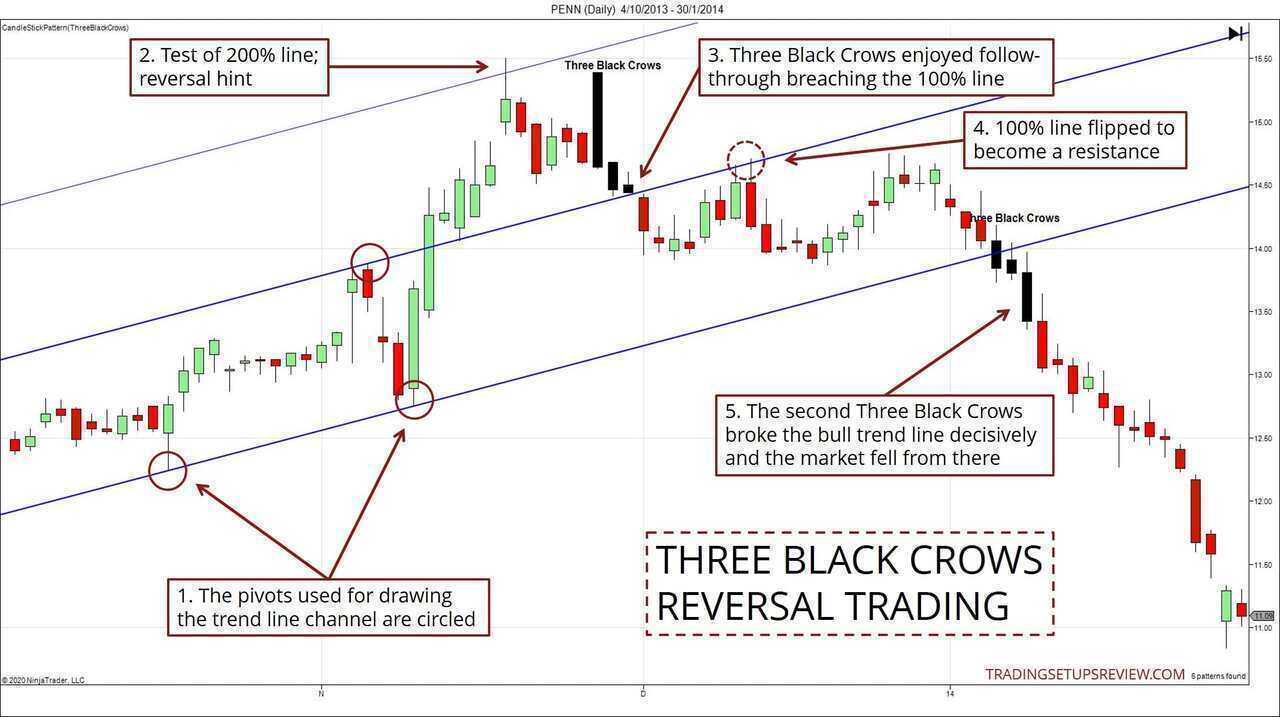
- For clarity, I’ve circled the pivots used to project the trend channel. A 200% channel extension has been added.
- A test of the 200% line is a hint at market reversal or stalling. (This article has intraday examples of the 200% line.)
- This Three Black Crows pattern had excellent form. Its first candlestick started with a tremendous up gap but closed lower. By doing so, it shattered the initial high bullish hopes. Also, it started a thrust that broke the 100% line.
- The 100% line flipping to resist the market presented another bearish beacon.
- This second Three Black Crows pattern broke the bull trend line with strength. From there, the bearish run began in earnest.
(For course students: note that the trend lines and channels in the examples conform to the framework taught in the course.)
Conclusion
Never enter a trade just because you find a candlestick pattern, even if the pattern is a powerful one like the Three Black Crows.
Instead, relate the pattern to the current market structure to focus your analysis.
In particular:
- Look at support and resistance. Did the pattern manage to or fail to breach the support and resistance zones?
- Look for other signs of weakness. Any other price patterns of interest?
- Compare the pattern with the immediate context. Were there price thrusts? Was the price moving sideways?
We have covered a series of examples without specifying an exact trading strategy. So if you’re new to price action analysis, you might find it hard to get started.
In that case, start by looking out for Three Black Crows that are testing support zones formed by gaps. (Like Example #1 and #3) This scenario offers a good start.
Finally, feel free to tweak the definition of the Three Black Crows. But understand the implication of any changes you make and do not make frequent changes. Consistency is vital for honing our analytical skills.
One common identification rule we did not use is to include only candlesticks that close near its low. You can try adding this to your pattern form checklist.
Let’s go bird-watching.