How To Find The Intraday Market Bias With Price Action
By Galen Woods ‐ 6 min read
Finding the intraday market bias of a trading session is the key to successful day trading. Learn how to use a simple price action tool for bias analysis.
The one thing that intraday traders hate is to get on the wrong side of the market. Fighting against the market bias is a drain on both your financial and emotional capital.
Hence, setting the stage for the price action of the next trading session is a critical step. For a minimalist method, start with a simple price action trading tool - the price channel.
A step-by-step guide to determining the market bias:
- Draw the most recent trend line channel based on the last session.
- Use the same trend line channel as a tentative structure for the price action of this session.
- Focus on the interaction between the channel and the price action to work out the market bias.
It’s much easier to _show _you what I mean than to explain further.
Let’s go on to the examples.
Intraday Market Bias Examples
The examples below come from four consecutive trading sessions of the S&P E-mini (ES) futures.
Each example shows two trading sessions. (Sessions are divided by orange vertical lines.)
- Example #1 - Session 1 and Session 2
- Example #2 - Session 2 and Session 3
- Example #3 - Session 3 and Session 4
In each example, the earlier trading session displays the origin of the price channel. The later session explains the utility of the price channel in judging the market bias.
100% lines refer to channel trend lines. 200% lines refer to a channel trend lines projected with 200% of the original channel width.
The swings, trend lines, and channels are drawn with an objective framework taught in my trading course.
NOTE: These examples are selective at random. They are meant to explain a general process of analyzing the market bias with price action. The aim of these examples is not to point out specific trading setups.
Example #1: Break of Bear Trend Line (Bullish)
This example shows an opening gap that rose above the bear trend line from the previous session. It pointed to a bullish bias.
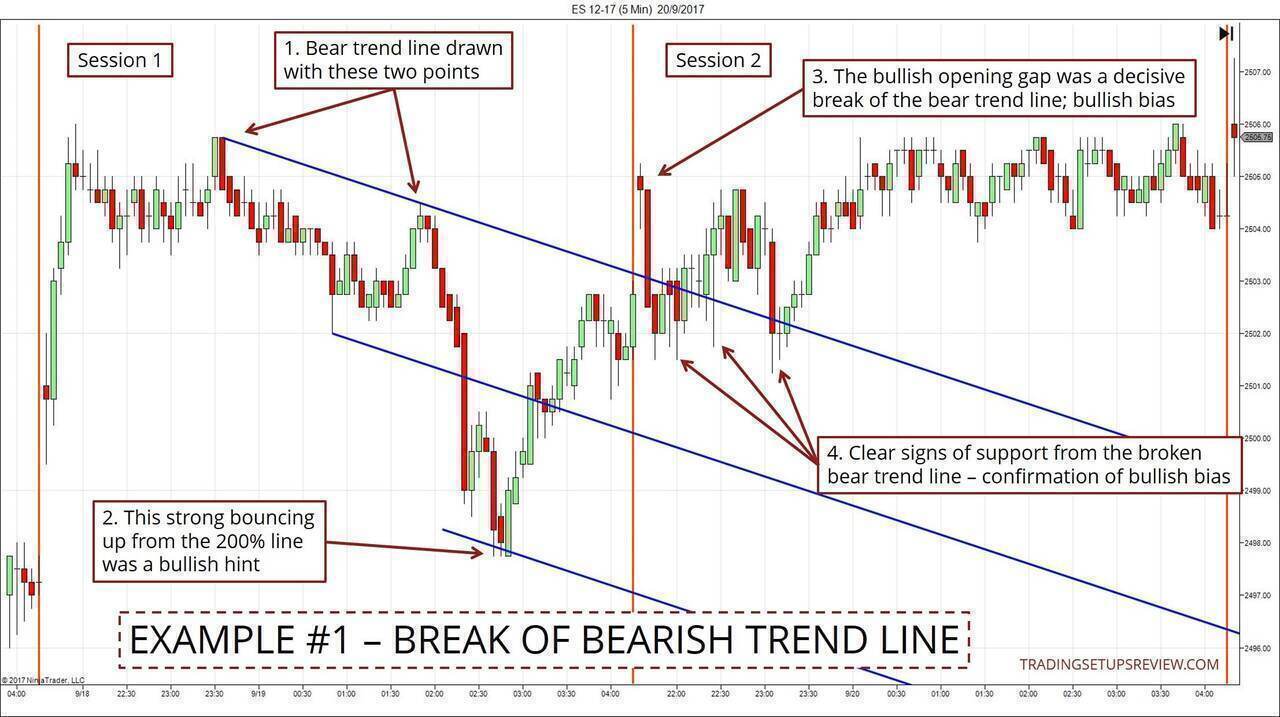
1. Using the price action in Session 1, you could draw a bearish price channel. Then, use this channel to analyze the market bias of Session 2.
2. Hitting the 200% line is a typical sign of exhaustion. The powerful bounce off the line implies bullishness.
3. This opening gap above the bear trendline dictated a technical bullish bias. Note that the entire opening price bar was above the bear trend line.
4. The broken bear trendline flipped into a support area. These bounces are possible long setups. At least, they served to confirm the bullish bias of Session 2.
Session 2 did not turn out to be a strongly bullish session. Nonetheless, if you intended to enter in the first half of the session, and to exit in the second half, being bullish had a slight advantage.
Example #2: Break of Bull Trend Line (Bearish)
This example shows Session 3 opening with a bullish stance. However, the tide changes swiftly as the bearish bias became evident.
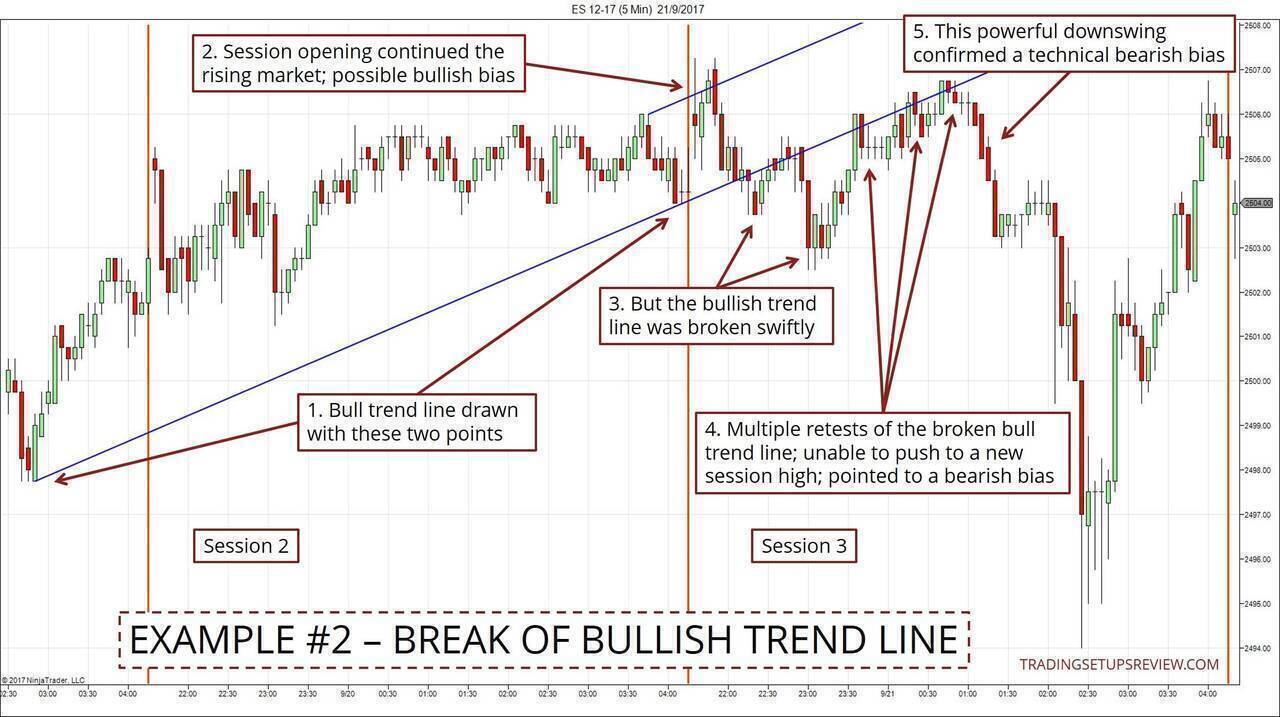
1. The anchor of this recent bull trend line was found two trading sessions ago in Session 1. Hence, it has greater significance.
2. Session 3 opened above the high of Session 2 and appeared to continue the bullish bias.
3. There was no reason to suspect a bearish bias until this break of the bull trend line. It was premature to conclude a bearish bias. But the bullish bias was certainly being challenged.
4. These three tests of the broken bullish trend line confirmed its role as resistance.
5. This substantial downswing confirmed that the market has turned bearish.
The example demonstrates the fluidity of market bias. Market bias is not fixed to a trading session. It changes within a session and may do so rapidly.
In the above example, the market proceeded to shoot up sharply after plunging.
Example #3: Trapped Within Bearish Channel
This example shows Session 4 adhering to a muted bearish bias.
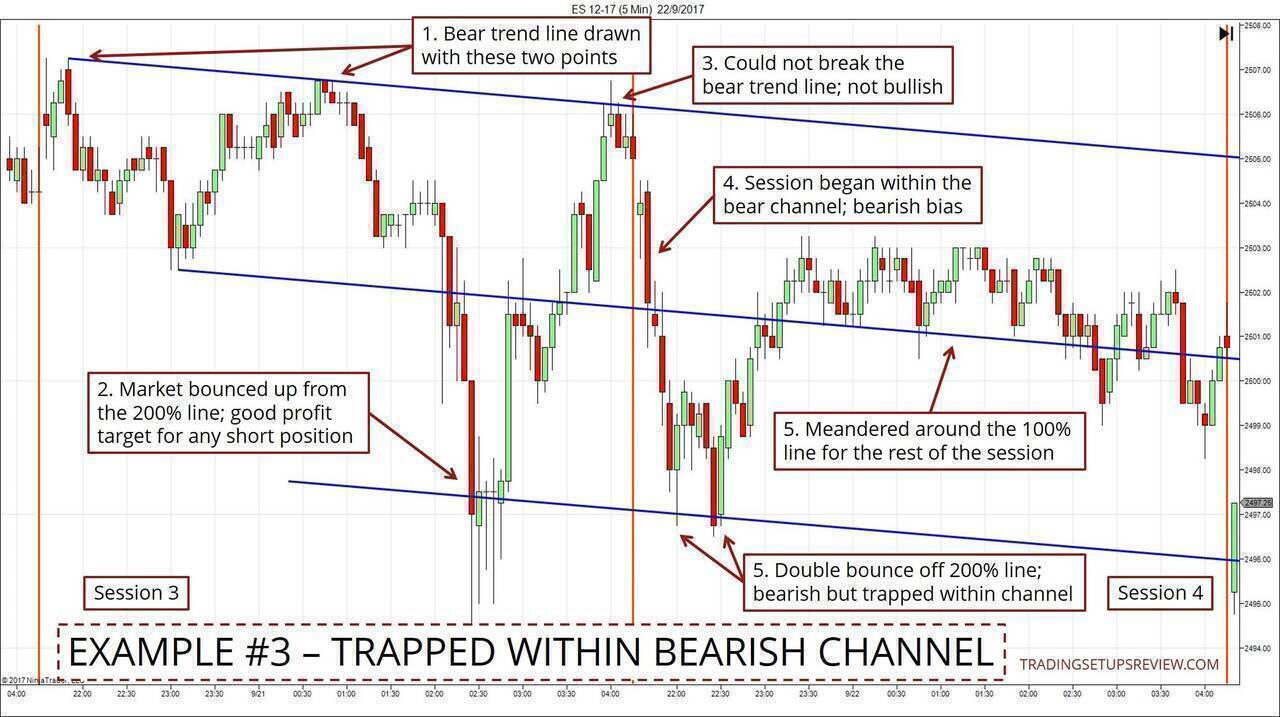
1. A bear trend line was drawn with two swing highs from Session 3.
2. Price bounced up sharply from the 200% line.
3. If the market had broken the bear trend line, it would have confirmed a technical bullish bias. However, it fell short of breaking the trend line. This led to bearish expectations for Session 4.
4. Session 4 opened lower within the bear channel and confirmed a bearish bias.
5. The minor double bottom at the 200% line was a sign of market support.
6. The market seemed trapped within this expanded price channel.
BONUS Example #4: The Larger Picture
This example shows Session 1 to 4, plus an extra two sessions. Here, you will also find the three price channels we went through earlier.
This big picture example seeks to show how these channels add value beyond the next session. These trend channels also work together to give you a more reliable market bias analysis.
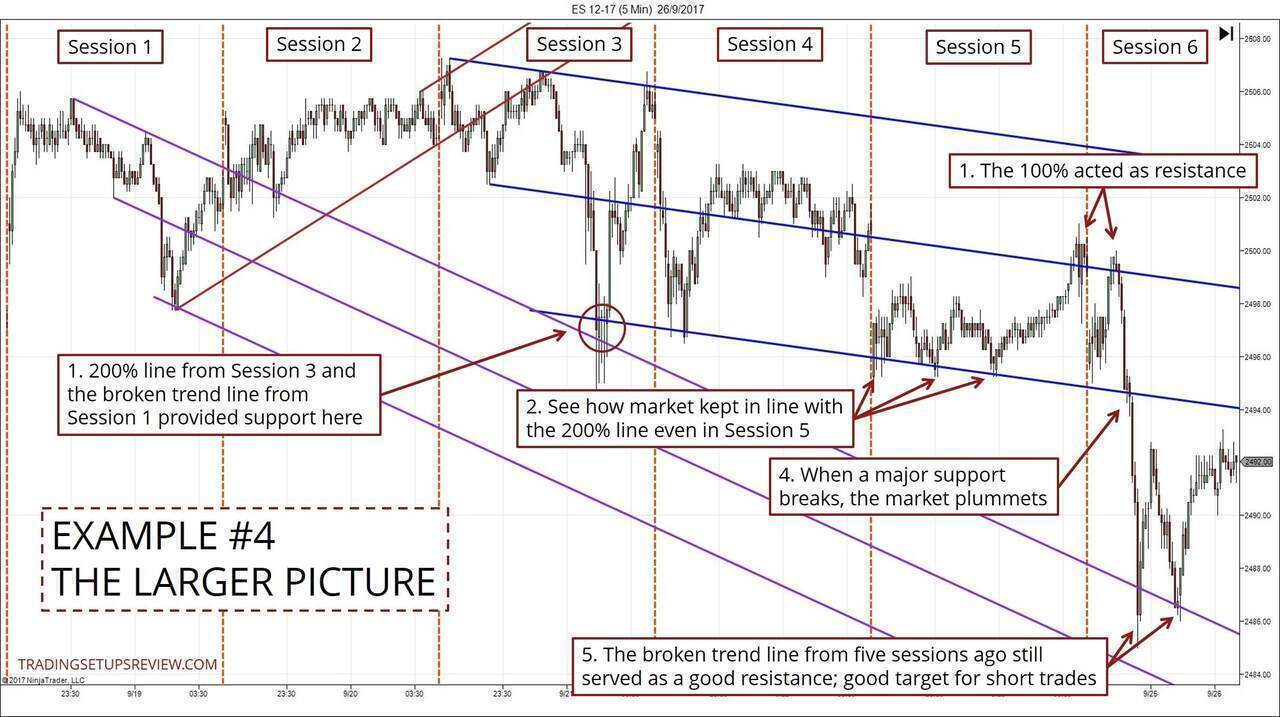
1. The most violent upswing in these examples was foreshadowed by a confluence of two major support: the 200% line of Session 3 and the flipped trend line from Session 1.
2. The 200% line from Session 3 proved to be a critical market support.
3. The market could not rise to the trend line. The 100% line halted it. This display of resistance was a bearish detail.
4. The market fell sharply, as it punches through a significant support.
5. The flipped trend line from Session 1 continued to be useful as a target area for short setups.
Conclusion - How To Determine The Intraday Market Bias With Price Action
A simple trend line channel drawn with the price action of the last trading session.
This is all you need to set critical support and resistance levels for the next trading session.
It is an objective tool for setting the stage and determining the market bias in the next trading session.
As you can see from Example #4, the analysis can get a little complex as you consider more price channels.
Hence, it’s important to focus on the most recent price channel as your primary tool. This is especially critical when you’re just getting started. As you gain experience, you can integrate channels from several sessions ago for more insights.
The method described here is just a starting point for determining the intraday bias.
It may not be the only tool you use to set the stage for the next trading session. But with practice, you will find that it’s an immensely helpful tool.