Two-Bar Reversal Pattern Trading Guide
By Galen Woods ‐ 8 min read
The two-bar reversal can be highly effective in the right context. With a few simple technical guidelines, you'll learn to find the best two-bar reversals.
The two-bar reversal is a straightforward but useful price pattern. However, some traders overlook this pattern precisely because of its simplicity. They believe that you can only trade profitably with sophisticated patterns.
Is that true?
As with all price patterns, it is the context that matters. So don’t fixate on intricate price patterns. In the right context, a simple price pattern can be a useful anchor for our analysis too.
Price patterns encapsulate trading concepts. These ideas are the result of the culminated experience of numerous traders. Hence, even for the same bar or candlestick pattern, you will find variations in the way they are defined.
For this reason, some traders gloss over the exact descriptions of these patterns. But that is unhelpful for new price action traders.
So before we start reviewing examples, let’s define a two-bar reversal price pattern.
What is a Two-Bar Reversal Pattern?
The basic form is simply two consecutive price bars that close in opposing direction.
- Bearish two-bar reversal - One bullish bar followed by a bearish bar
- Bullish two-bar reversal - One bearish bar followed by a bullish bar
A bullish bar closes higher than it opened. A bearish bar closes lower than it opened.
Characteristics of the best two-bar reversals
Looking for the basic form throws up too many patterns. Hence, the more practical approach is to focus on the best two-bar reversals.
- The best two-bar reversal patterns stick out. They don’t hide within a congestion area.
- The two bars are strong pushes in their respective directions.
- The two bars show significant overlap.
When I first encountered price action trading, I find phrases like “significant overlap” and “stick out” to be unhelpful. These vague descriptions make novice traders feel that price action is unapproachable.
Hence, I’m always looking for ways to introduce price action to new traders in a systematic way.
Here, I’m suggesting guidelines to clarify these terms for finding two-bar reversals.
Let’s Get Technical
To be clear, these are guidelines.
They help to identify specific characteristics of price patterns like the two-bar reversal. But they are by no means the only way to define two-bar reversal patterns.
Before we start, I’ll like to introduce the concept of the typical price.
Typical price = ( H + L + C ) / 3
To find the typical price of a bar or candlestick, you take the average of its highest, lowest, and closing prices.
In the guidelines below, we’ll be relying on the typical price to find the best two-bar reversals.
Diagram notes:
- The blue line across each bar is the typical price of that bar.
- The background shading indicates if the bar is a trend bar.
The diagram below shows the technical considerations of a bullish two-bar reversal pattern.
(Apply the same principles to derive the guidelines for the bearish pattern.)
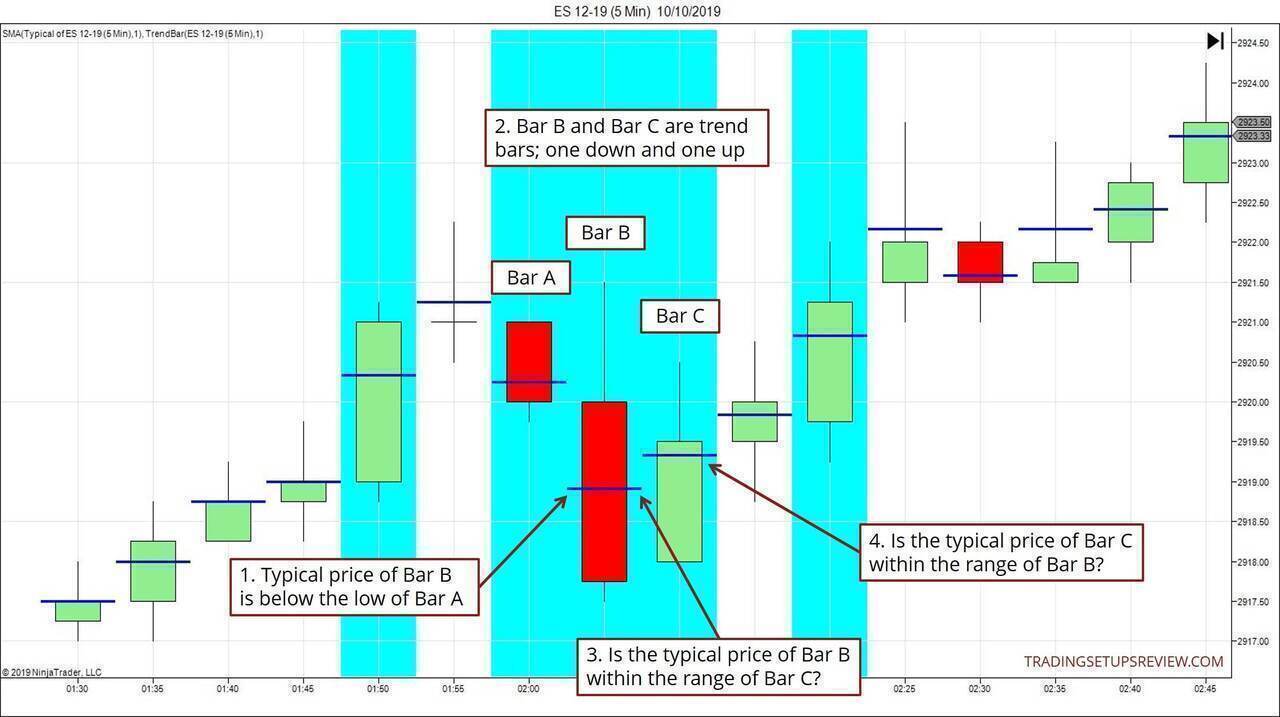
Technical Guidelines For The Two-Bar Reversal Pattern
In the chart above, Bar B and Bar C form the bullish two-bar reversal pattern.
To identify the two-bar reversals that stick out:
- The typical price of Bar B must be below the low of Bar A.
To find strength in both directions:
- Bar B and Bar C must be trend bars. (Not sure what’s a trend bar? Click here.)
To ensure sufficient bar overlap:
- The typical price of Bar B must be within the range of Bar C.
- The typical price of Bar C must be within the range of Bar B.
Make sure you understand these guidelines before reviewing the examples below.
In the examples that follow, we will be pointing out the patterns that conform to these guidelines. We will also discuss why those that do not fit might also offer reasonable trades.
How To Enter The Market With The Two-Bar Reversal
There are two common ways to enter the market with a two-bar reversal:
- Enter once the pattern completes (i.e., at the close of Bar C)
- Enter when the market breaks out of the setup bar (Bar C)
In the examples below, we will use the more conservative option - the breakout method.
Trading Examples
For better learning visuals, I’ve included the typical price of each bar in the examples below. (blue lines)
In the charts below, all references to two-bar reversals point at the second (final) bar of the pattern.
Example #1: Ford Stock Daily Chart
The chart below shows the market rising in a new bull trend.
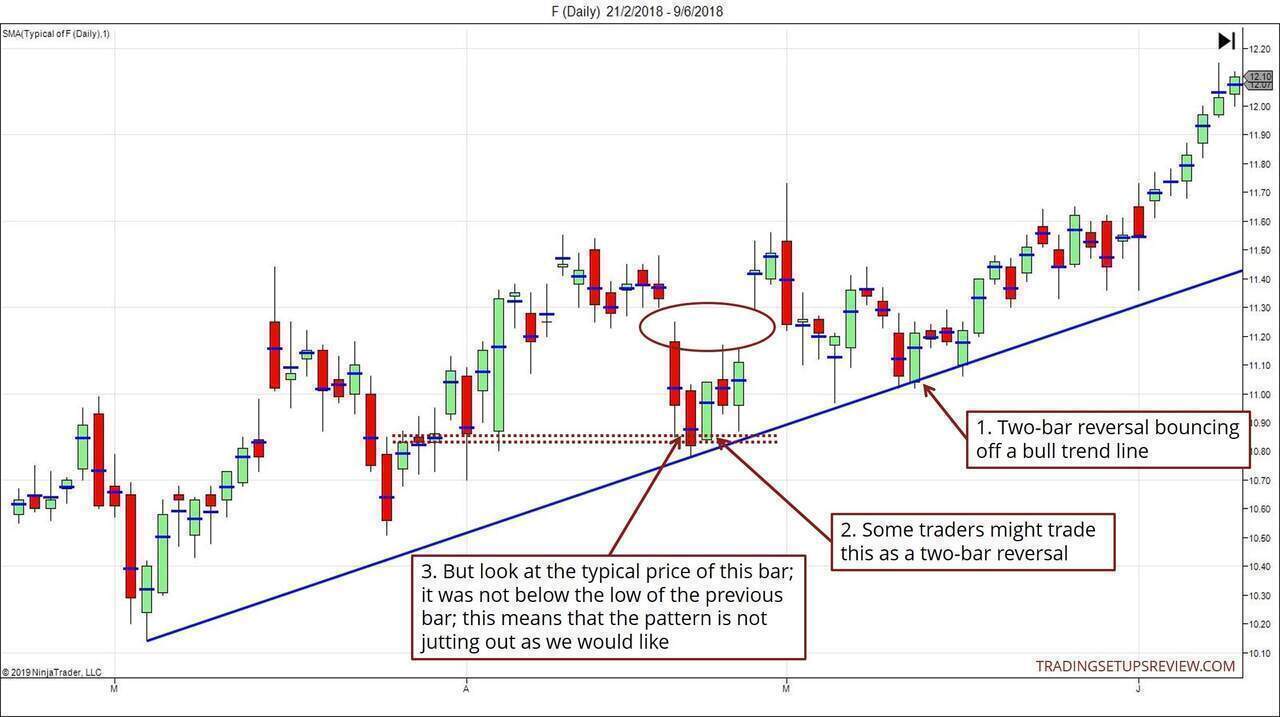
- This two-bar reversal pattern bounced off the new bull trend line. It was also the second test of the bottom of the circled gap area. With the confluence of two support devices, it was a reliable setup.
- Look at this earlier two-bar reversal price pattern.
- Its form is inferior to the pattern in Point #1 above. This is because it does not stick out as much. (Notice how the typical price here was not below the low of the preceding bar.)
Nonetheless, it was a reasonable trade as it found support from a congestion zone.
Example #2: FDAX Futures 3-Minute Chart
You can find the two-bar reversal pattern in almost all time frames.
Now, let’s look at an intraday example from the FDAX futures market.
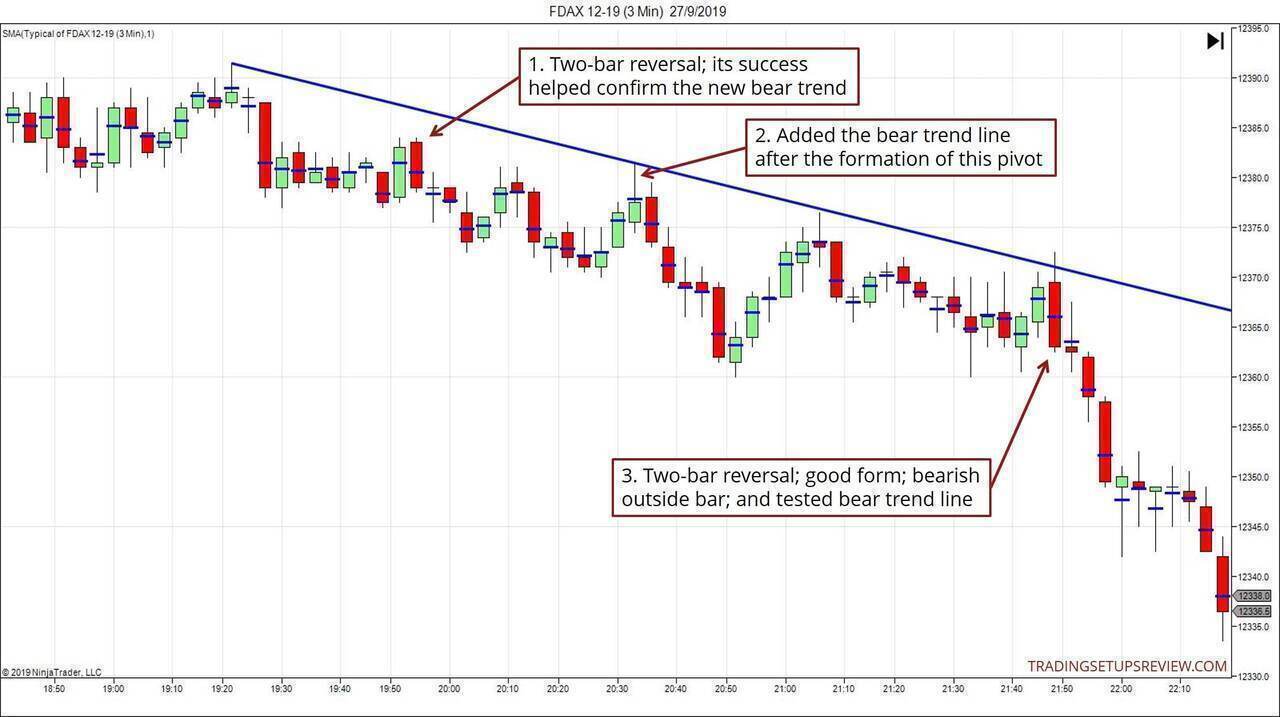
- Look at this two-bar reversal. Given that the market action has been drifting sideways at that point, it was not an ideal setup. However, its success in pushing the market down confirmed the start of a fresh bear trend.
- We connected the highest pivot in this chart with this new swing pivot to form a bear trend line.
- This two-bar reversal pattern was exceptional. It found resistance at the bear trend line. And it ended with a downwards outside bar, which affirmed the bearish strength.
(Note to course students: It was also a bearish congestion breakout setup.)
Example #3: EURUSD Daily Chart
Our technical definition for two-bar reversals gives us a good starting point. But we should not be too hung up on the exact form of the pattern.
This example shows two patterns. The first one fits our definition, and the second one is a borderline case.
At the end of this example, you’ll find that choosing the superior setup is not so straightforward.
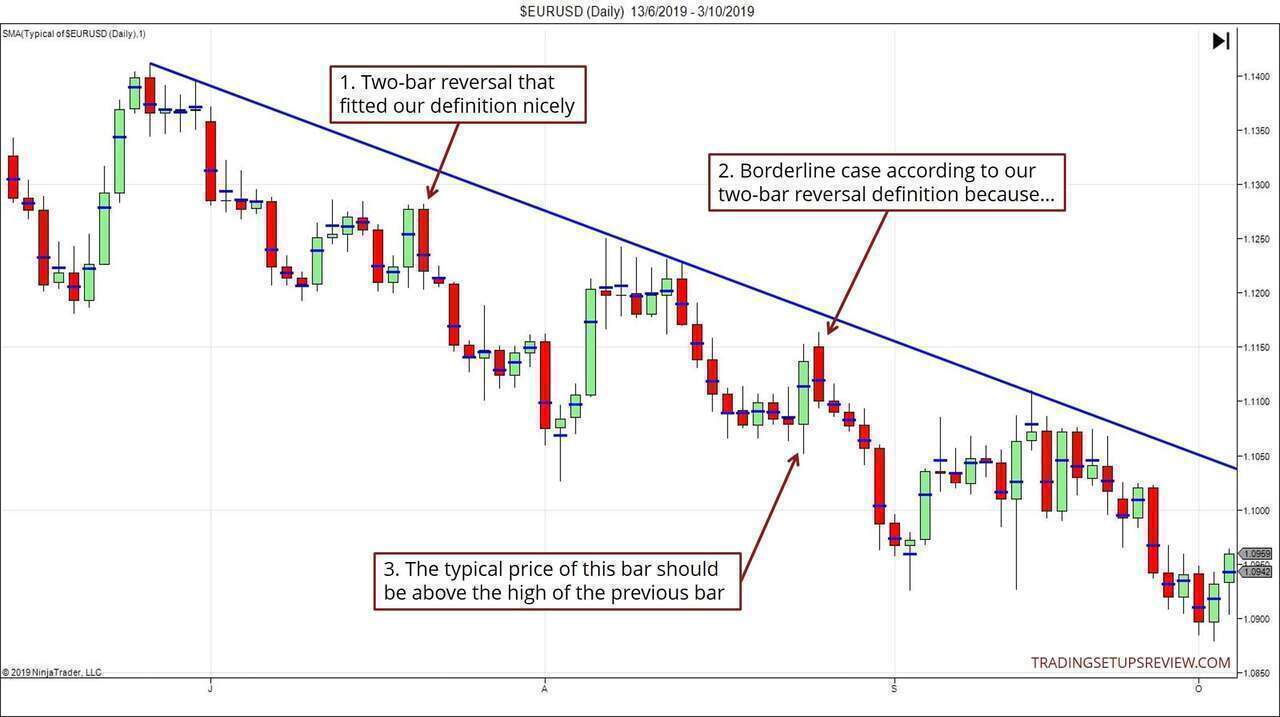
- This two-bar reversal pattern fitted our definition nicely.
- This instance was a borderline case.
- According to our rules, the typical price of the first bar of the two-bar reversal must be higher than the high of the previous bar. Here, the typical price was merely at the previous bar high.
Hence, you might conclude that the first pattern was superior.
But let us recall the rationale for this rule. It is to ensure that the pattern is not within a congestion area and that it juts out of earlier price action.
The first pattern in the example pushed above the preceding two bars.
The second pattern above pushed above the preceding five bars.
From this perspective, the second pattern did an excellent job of “sticking out” from surrounding price action.
Also, traders new to price action trading tend to assume that definitions are rigid and distinct. With some experience, you’ll soon learn that price patterns are always in shades of gray. Overlaps are commonplace.
For instance, the second two-bar reversal here is also an outside bar breakout failure.
Example #4: MCD Stock Daily Chart
The market structure supporting the two-bar reversal is critical.
With a two-bar reversal and a supportive structure, you get an excellent trading setup.
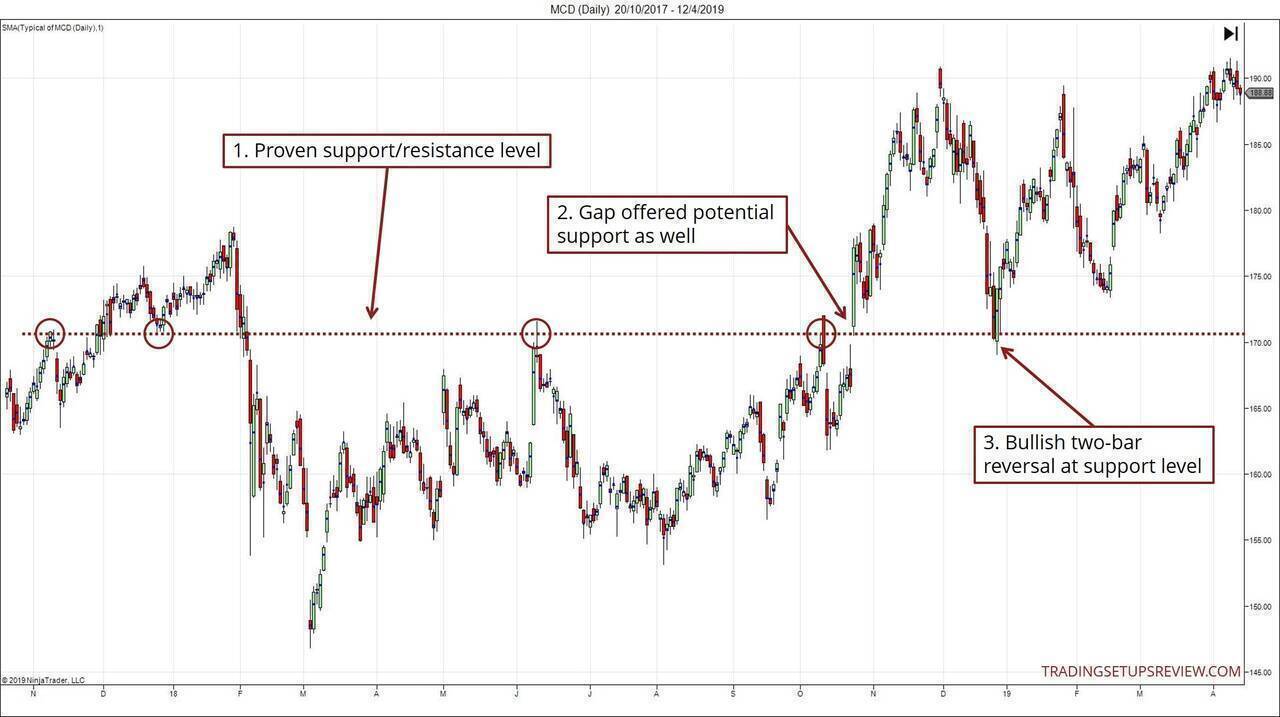
- The defining feature of this chart is the proven support/resistance zone. As you can see, multiple key swing pivots formed around this level.
- The gap away from the support level represented a potential support zone as well.
- This two-bar reversal had great form. It met all the technical guidelines stated above. It also ended the sharp fall from the top of the trend.
An aggressive trader might place a limit order to buy around the support level. For the conservative trader, the two-bar reversal offered an ideal entry point.
Example #5: Losing Example - GBPUSD 4-Hour Chart
I’m including this losing example to encourage a balanced perspective.
Remember that winning trades come with losing ones. A trader’s job is not to eliminate losses, but to strike a favorable balance between wins and losses.
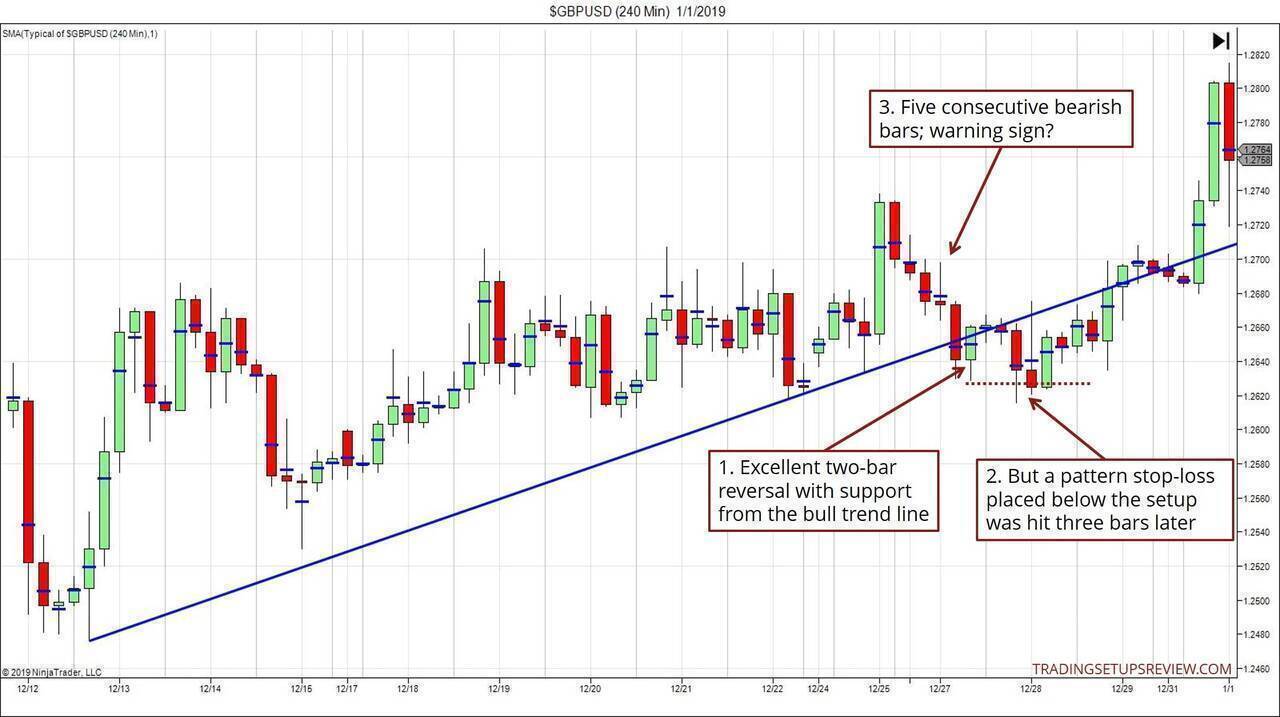
- A prominent bullish two-bar reversal with trend line support.
- However, its pattern stop-loss level was hit shortly after entry.
- The five-bar downward thrust was a sign of bearish momentum. A prudent trader might have waited for a re-entry, which turned out successful.
When a trade fails, ask yourself if it’s a timing issue or has the market bias changed or if you got it wrong in the first place.
If it’s a timing issue, consider a re-entry.
Conclusion - Two-Bar Reversal Trading Guide
The two-bar reversal is a classic trading pattern. Combine it with support and resistance, and you have a sound basis for a price action strategy.
Using the typical price measure, we proposed a definition for the best two-bar reversals.
(You can design such guidelines for other price patterns too. Use the typical price as a way to define otherwise vague price action concepts.)
But in the examples, we pointed out patterns that do not fit our description. Some were valid and profitable too.
What’s going on?
The technical guidelines offer a starting point for new price action traders. As you gain more experience, you need not follow these form guidelines rigidly.
The exact definition of the pattern is always secondary. Your primary concern is the market context, which comprises critical support and resistance levels.
This is the crucial learning point you should take away from the examples above.
Regardless of the price pattern, it’s best to start with an objective definition. Then, as you gain experience, you can justify deviations from your initial guidelines.
This trading approach ensures that you are as systematic as you are flexible.
(This is the approach I adopt in my price action trading course. If a systematic yet flexible framework appeals to you, take a look at it.)