The 3 Practical Uses of Price Congestion That Traders Miss
By Galen Woods ‐ 5 min read
Find trading opportunities in a congested market, and learn to protect yourself when the market is moving sideways. A practical guide to congestion.
When you see sideways price action in a meandering market, what goes on in your mind? Is it danger, opportunity, or a blank? Let’s see if we can avoid the blank and put every congestion pattern to good use with these three practical uses of price congestion.
Instead of giving useless labels to sideways price action, let’s focus on using them to our advantage. This change in perspective can improve your price action reading skills. The rectangles on your charts might just be the boost you need for achieving your trading goals.
How to Respond to Congestion Areas
When you spot a congestion area, here are the three potential uses to keep in mind:
- Support and Resistance
- Trade Exits
- Warning Zones
In different contexts and points in time, congestion zones can augment various parts of our trading method. Hence, it’s not feasible to prescribe rigid rules here.
So in the sections below, we will elaborate on how to put these ideas to use with charts examples.
#1: Congestion Zones As Support and Resistance
Most traders look for support and resistance based on swing pivots. Some traders use pivot point formula and Fibonacci projections for the same purpose.
These are sound approaches, but let’s not overlook congestion areas. They project solid support and resistance zones that are highly reliable.
The chart below shows the ES 5-minute chart across three trading sessions. Blue areas mark the Congestion Zones, and dotted vertical lines separate the sessions. (Click on image to zoom.)
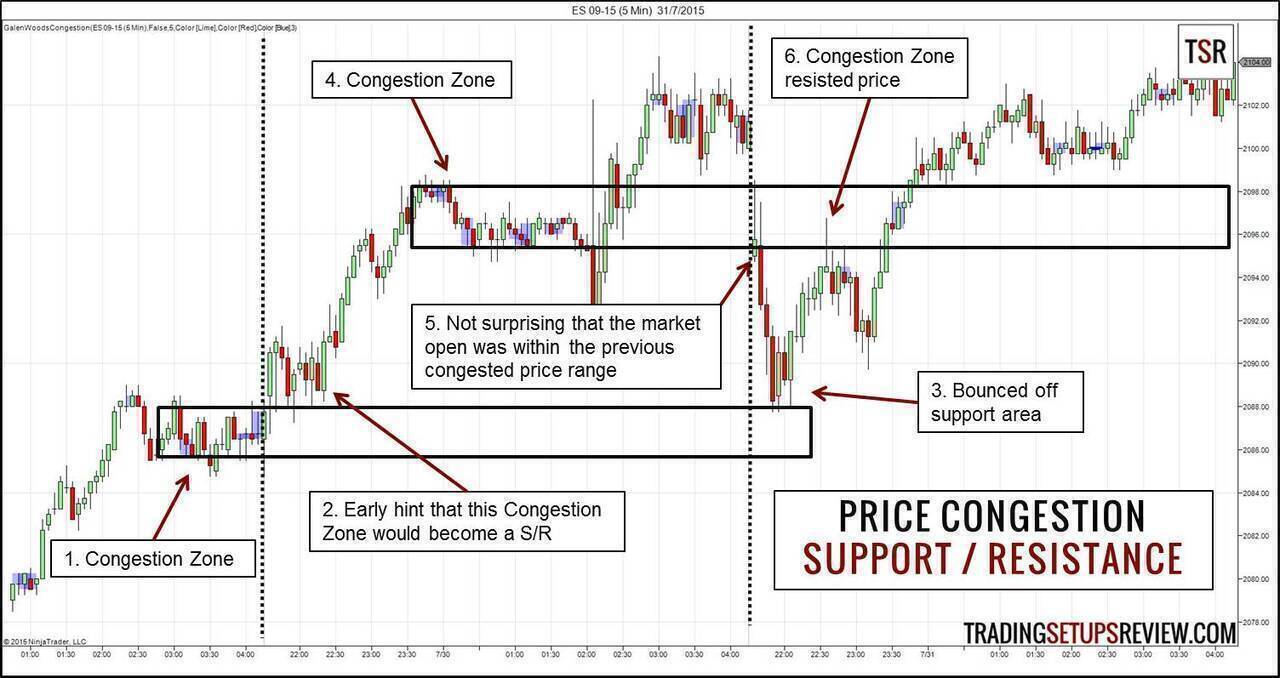
- Towards the end of the first trading session, the market became congested.
- During the first 30 minutes of the next session, the market found buyers around the Congestion Zone. Note the long lower tails of the candlesticks. They hinted at the supportive strength of the congestion from the last session. As it turned out, this zone became the starting point of a bullish session.
- Furthermore, in the final session shown in our chart, the early morning market fall was halted by this support zone once again.
- Let’s rewind a little back to the Congestion Zone found in the middle of the second session. Naturally, we projected a potential support and resistance zone with it as well.
- The final session opened near this zone and affirmed its relevance. However, it failed quickly as a support zone.
- However, the zone made a clear show of its power as resistance.
This method relates to the idea of using high-volume formations as support and resistance.
As a market moves sideways, trading volume is concentrated within a tight price band. This high volume price band then forms an effective support or resistance zone.
#2: Congestion Zones For Trade Exits
While sharp reversals are striking, most trends do not reverse sharply. They tend to drift sideways before pulling back or reversing completely.
Hence, if you’ve managed to join a trend and secured a paper profit, use signs of price congestion to take your profit. You can get out with a nice real profit before the trend reverses or stalls.
Day traders can combine congestion patterns with the time of the day for effective exits. Congestion patterns at midday and towards the end of the session make a strong case for immediate exit.
Look at the intraday trading example below. It shows an entire ES futures trading session.
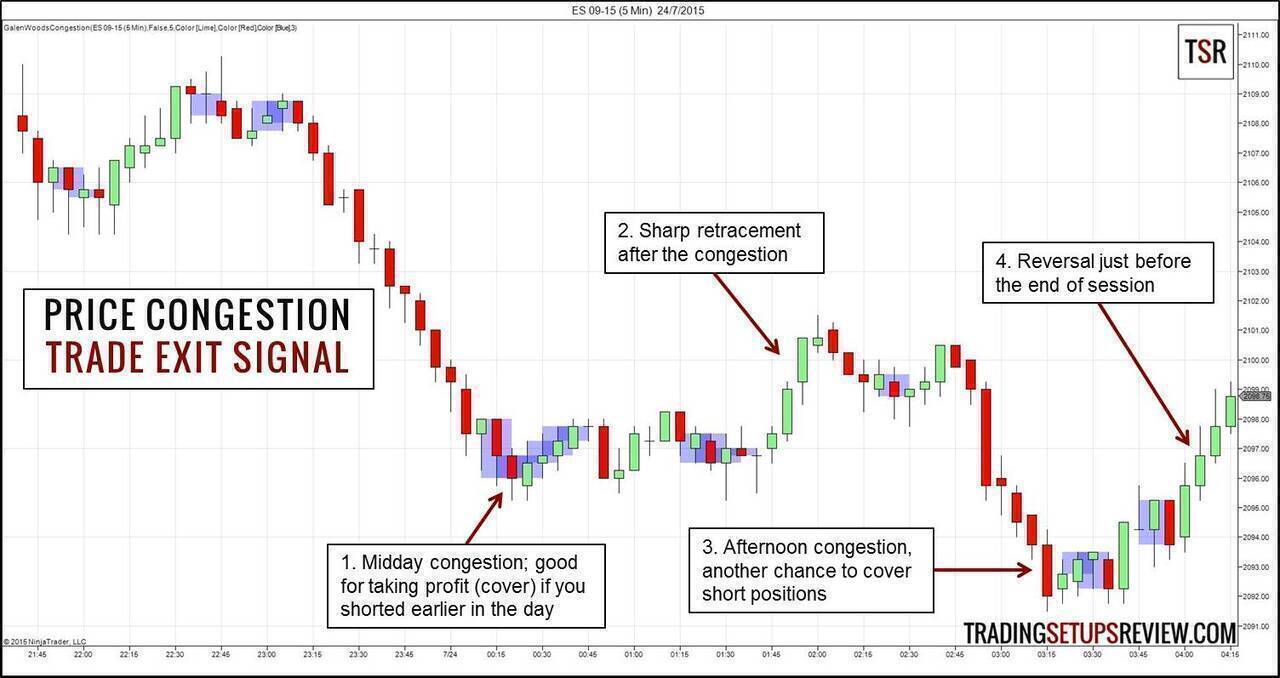
- After a long streak of bearish candlesticks, the sideways action here pushed the market into uncertainty. If you were short, it was a reasonable chance to cover.
- Bears who covered upon the midday congestion would have avoided this adverse move in the form of a sharp pullback.
- The afternoon congestion gave another chance for the bears to take profit. And that turned out to be the ideal profit-taking opportunity.
- If we ignored that pattern and held to the end of the session, we would have given some profits back to the market as it reversed up into the session close.
#3: Congestion Zone as Warning Zone
When the market congests for a prolonged period within a tight price range, consider it as a warning.
It cautions you that the profit potential of your trade is limited. And that warning is valid at least until the market breaks out from the congestion.
It is best not to risk your precious trading capital when profit potential is limited. Trying to anticipate the eventual break-out is reasonable, but expect multiple failed attempts. Staying on the sidelines is a good default policy.
The chart below is also from the ES 5-minute prices. Let’s take a look at it.
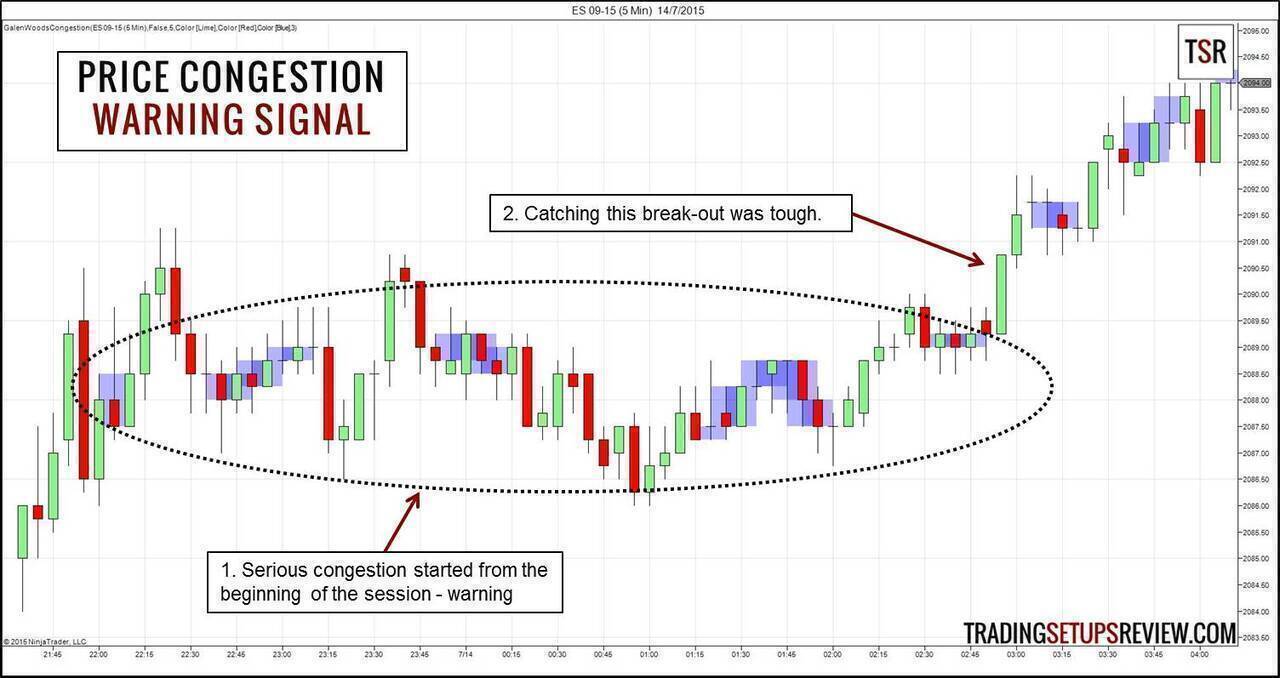
- There was some serious congestion going on from the start of the session. It was not an easy feat to find setups with a good reward-to-risk ratio within this trading range.
- Eventually, the market broke out above the range with this decisive bullish trend bar. This was a good bullish entry, but it was crucial to avoid making premature entries within the congestion zone.
Hence, it is wise to stay out of prolonged sideways action until you observe more concrete price action.
Nonetheless, you might have reasons for anticipating an eventual bullish breakout. (Perhaps due to an analysis of the bigger picture or fundamental reasons.) In that case, you can consider taking a long position earlier within the congestion, around the lower bound of the congestion area.
But, What is Congestion?
You might have this question in your mind.
In the examples above, I used the Congestion Zone taught in my Day Trading with Price Action Course. It’s a simple price action pattern that takes at least three bars to form. The blue areas on the chart are marked out according to the definition taught in the course.
But remember that price congestion is a concept and not a rigid pattern. It refers to sideways price action. Hence, you can use any definition of price congestion. You will still find the same useful characteristics discussed above.
Now, open up your charts and start finding value in sideways price action.