This website or its third-party tools use cookies which are necessary to its functioning and required to improve your experience. By clicking the consent button, you agree to allow the site to use, collect and/or store cookies.
Please click the consent button to view this website.
I accept
Deny cookies Go Back
  • Price Action Trading Course
  • Trading Setups
  • Topics ↓
    • Price Action Trading
    • Day Trading
    • Trader Development
    • Site Map
  • TSR Trading Guides
  • Trading Resources
    • Trading Journal Software
    • Our Partners
    • Support Us
  • Member Login

Trading Setups Review

Trading Strategies, Guides, and Articles for Active Technical Traders

Forex Tester 5 - Software for traders by traders
You are here: Home / Trading Setups / 50% Retracement Swing Trading Strategy

50% Retracement Swing Trading Strategy

By Galen Woods in Trading Setups on December 16, 2014

Swing traders love retracements. When a trend retraces, it offers a potential low-risk/high-reward entry into the market. Trader looking for retracement opportunities has one question on their minds.

How much does the trend need to retrace?

This is a tough question. Shallow retracements often fail, except in the strongest trends. Deep retracements might be a reversal signal in disguise. Both scenarios are tricky.

There are various practical methods to deal with this question of retracement. Some traders look for retracements to moving averages like in the 9/30 trading strategy. Others look for Fibonnaci retracements based on a percentage of a prior swing.

Among the retracement swing trading strategies, the 50% retracement is a particularly reliable method. 50% is not a Fibonacci ratio per-se, but is effective as a benchmark for a moderate pullback.

This is how I look for 50% retracements for swing trading.

Trading Rules – 50% Retracement Swing Trade

Bullish Swing Trade

  1. Look for a bullish price thrust that clears above the previous swing high with strong momentum.
  2. Mark out a “retracement zone” between 50% and 61.8% of the price thrust.
  3. After price falls down to the retracement zone, buy above any bullish bar.

Bearish Swing Trade

  1. Look for a bearish price thrust that clears below the previous swing low with strong momentum.
  2. Mark out a “retracement zone” between 50% and 61.8% of the price thrust.
  3. After price rises up to the retracement zone, sell below any bearish bar.

If you are not sure how to draw retracement zones, take a look at this Fibonacci guide. The examples below show the 50% – 61.8% retracement zones.

50% Retracement Swing Trading Examples

Winning Swing Trade – Bullish 50% Retracement

50 Percent Retracement Trading Strategy - Winning Trade

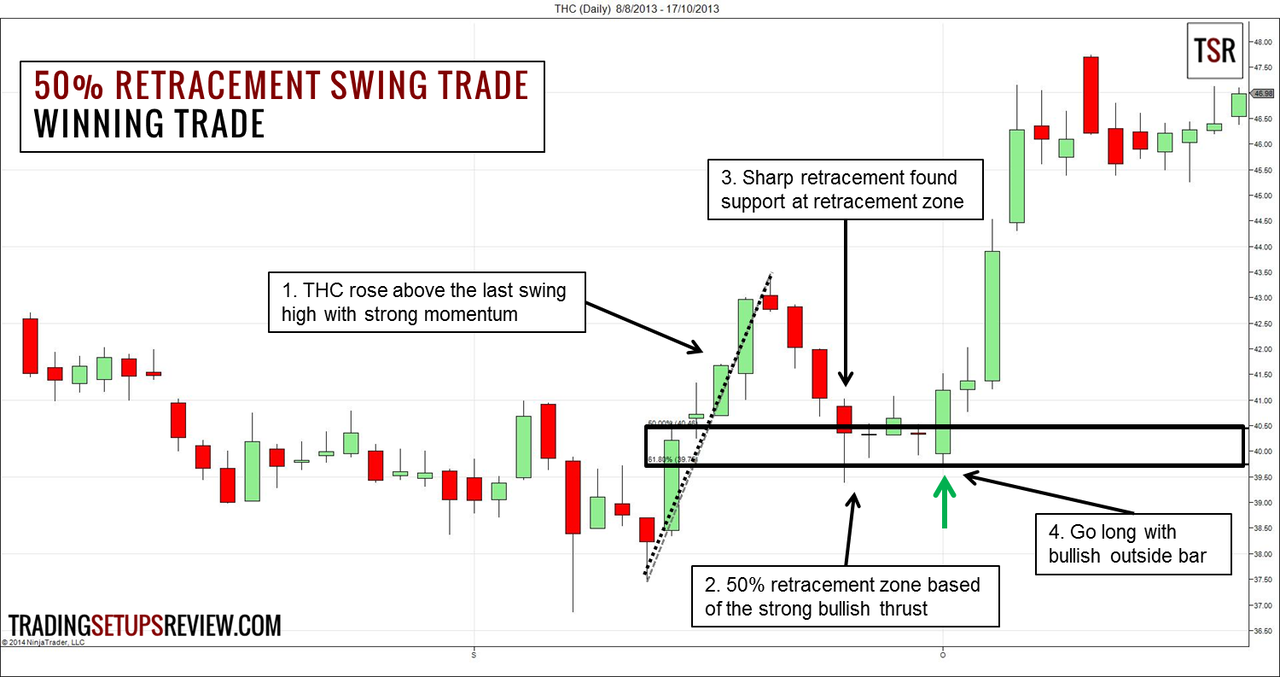
The chart above shows the daily price bars of the Tenet Healthcare Corp (THC on NYSE).

  1. This is the first strong upswing after a protracted downwards drift. These four consecutive bullish bars rose above the last swing high without resistance. It is a solid candidate as the basis of a 50% retracement swing trade.
  2. Hence, we drew the 50% and 61.8% retracement levels of the bullish thrust. The area between them is the retracement zone.
  3. This sharp retracement down found support at the retracement zone. The candlesticks that followed had bottom shadows implying bullish pressure.
  4. This bullish outside bar confirmed the support from the 50% zone and was a great setup bar.

Losing Trade – Bearish 50% Retracement

50 Percent Retracement Trading Strategy - Losing Trade

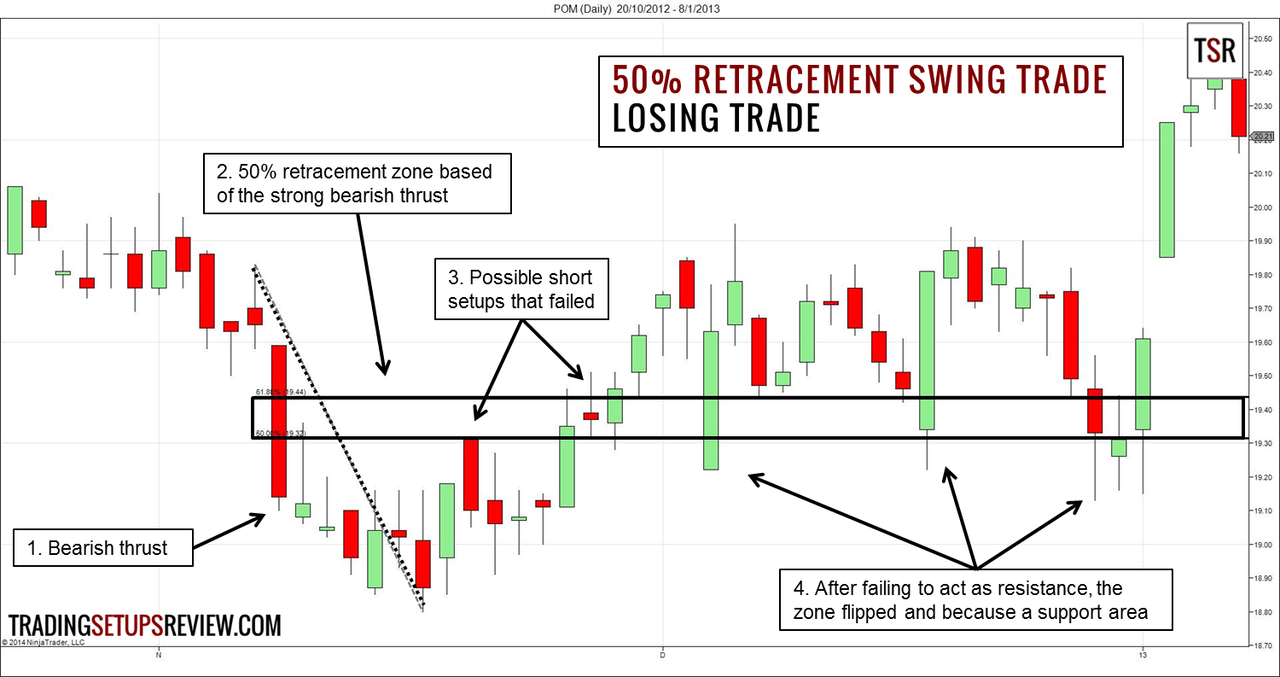
This is the daily chart of Pepco Holding (POM on NYSE).

  1. This bearish thrust brought the market to a new low. (Note that it was not as forceful as the price thrust in the winning example.)
  2. With this bearish thrust, we drew a 50% retracement zone.
  3. These two bearish bars were potential setup bars for shorting POM. However, both failed quickly.
  4. After the retracement zone failed to resist the market, it flipped and became a powerful support zone.

Review – 50% Retracement Swing Trading Strategy

For this strategy to work well, the choice of price thrust is crucial. Weak and short price thrusts will not produce reliable retracement zones.

For bullish setups, choose price thrusts with strong bullish bars that clear the last swing high easily. For bearish setups, look for thrusts with strong bearish bars that fall below the last swing low easily.

After identifying the price thrust, drawing the retracement zone is straightforward.

The next tricky stage is the exact entry timing. In the trading rules above, we used a simplistic entry rule that buys with any bullish bar and sells with any bearish bar.

To refine the entry, use candlestick patterns or bar patterns in the retracement zones to prompt your entry.

An aggressive entry method is to place your limit order to buy or sell once the market tests the retracement zone. For instance, place a buy limit order just below the 50% retracement level. Using this method with an appropriate volatility stop-loss (like the Chandelier Exit) might offer a better reward-to-risk ratio.

This 50% retracement trading strategy is great for patient swing traders. Wait for a powerful price thrust. Then, wait for a nice 50% retracement. If you are afraid of missing the trend and are tempted to enter before price retraces to the 50% level, you cannot execute this strategy.

Be patient and reap your rewards.

Can’t cope with complex trading strategies? Focus on price action for better and simpler trading.

Read more about Fibonacci, Swing Trading

If Trading Setups Review has helped you trade better, please support us on Ko-fi.

Support me on Ko-fi

Thank you for being awesome.

You can also check out other ways to support us here.

Or, please continue exploring what we have to offer…

50% Retracement Swing Trading Strategy

How To Choose Your Day Trading Software?

5 Bollinger Bands Trading Strategies You Should Know

5 Skills All Price Action Traders Must Have In Their Trading Toolbox

Day Trading With ADX Indicator

Comments

  1. John says

    September 27, 2020 at 4:42 AM

    You are brilliant.!! I can’t believe how many nuggets of brilliance you post every day!!

    Reply
    • Galen Woods says

      September 28, 2020 at 10:16 AM

      Hi John, thank you for your kind words. Happy to hear that you find the posts helpful. Please feel free to email me if you have any suggestions or thoughts about them.

      Reply
  2. Harrist says

    May 30, 2021 at 12:44 AM

    The tricky part is waiting the retracement! It could be reversal! But we can cover with decent sl, 50-100 point! And i find by doing reverse some brokerage system we can get good opportunity for buy/sell signals, from 13 trade, only 2-3 fails, or 75-80% accuracy! If we play all pairs, we can get decent profit! 2 winning trades can cover our loss,!

    Btw thanks for sharing Mr.Galen good info

    Reply
    • Galen Woods says

      May 31, 2021 at 10:33 AM

      Thank you too, Harrist, for sharing your experience with us. All the best to you!

      Reply

Leave a Reply Cancel reply

Your email address will not be published. Required fields are marked *

Trading Course Banner

Search Trading Setups Review

Recommended For You

How To Trade Candlestick Patterns With Trend Lines

18 Trading Psychology Books To Help You Trade Better

Top 10 Volume Trading Books

Don’t Make These 13 Common Mistakes With Your Next Trade

5 Ways To Find Support and Resistance With Price Action and Volume

Modified Hikkake Price Pattern For Trading Reversals

4 Practical Day Trading Tips For the Price Action Trader

Top Trading Books

Top 10 Volume Trading Books

7 Forex Trading Books To Get You Started

18 Trading Psychology Books To Help You Trade Better

Top 10 Price Action Trading Books

7 Trading Books For Your Library


If Trading Setups Review has helped you trade better, please consider supporting us on Ko-fi.

Support me on Ko-fi

Or, check out other ways to support us here.

Thank you for being awesome.


Get a Free Course Chapter from Galen Woods' Day Trading With Price Action Course [PDF]

Plus, our latest trading guides and tips in right your inbox.

Trading Setups Review

  • Support Us
  • Contact Us
  • About Us
  • Privacy Policy
  • Affiliate Disclaimer
  • Full Risk Disclosure

Learn More

  • Day Trading With Price Action Course
  • TSR Trading Guides
  • Trading Setups
  • Trading Articles
  • Trading Books
  • Site Map

Futures and forex trading contains substantial risk and is not for every investor. An investor could potentially lose all or more than the initial investment. Risk capital is money that can be lost without jeopardizing ones financial security or life style. Only risk capital should be used for trading and only those with sufficient risk capital should consider trading. Past performance is not necessarily indicative of future results.


The website contents are only for educational purposes. All trades are random examples selected to present the trading setups and are not real trades. All trademarks belong to their respective owners. We are not registered with any regulating body that allows us to give financial and investment advice.


Trading Setups Review © 2012–2022

Anti-Climax Pattern - Free Course Chapter

Learn a new powerful price pattern today!

Download for free now.