3 Price Patterns For Timing Your Trade Entry
By Galen Woods ‐ 6 min read
Price patterns form an integral part of a price action trading plan. They serve as effective trade triggers and help you to limit your trade risk.
Every trader approaches the market differently. But no matter how you analyze the market, you need a trade trigger - a signal that tells you when to enter the market. It’s an essential part of your trading plan. While you have many options, price patterns stand out as great candidates.
Why?
A trade trigger must have a precise definition. A trade trigger should help you become a decisive trader. You need to know exactly when the trade is triggered and enter the market without hesitation. There’s no room for vagueness here.
A trade trigger should help you manage your trade risk. A well-timed entry can limit adverse movement and inform you when to exit if the market is not going your way.
A price pattern fulfills both requirements.
You can define price patterns clearly with identification rules.
This does not mean that you must define a Pin Bar like other traders. But you do need to stick to a consistent definition of a Pin Bar.
On top of that, a price pattern is the footprint of a short-term change in supply and demand.
Hence, it acts as a minor support and resistance feature. Accordingly, it offers a natural stop-loss level (also known as a pattern stop). This trait helps you to limit your trade risk.
Here, you will learn how to time your trade entry with three price patterns.
- Hikkake
- Three-Bar Reversal (with a tweak for intraday trading)
- Pin Bar
The most efficient way to learn is by going through examples. For each price pattern, we start with its identification rules and end with a chart example.
In the examples below, we perform trend line analysis and use price patterns as triggers. In particular, we are employing the first strategy covered in this trend line trading article.
(Note to course students: All trend lines drawn are according to valid pivots.)
Price Pattern #1: Hikkake
A Hikkake is an inside bar failure pattern. This price formation ensnares the traders who gunned for a breakout trade with an inside bar.
Identification and Trigger Rules
- Find an inside bar. This is Bar 1.
- Bar 2 must have a lower high and lower low.
- Place a buy stop order at the high of the inside bar (i.e., Bar 1).
- Cancel the order if it’s not triggered after three bars (i.e., by Bar 5).
These rules are for the bullish Hikkake. Reverse for bearish entries.
Trade Example - Daily SPY ETF
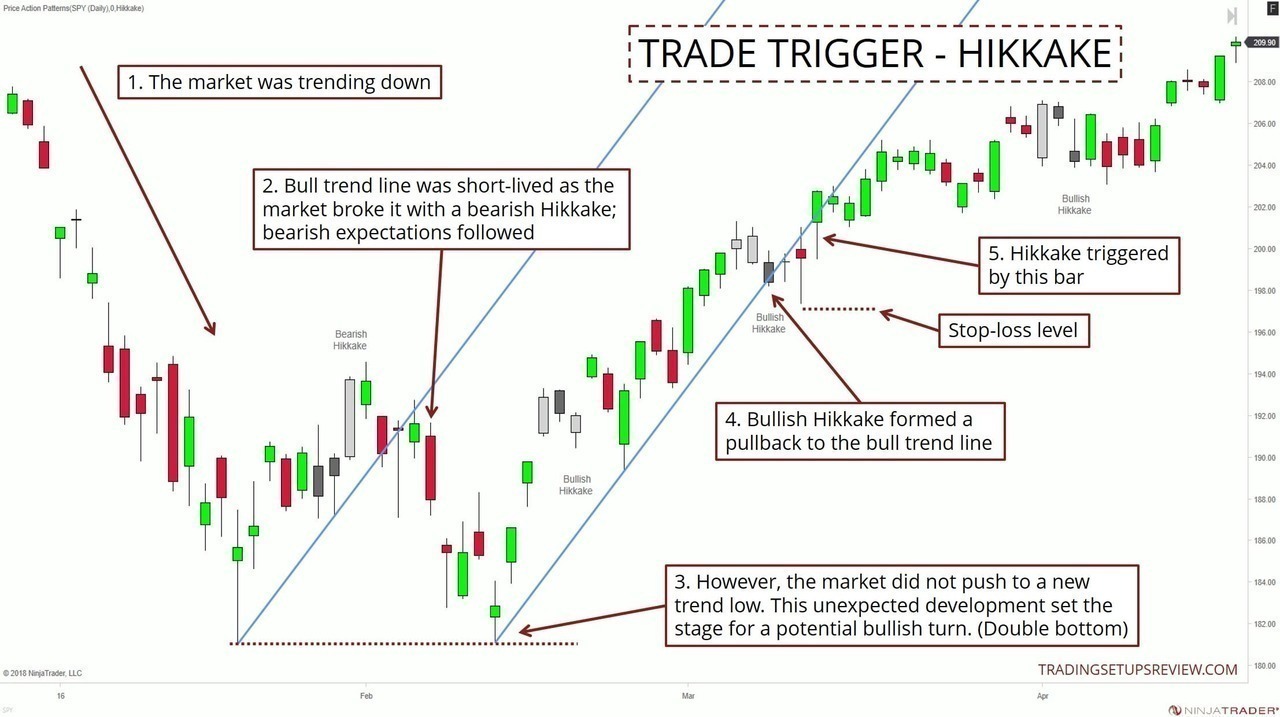
- This chart started with SPY in a bearish trend.
- A bearish Hikkake broke the short-lived bullish trend line. We expected the downtrend to continue.
- However, the market formed a double bottom instead and bolstered a bullish outlook. (A bull trend line formed shortly after.)
- A bullish Hikkake pattern formed as a shallow pullback to the trend line.
- This bar triggered our entry as the market found support at the bull trend line. The pattern stop-loss was the lowest price reached between the Hikkake pattern and the entry bar.
Click here for more Hikkake examples and in-depth discussion.
Price Pattern #2: Three-Bar Reversal (Day Trading Tweak)
A Three-Bar Reversal pattern occurs too frequently in intraday trading. Hence, Alton Hill from TradingSim proposed an additional criterion for intraday Three-Bar Reversals.
Identification and Trigger Rules
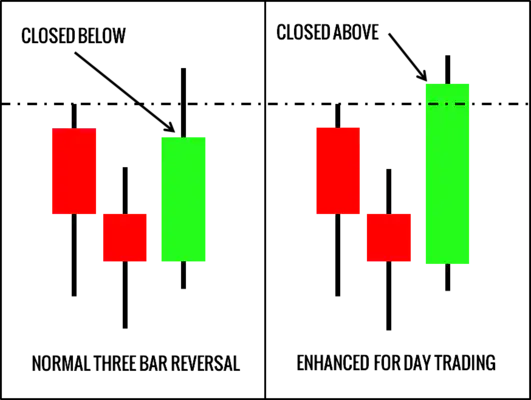
- Bar 1 closes down / is bearish.
- The low of Bar 2 is below the low of Bar 1.
- The low of Bar 3 is higher than the low of Bar 1.
- Bar 3 closes above the high of both Bar 1 and Bar 2.
- Buy with a market order as Bar 3 closes.
These rules are for bullish Three-Bar Reversals. Reverse for bearish entries.
Trade Example - 4-Hour EUR/USD Futures (6E)
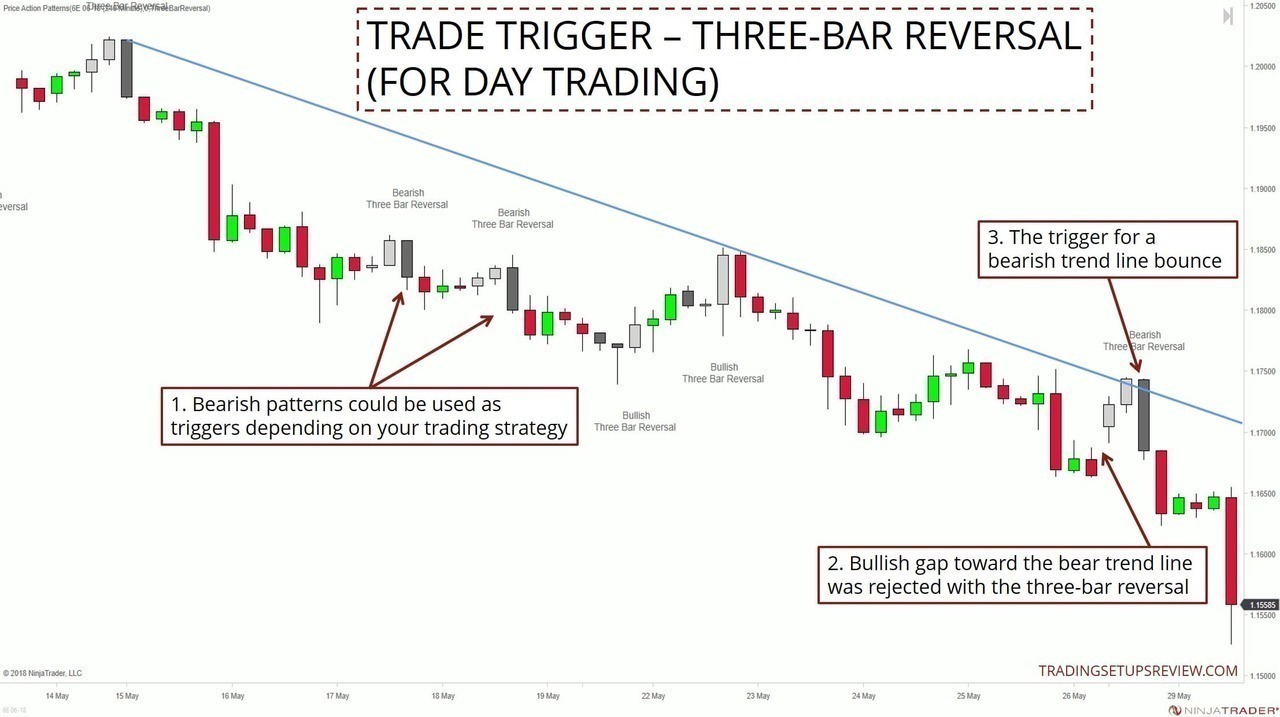
- Depending on your trading approach, these two bearish patterns were potential triggers. We are not focusing on them here as we are looking for trend line bounces.
- This bullish gap towards the bearish trend line threatened the bearish market.
- However, the market rejected it in the form of a bearish Three-Bar Reversal. Our trade trigger was the close of this bearish pattern. The stop-loss point is right above this price pattern.
(The quick failure of the two earlier bullish Three-Bar Reversals hinted at a continuation of the bear trend.)
Click here for more Three-Bar Reversal intraday trading examples.
Price Pattern #3: Pin Bar
A Pin Bar is one of the most popular price patterns and is a useful trigger for many trading methods.
Identification and Trigger Rules
A bullish Pin Bar must:
- Open above a support
- Trade below the support for most of the bar range
- Close above the support
Reverse the rules for bearish Pin Bars, and look for a test of resistance instead of support.
Trade Example - SPY ETF Weekly
You often hear that you can use price patterns on any time frame. While this is not true for the more complicated patterns, it is the case for simple patterns like the Pin Bar.
This example takes on the weekly chart.
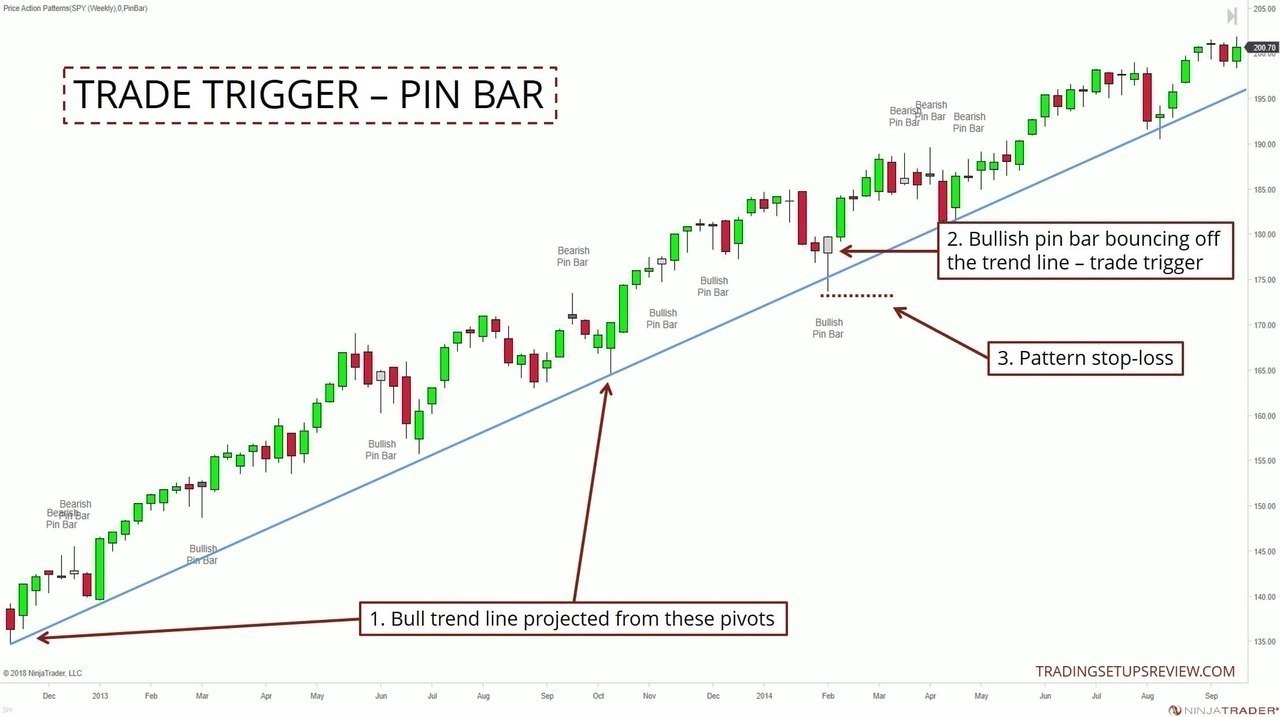
- You don’t need a trend line to show you the bull market in this chart. However, in this example, trend line analysis is a cornerstone for trading consistency. The trend line helps us to determine which Pin Bar to pay attention to. (These are the two pivots of the trend line.)
- Many Pin Bars formed as the market rose. But this Pin Bar triggered our trade as it bounced off the bull trend line.
- The pattern stop-loss is just below the low of the Pin Bar.
Click here for more Pin Bar trading examples.
Conclusion
Price patterns are not the only way to trigger your trades. But they are practical tools for price action traders operating on all time frames.
They help you enter decisively and offer you with a logical exit point if things go south.
The examples showed how these patterns work within a trend line bounce strategy. Your trading strategy will work better with specific price patterns. Tweak your entry price pattern to find one that’s compatible with your trading plan.
These are examples picked to show you how to use these patterns as trade triggers. They are textbook examples and are in no way proof of the profitability of these patterns.
Note on the Price Action Pattern Indicator
In the examples above, I used the Price Action Pattern Indicator. It marks out five price patterns including the three above.
An indicator is not necessary. But it is helpful for making snap entry decisions when a qualified price pattern appears.
The Price Action Pattern Indicator has been updated recently for NinjaTrader 8 (NT8) which is the charting platform used for the charts above.