3-Step Pullback Trading Method
By Galen Woods ‐ 5 min read
This 3-Step Pullback Trading Method offers a comprehensive framework for trading trend pullbacks. It uses the Keltner Channel to pinpoint effective setups.
This 3-step method for trading pullbacks comes from Richard Deutsch’s excellent Udemy course. It uses the Keltner Channel to identify trend momentum and tradeable pullbacks. From there, it relies on price action to select the best pullbacks for entering the market.

Note: I’ve interpreted the source material with my observations to form the trading rules below. Hence, there may be slight differences.
![]() The Three Steps
The Three Steps
What are the three steps?
- Use the Keltner channel to identify trends and to find healthy pullbacks. (Not sure what’s a Keltner Channel? Click here.)
- Focus on price action to select entries.
- Place your stop-loss and target orders with the help of price action and your market’s ATR.
Let’s learn more about the three steps below.
Step 1 – Identify Pullback Candidates
The critical component of this system is the Keltner Channel. It is a versatile trading tool that incorporates both trend strength and momentum.
A properly calibrated Keltner Channel covers most price activity. So, when price moves outside the channel, either above it or below it, it signals a trending market.
Recommended Keltner Channel settings:
- 15-period EMA
- 15-period ATR
- 2-times ATR multiple
After the price breaches the channel, you wait for a pullback.
For a pullback to be valid, it must occur within a Target Range. It is defined by the degree of pullback and its duration. Specifically, look out for pullbacks that:
- Reaches 20% to 80% of the Keltner Channel;
- Within 3 to 15 bars.
Step 2 - Trade Entry
Once the market is within the Target Range, wait for one of two entry triggers:
- Price bar(s) showing short-term, with-trend momentum.
- Price bar(s) forming a Pin Bar with a long tail and a strong close back in the direction of the primary trend.
Step 3 – Stop-Loss and Profit Target
A stop-loss is set at least 2.5 ATRs away.
This relatively wide stop-loss recognizes that pullbacks often take some time to develop. The intention here is to accommodate complex or multi-legged pullbacks.
A profit-target is set at equal distance, providing an initial 1-to-1 risk-to-reward ratio. You can tighten the stop-loss if the trade goes your way.
3-Step Pullback Trading Rules
To summarize the trading rules:
Long Pullback Setup
- Price exceeds Keltner Channel ceiling.
- Price pulls back into the Target Range.*
- Wait for a price action entry signal to go long.
Short Pullback Setup
- Price goes below the Keltner Channel floor.
- Price pulls back into the Target Range.*
- Wait for a price action entry signal to go short.
*20% to 80% of the Keltner Channel within 3 to 15 price bars.
Trading Examples
In the charts below, the blue lines form the main Keltner Channel we are relying on to assess the trend.
On top of that, I’ve added a second Keltner Channel to highlight the Target Range (orange dotted lines). This is optional but it can be a helpful visual guide if you’re new to this approach.
Winning Trade
This example shows two successful day trading setups using the 3-Step Pullback Method.
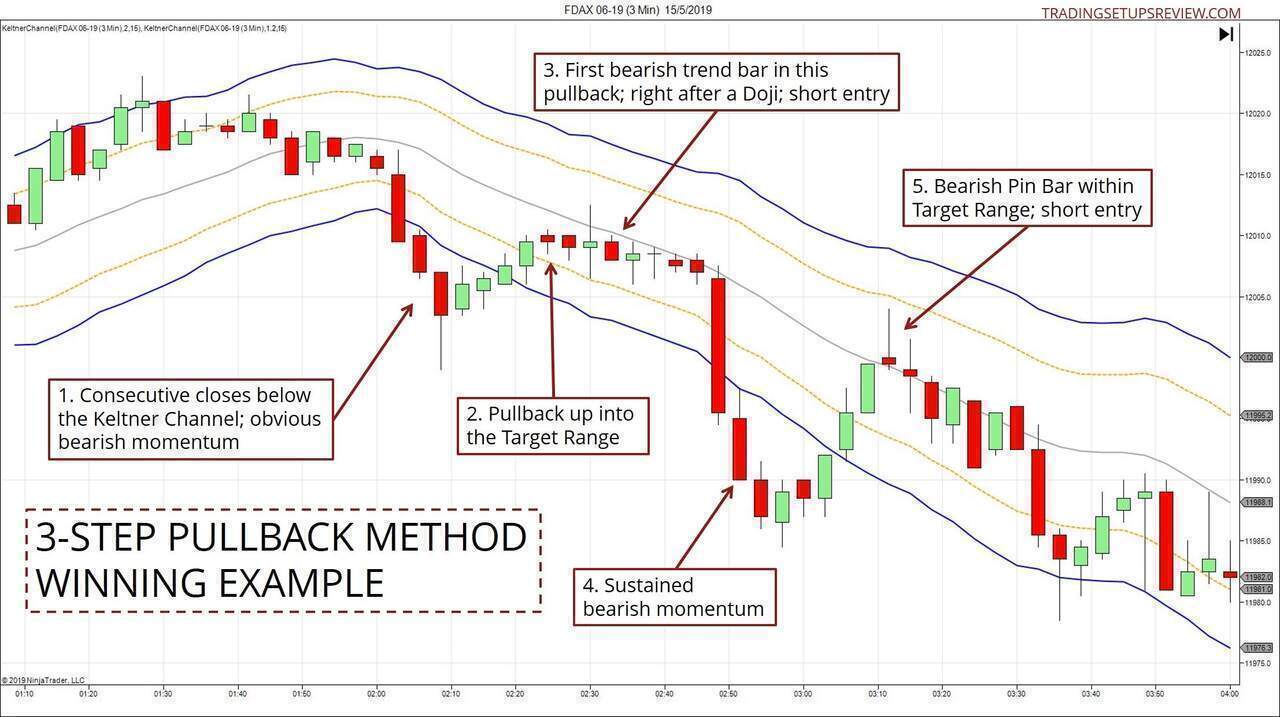
- These consecutive closes below the Keltner Channel floor confirmed the bearish momentum.
- After five bullish bars, the pullback hit the Target Range (within the orange channel). From that point, the market drifted sideways.
- The previous candlestick signaled uncertainty in the form of a Doji. But this bearish trend bar showed the with-trend momentum we needed for a short entry.
- The market punched below the Keltner Channel again. This development set the stage for another short pullback setup.
- This bearish Pin Bar at the EMA line (50% of the Keltner Channel) offered a marvelous short entry.
Both setups here hit the default profit target of 2.5 ATR.
Losing Trade
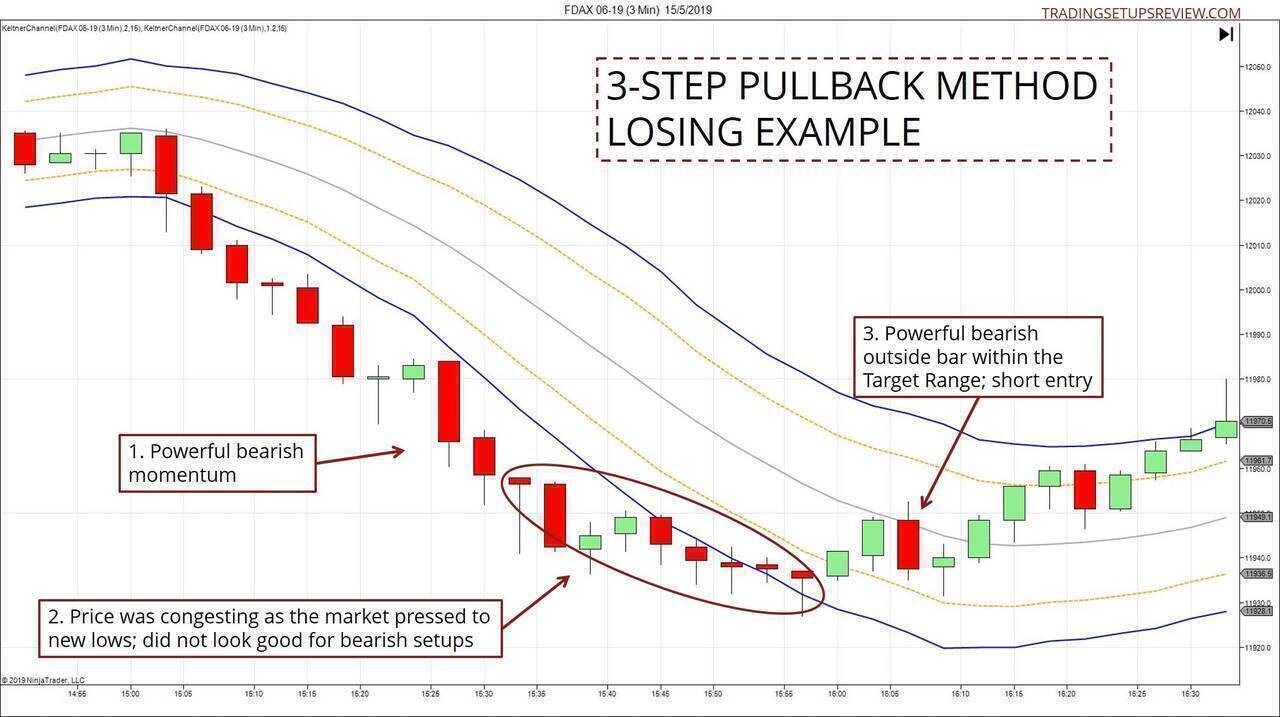
- A long series of candlesticks forming below the Keltner Channel. This formation is a compelling show of bearish force. It created the context we needed for a short pullback entry.
- As the market pushed to new lows in this downwards trend, price action started congesting. Also, note the overlapping lower shadows of the price bars. These were not signs of a healthy bear trend.
- Nonetheless, the technical bearish trend conditions were in place. Hence, this bearish outside bar offered a potential short entry for the 3-Step Pullback Method.
However, it failed almost immediately.
In this example, we saw clear warning signs, as highlighted in Point 2 above.
But this will not always be the case. You’ll encounter perfect-looking pullback setups that turn out disastrous.
Accept these losses as the cost of doing business. Be careful not to go down the rabbit hole of trying to avoid all losing trades.
Review - 3-Step Pullback Trading Method
This strategy prescribes a method for trading pullbacks within a trending market. But there’s ample room for experimentation.
With this three-part trading template, there’s much you tinker with and learn from.
For instance, you can easily swap the Pin Bar entry with your favorite price pattern. Stick to one that you’re confident of finding and interpreting.
The trading rule that considers the number of bars into a pullback is helpful. It offers a straightforward method to assess the complexity of a pullback. Another way is to count the number of legs within the pullback.
In his original course, Richard discusses many more nuances of this strategy. These include his rationale and method for placing stop-losses and taking profits. These are aspects we did not focus on in the examples above.