7 Trading Channels For Analyzing Price Action
By Galen Woods ‐ 8 min read
A trading channel is an incredibly versatile tool for price action traders. Learn seven different channels to improve your market analysis.
Price channels present a powerful tool for visual analysis. They are different from other indicators/tools as you would plot them over price action. This ensures that you integrate price action with the channel for a holistic analysis.
Beyond its emphasis on price action, channels are also incredibly versatile. You can use them to:
- Determine trends
- Judge momentum
- Gauge targets and stop-losses
This article gives an overview of seven channels that will help any price action trader. With the linked resources, we aim to provide a launchpad for you to move on to explore these tools yourself.
There are two approaches to producing price channels:
- Applying statistical formulae to price action data
- Connecting important price action features
Calculated channels typically use a smoothing formula to produce the midline. Then, it builds the channel with some measure of volatility to encompass price action. (e.g., Bollinger Band)
Hand-drawn channels use price action features like swing pivots to draw trend lines. The same price features also guide us in expanding the trend line into an envelope. (e.g., Trend Line Channel)
Some channels use a hybrid approach. For example, the linear regression channel uses statistical calculations, while its anchor is a significant swing pivot.
These are the channels we will cover in this review:
- Moving Average Channel (Highs and Lows)
- Keltner Channel
- Bollinger Band
- Linear Regression Channel
- Donchian Channel
- Trend Line Channel
- Andrew’s Pitchfork
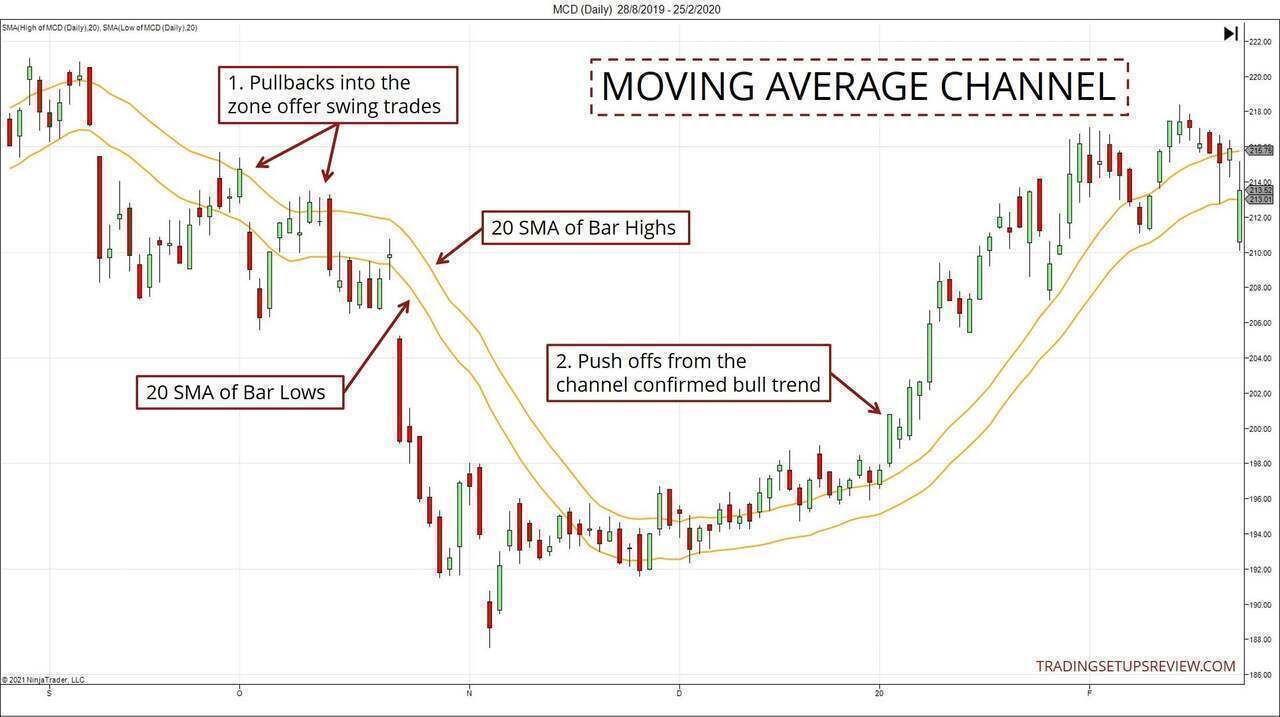
#1: Moving Average Channel
This channel is easy to understand and does not involve any complex computation. It’s just two moving averages!
The idea is simple. Each bar’s high and low represents the support and resistance of each period on a price chart. These values are essential.
For instance, on the daily chart, the high of a candlestick is the ultimate resistance within the day.
Hence, we build two moving averages, using the high and low prices, respectively. These two moving averages, when plotted together, form the moving average channel.
The chart below shows how to build the channel. It also demonstrates how it helps a swing trader detect market opportunities.
I first came across this tool in one of Jake Bernstein’s earlier books. You can learn more in this review.
#2: Keltner Channel
The Keltner Channel is a moving average surrounded by envelopes extended by Average True Range (ATR) multiples. Learn more about the ATR here.
The chart below plots the Keltner Channel with its default setting in NinjaTrader. (Lookback period of 10 and 1.5 ATR for the envelopes.)
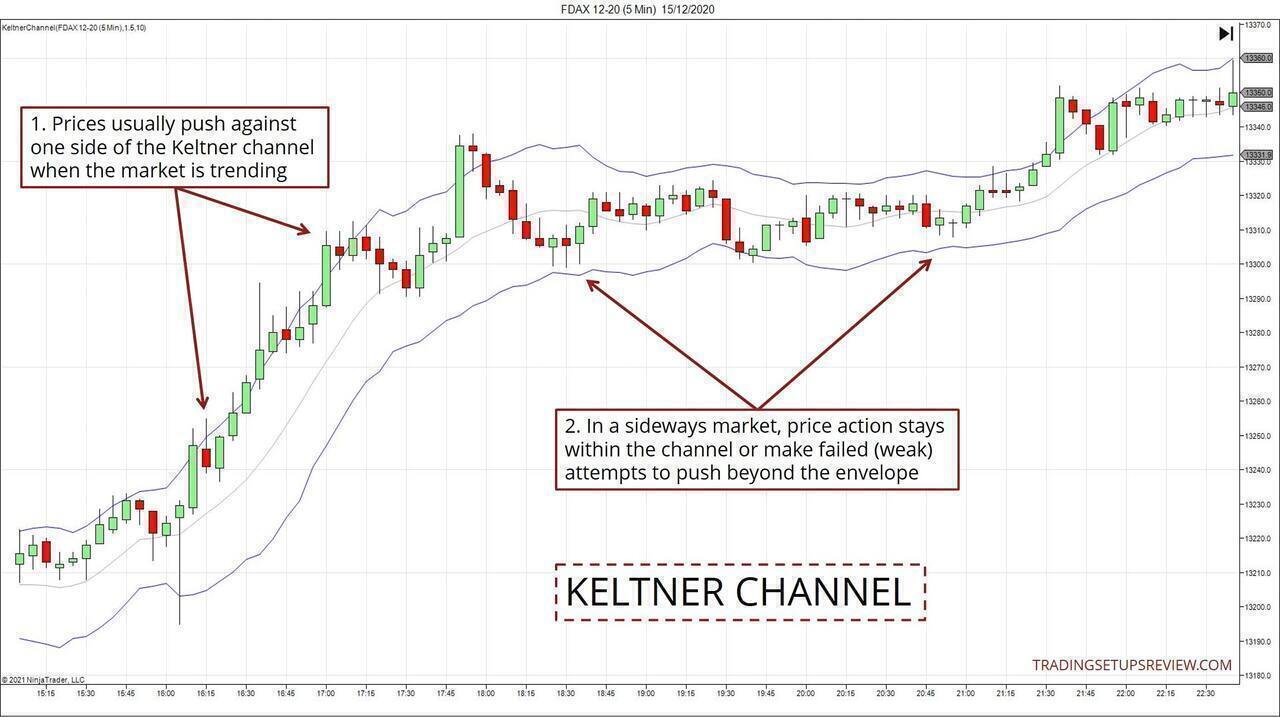
As you can see above, the Keltner Channel offers a friendly visual tool for analyzing the market phase. You can quickly determine if the market is in a trend or trapped in a range with its help.
Some traders use multiple ATR envelopes to grade the momentum of price thrusts. While I find numerous ATR envelopes messy and seldom apply them, you can try them out to see if you find them helpful. (You can see an example in ChartSchool’s entry on Keltner Channel.)
The Keltner Channel is a popular indicator among traders. You can find two applications in these trading setups:
Finally, to learn how to read price action with the Keltner Channel, refer to this detailed guide.
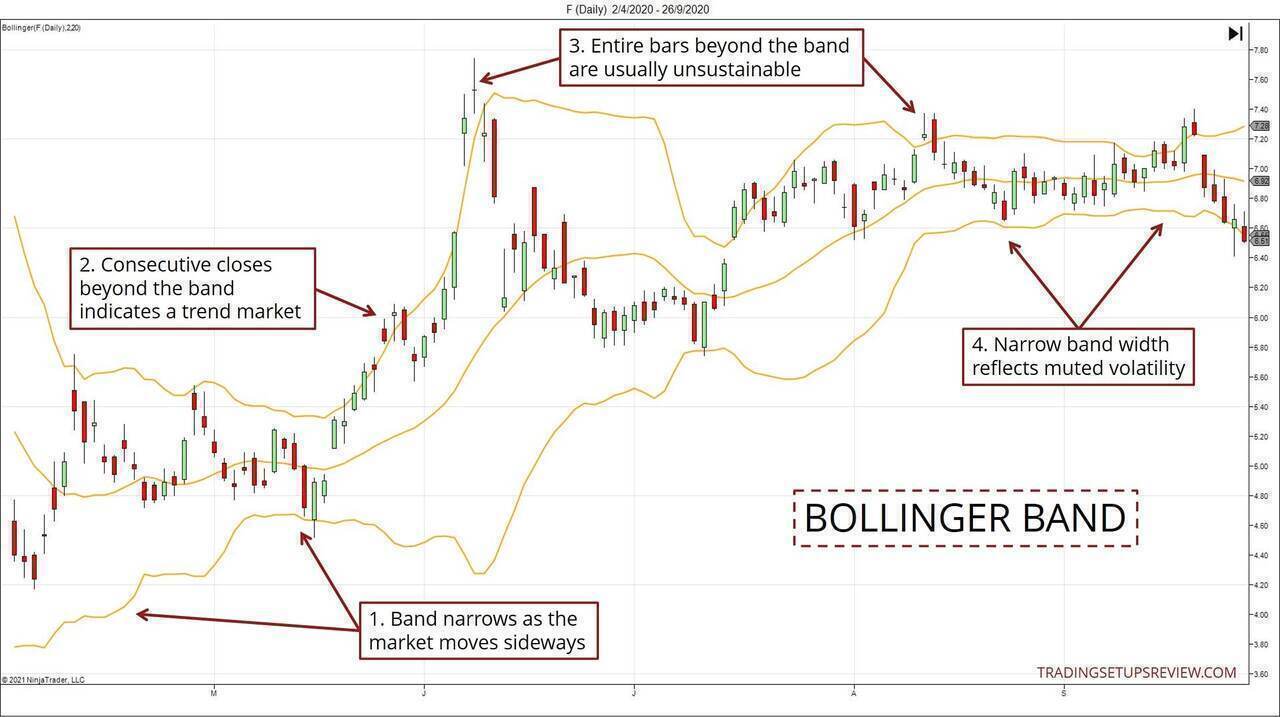
#3: Bollinger Bands
John Bollinger’s invention is a standard tool on most technical analysis platforms. It’s not surprising if the Bollinger Band is the only one you’re familiar with on this list.
Bollinger Bands follow a construction like the Keltner Channel. The main difference is that instead of ATR, Bollinger uses standard deviation.
This distinction is significant as it leads to a more unstable band. If you compare Keltner Channel to Bollinger Band, you’ll notice one salient difference.
Bollinger Bands expand and contract more frequently and much more erratically.
New traders might feel uncomfortable with the band fluctuations. But skilled traders will realize that the changes in the width of the band convey critical information. Hence, they can put these changes to their advantage.
The chart below shows how handy the Bollinger Band is for reading price action.
To learn more about how to read price action with the Bollinger Band, check out this tutorial.
#4: Linear Regression Channel
A linear regression line is a best-fit line that cuts through all the data points given. It uses a core statistical concept known as the method of least squares.
In the case of a price chart, the data points are typically the closing price of each bar. However, you can use the median or typical price as well.
Once the best-fit line is in place, we can draw the channel by projecting a pair of parallel lines. The displacement of these parallel lines depends on the standard deviation.
You can learn more about the construction of the linear regression channel here.
Linear regression involves computation. However, the manual selection of the range of data points is critical to its efficacy.
The typical approach is to anchor the linear regression line to what you think is the point where a trend has begun. Then, adjust it to include more price action as the market proceeds.
The channel becomes more useful once it includes at least two pairs of significant swing pivots - like the circled pivots in the chart below.
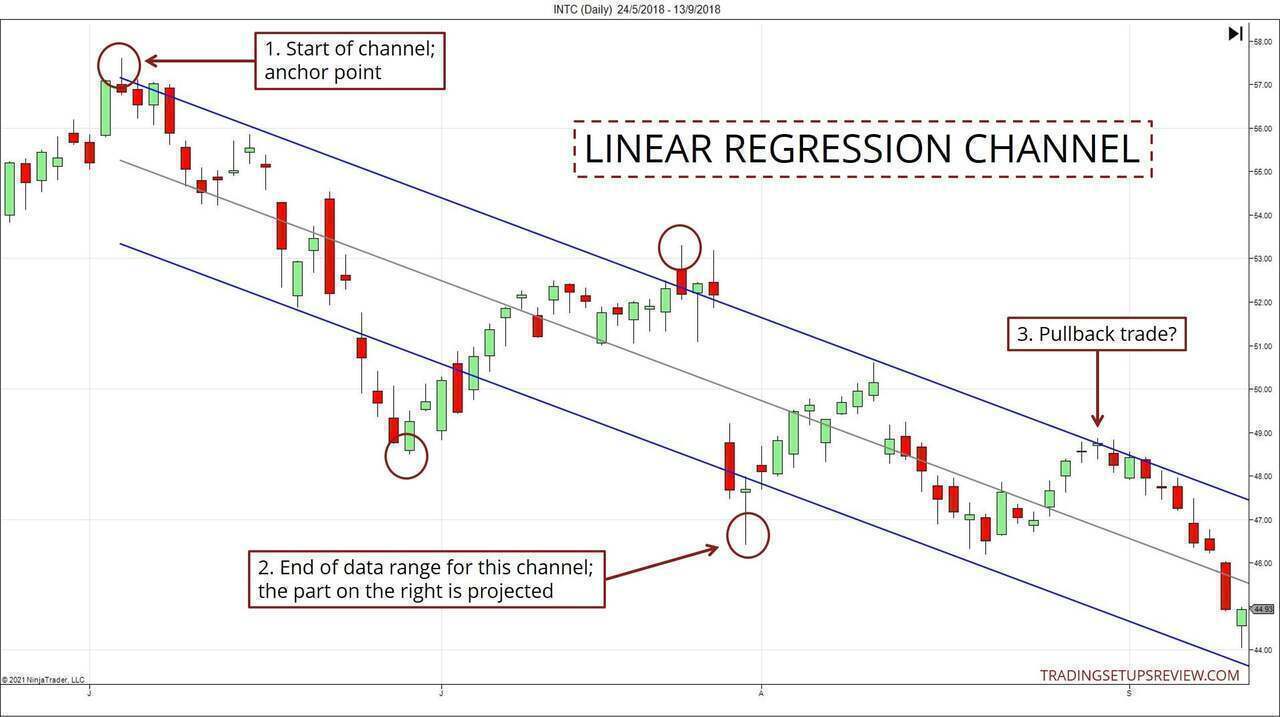
Here, the channel lines are two standard deviations away from the regression line. This multiple is one of the parameters of a linear regression channel.
Don’t forget that the entire linear regression channel is adjusted as new data comes in. In technical indicator jargon, this is a repainting indicator.
Hence, be careful when you use this tool for manual backtesting.
Regression channels often look great ex-post as it is, by definition, the best-fit line. So don’t neglect to take note of the range of data the channel accounts for. (Don’t end up taking the future into account.)
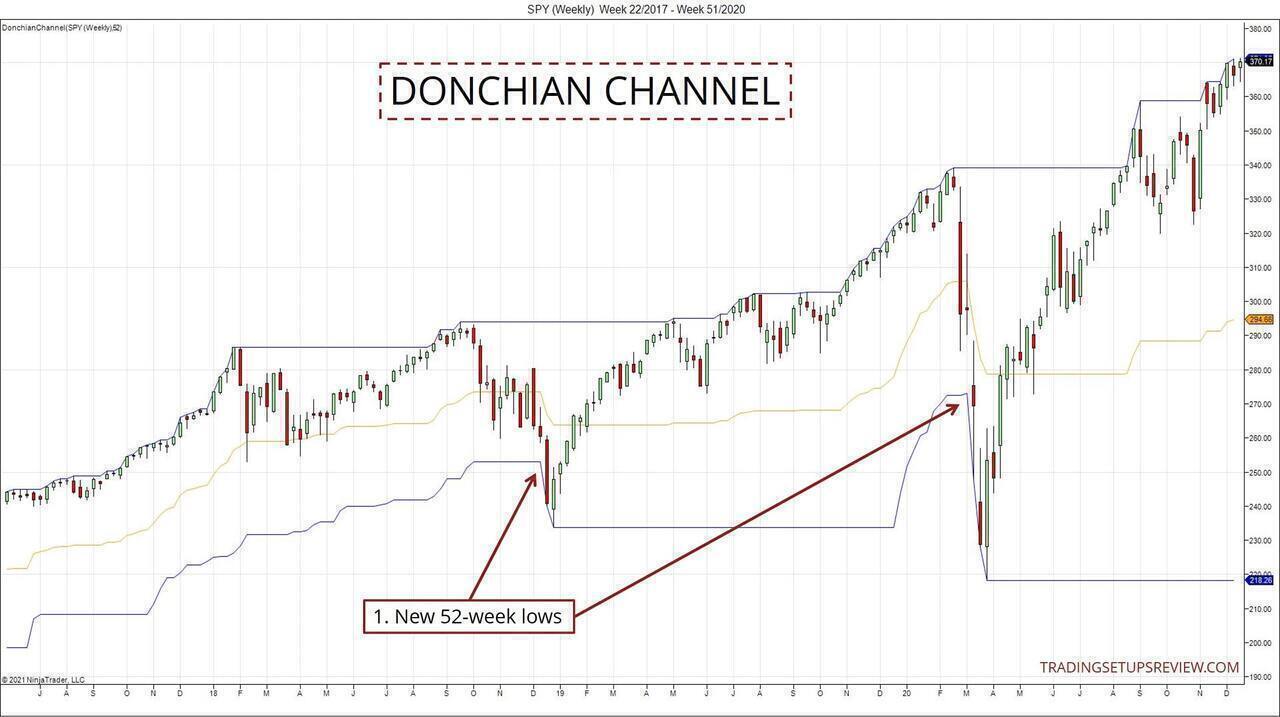
#5: Donchian Channel
This indicator takes its name from Richard Donchian, who pioneered managed futures. He also popularized trend-following systems, which is what the Donchian Channel is well-suited for.
You might have come across the Donchian Channel in the Turtle Trading System.
I like that the Donchian Channel focuses on price action without any computation. This simple indicator takes a single parameter - lookback period.
Let’s take the lookback period N.
With this setting, the channel plots two lines with the highest and lowest price of the past N periods, respectively. It also creates a midline by taking the average of the two lines.
A 52-period Donchian Channel on a weekly chart helps you to find new 52-week highs and lows quickly. The application below would have been useful to an investor looking for bargain entries.
The indicator’s straightforward construction makes it easy to understand. Hence, it is a valuable tool when finding trading opportunities, especially for trend-following.
You can also use a shorter lookback period if you want to use it for more active trading. See how the Donchian Channel can be applied for intraday trading here.
#6: Trend Line Channel
Trend line channel is a mainstay in my trading toolbox. You only need to know how to recognize swing pivots, and you will be able to draw them for your analysis.
To obtain a bull trend line channel, follow these two steps:
- Draw an upward sloping trend line by connecting two swing lows.
- Project a line (parallel to the trend line) that’s anchored to the highest point between the two swing lows.
To get a bear trend line channel, follow these steps:
- Draw a downward sloping trend line with two swing highs.
- Project a line (parallel to the trend line) that’s anchored to the lowest point between the two swing highs.
The chart below shows an example.
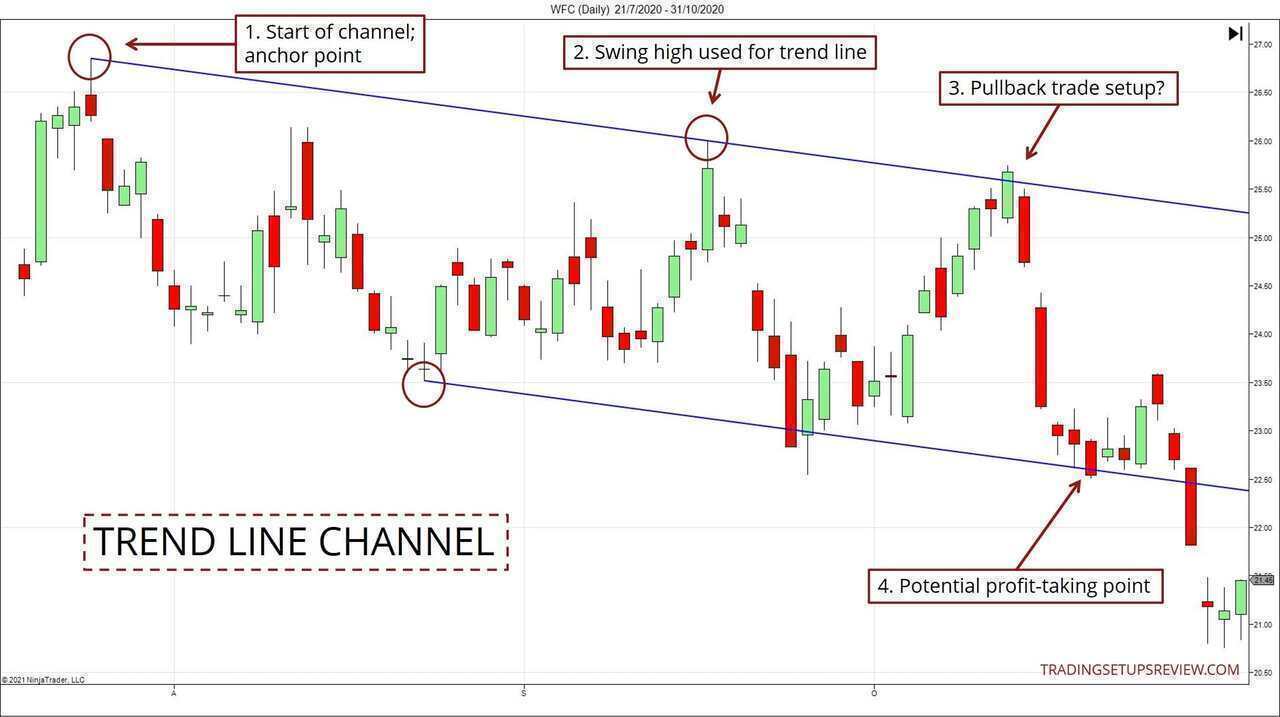
As you see above, an effective channel pinpoints pullback trades and target levels.
Trend line channels are also powerful tools for gauging intraday market bias. For intraday examples, take a look at this guide.
There are myriad ways of drawing trend lines. No right or wrong, but you have to be consistent. In my trading course, I describe a detailed framework that I use to draw trend lines.
#7: Andrew’s Pitchfork
Andrew’s Pitchfork is a unique approach to drawing trend channels. Even if you are familiar with traditional trend lines, you might need some time to get used to it.
Initially, drawing an Andrew’s Pitchfork might seem easy. Just pick three major swing pivots, and the Pitchfork is complete. However, drawing Pitchforks that are suitable for trading takes more experience and practice.
In the chart below, the three circled points on the left are the chosen pivots for Andrew’s Pitchfork. It also explains how to select these pivots.
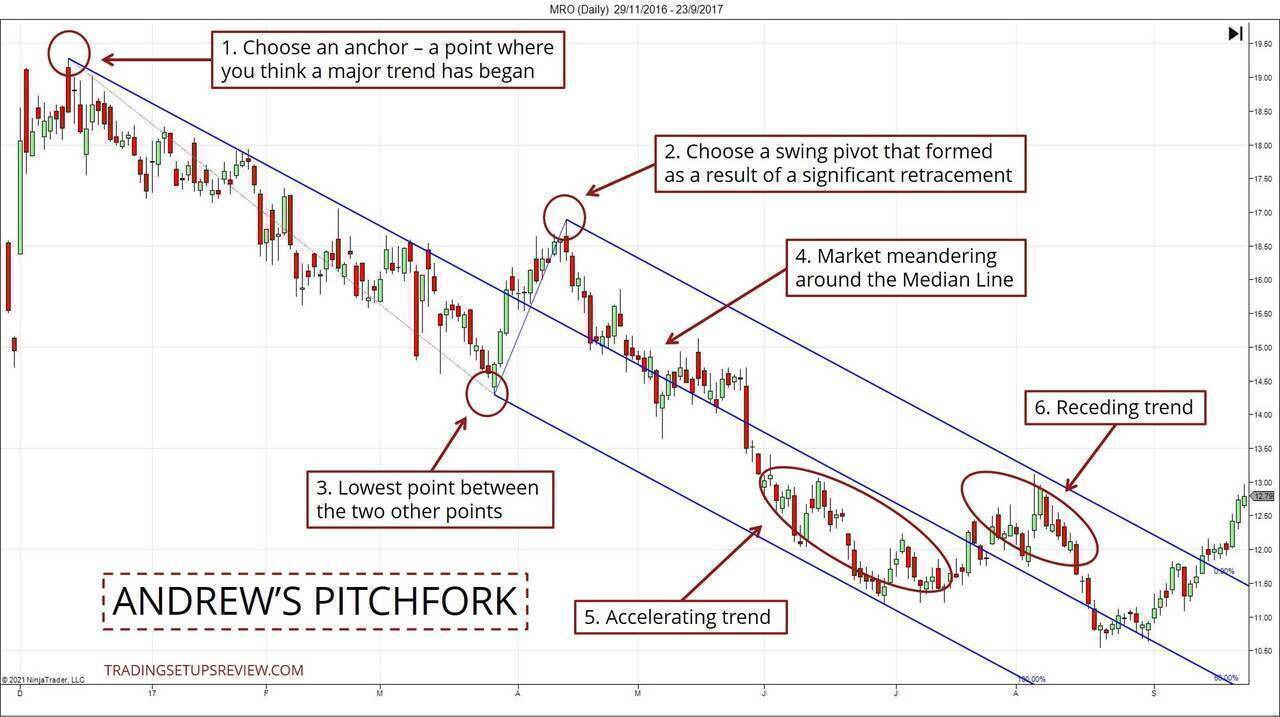
The general interpretation of Andrew’s Pitchfork is similar to the typical trend line channels. On top of that, with the Pitchfork, you can immediately identify the accelerating and receding parts.
As you gain more experience with it, you should also explore the concept of sliding parallels. Learn more about it in this guide.
Conclusion - Channels and Price Action
Price channels are versatile tools for price action traders.
There is a nice mix of channel tools available. Some rely heavily on statistical measures; others rely on manual placement. Hence, you will have no problem finding the one you feel comfortable with to improve your trading.
In this overview, we introduced seven tools that can amplify your analytical skills. It’s exciting and educational to plot different channels on the same chart. You can observe how they differ and discern the value they add to your analysis.
However, because each channel has its nuances, you should eventually focus on one. Mastering the nuances of a channel is the key to making the most out of channel analysis. And it’s much easier to do that if you narrow your focus.
If you’re interested in making the most out of price channels, check out these two articles as well: