How To Analyze Price Momentum With Micro Channel Trend Lines
By Galen Woods ‐ 7 min read
Learn how to analyze price momentum with a simple tool - micro channel trend lines. Forget momentum indicators. Track the market with price action alone.
When you see the market picking up velocity towards one direction, that’s price momentum. Spotting such momentum is a great skill regardless of your trading style. Equipped with this ability, you can react nimbly with a higher chance of staying on the right side of the market.
There are many ways to judge momentum. For example, you can use a momentum indicator. Or you can observe the price action. After all, momentum is apparent on the chart.
But with the many methods available, it’s easy to get confused.
Hence, in practice, you will find it helpful to stick to one systematic way to judge momentum. Here, you will learn how to track short-term market momentum using micro channel trend lines.
Micro Channel Trend Lines
Let’s build on basic price action trading concepts to explain our tool - micro channel trend lines.
Step-by-step, we’ll cover:
- What are trend lines?
- What are channel trend lines?
- What are micro channel trend lines?
#1: What are trend lines?
The purpose of a trend line is to track a trend.
Hence, you can draw a trend line:
- Below the price bars in a rising market; or
- Above the price bars in a falling market.
In a bull trend, a trend line often acts as market support.
The chart below shows an example of a bull trend line.
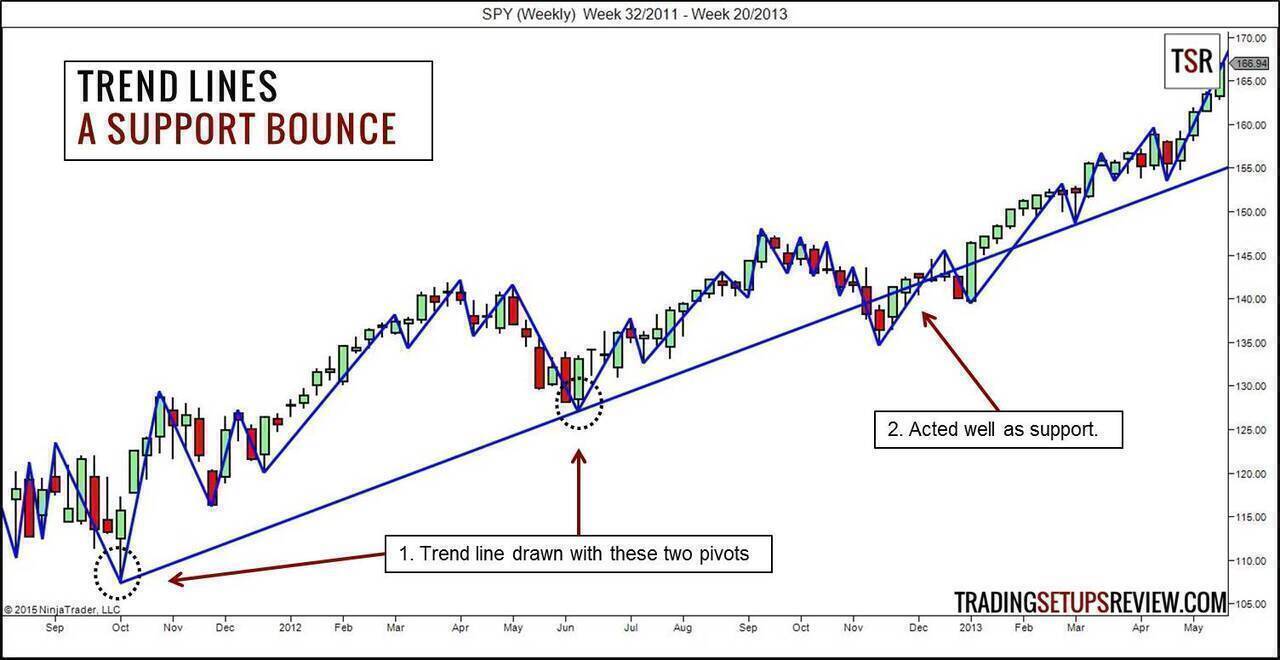
- By connecting these two pivot lows, we can project a bullish, upward-sloping trend line.
- It served well as a support zone.
#2: What are channel trend lines?
Now, let’s talk about channel trend lines.
Trend lines highlight the existence of a trend; channel trend lines are drawn to highlight the advance of a trend.
Hence, you can draw channel trend lines:
- Above a rising market or;
- Below a falling market.
There are two ways to draw them:
- As parallel lines of trend lines or
- By connecting the trend extremes.
As Parallel Lines of Trend Lines
The brown line in the chart below is a channel trend line.
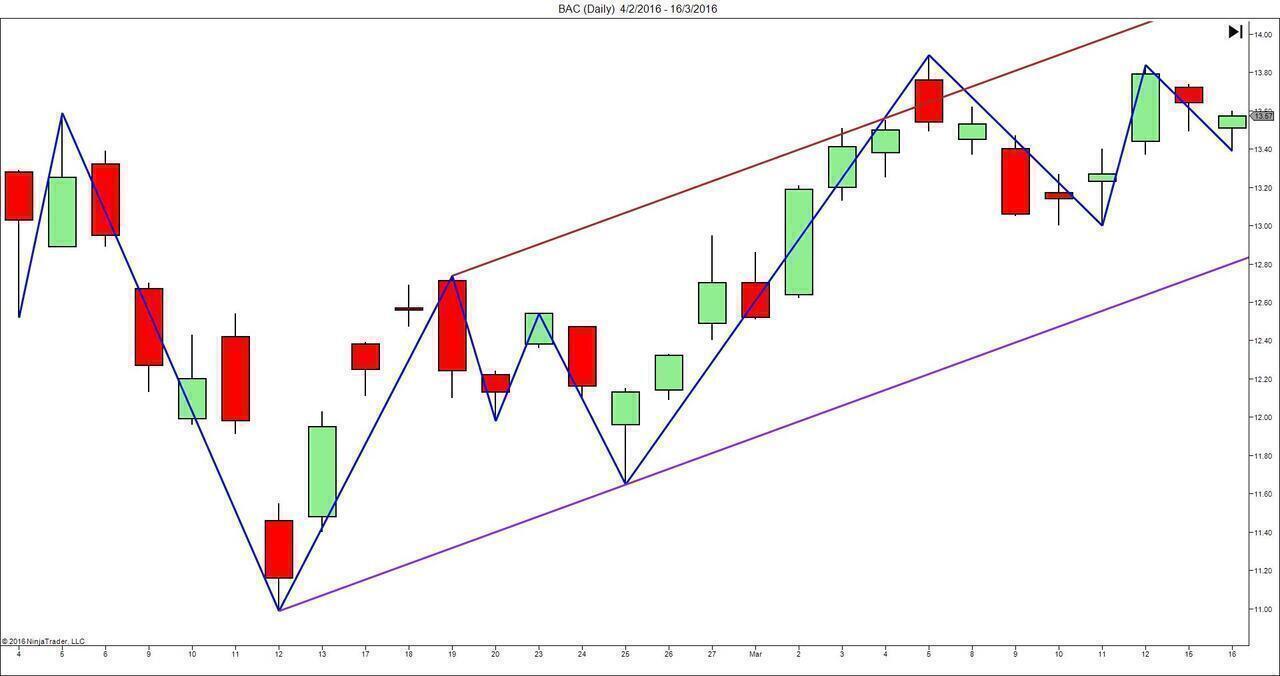
- First, we draw the bullish trend line (in purple) by connecting two pivot lows.
- Then, using the highest point between the two pivot lows as an anchor, we project a parallel line to the trend line. This projected line is the channel trend line (in brown).
As you can see, this approach requires us first to draw a trend line before arriving at a channel trend line.
By Connecting Trend Extremes
This is another method for projecting channel trend lines. And this is the method we will adapt for the micro channel trend lines explained below.
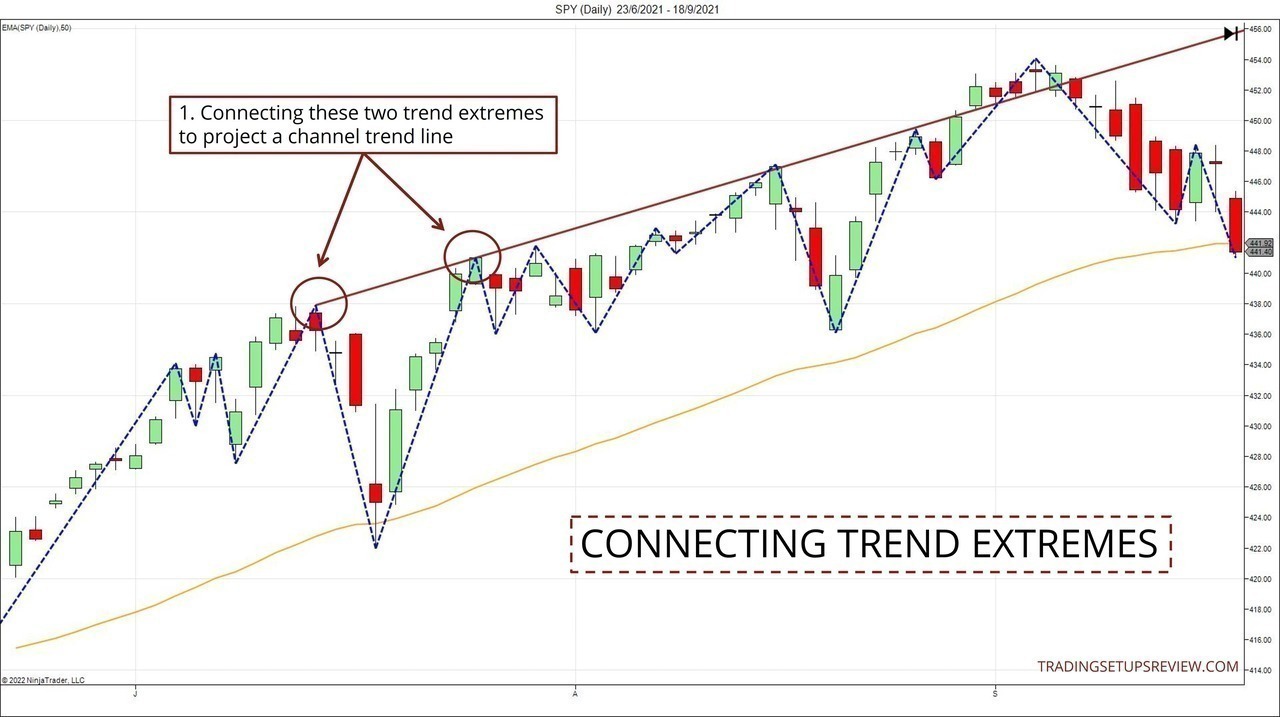
For this approach, we do not need to draw a trend line first. Instead, we can directly connect two trend extremes for the channel trend line.
In the context of a rising trend, this means connecting two swing highs formed as the trend rose.
#3: What are micro channel trend lines?
“Micro channel trend lines” is a mouthful. Just bear with it, and once you are confident about how to draw them, you can call them whatever you want.
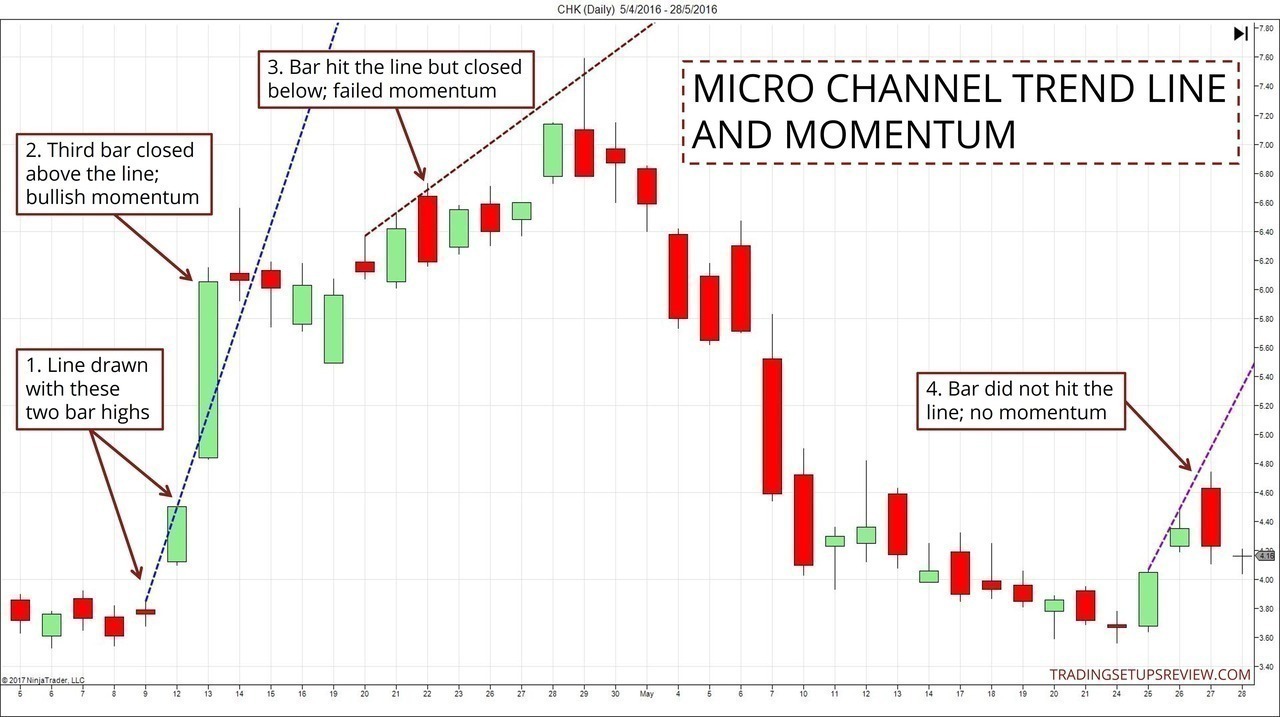
Micro channel trend lines are drawn using just two price bars. And you can draw them in both rising and falling markets.
Let’s focus on the bullish context here.
To draw a bullish micro channel trend line:
- Find two consecutive price bars.
- Ensure that the second price bar has a higher high than the first.
- Draw a line by connecting the two bar highs.
- Project the line to the right of the chart.
To interpret the momentum using the line, look at its interaction with the third bar.
The chart below shows three scenarios you will encounter.
Bullish Momentum
Follow these guidelines to interpret bullish momentum:
- Closes above the line - Bullish momentum (Refer to Point 2 in the chart above)
- Hits but closes below the line - Failed bullish momentum (Point 3)
- Does not hit the line - No momentum (Point 4)
Bearish Momentum
For bearish momentum, you need to draw bearish micro channel trend lines. Then, simply connect two consecutive bar lows to form a downwards sloping line.
Then, follow these guidelines to interpret bearish momentum:
- Closes below the line - Bearish momentum
- Hits but closes above the line - Failed bearish momentum
- Does not hit the line - No momentum
You’ll find instances of bearish momentum in the next section.
Try applying these guidelines to your charts. Once you can assess price momentum with a micro channel trend line, you are ready to move on to the next section.
How To Incorporate Momentum Into Your Trading Approach
Being able to track price momentum is an invaluable skill. But you must combine it with your market assessment to form a viable trading strategy.
Each time you spot price momentum, you have two options:
- Flowing into the market with it or
- Fading it.
It depends on your evaluation of the market context.
- Do you expect the market to resume its trend?
- Do you expect the market to stay in the trading range? Or do you expect it to break out of the trading range?
Your answers to these questions will determine how you can use momentum in your trading plan.
Let’s look at a few examples to get a better idea.
Example 1: Fading Counter-Trend Price Momentum
Momentum against the trend does not last. Instead, it often shows the counter-trend traders’ last-ditch effort in the current pullback.
Once you understand this, fading the move offers an excellent way to enter a trend.
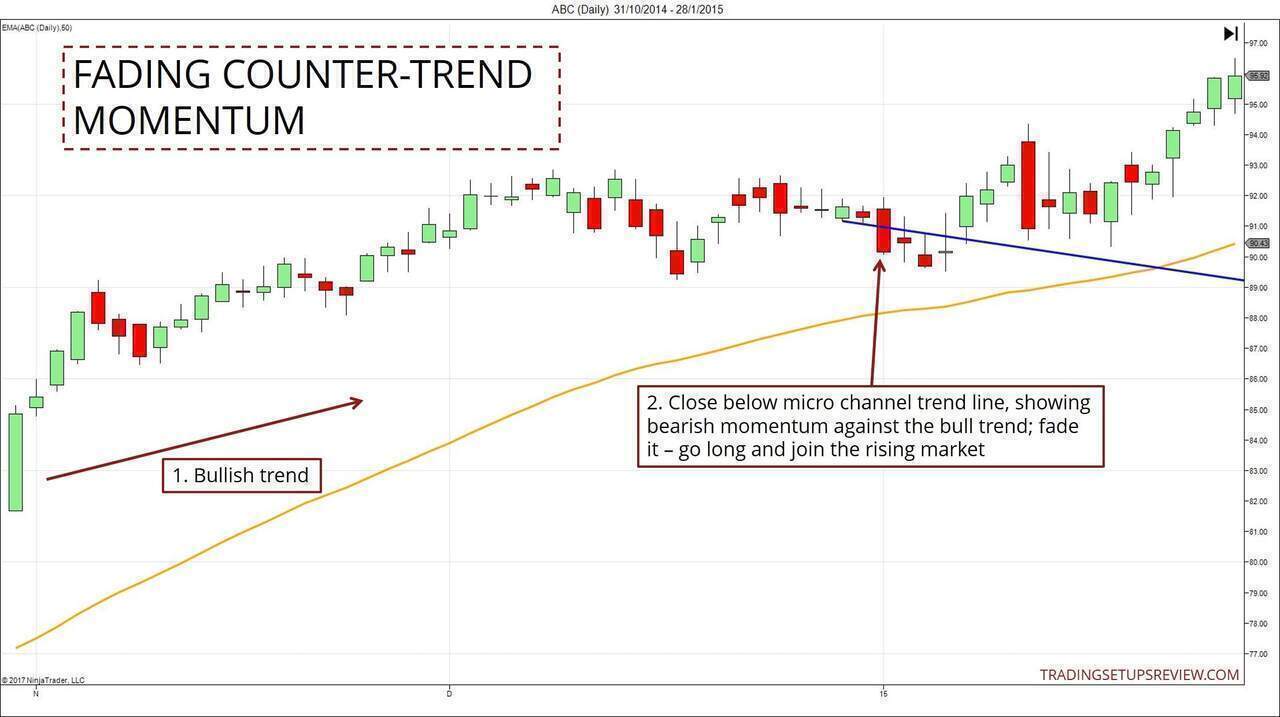
1. The market was far above the 50-period EMA and showed a strong bullish bias. Hence, we expected the bull trend to continue.
2. This was the first (and only) confirmed bearish momentum in this pullback. Buying as this bar closed below the micro channel trend line was a good idea.
However, it’s hard to employ a pattern stop-loss when you enter a trade by fading a price move. In such cases, consider volatility stop-losses as an initial stop-loss.
Example 2: Joining A Bull Trend
This similar example highlights the return of bullish momentum in the pullback.
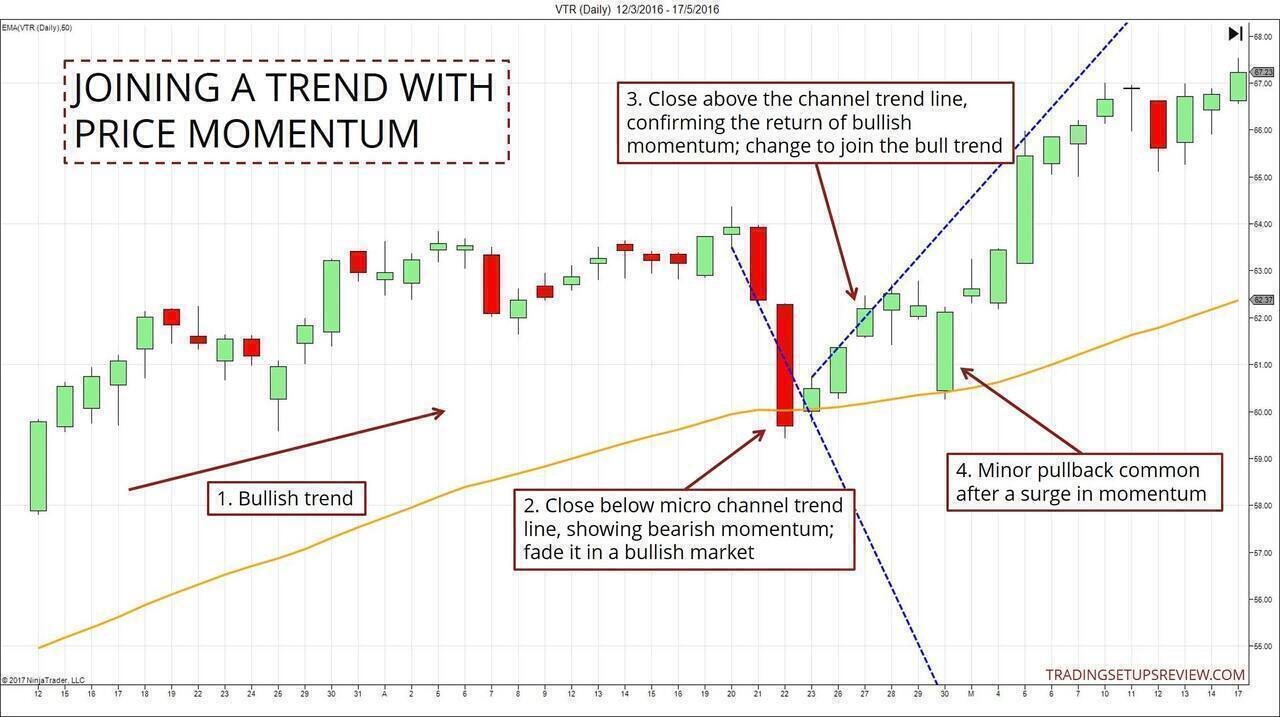
- This example shows the market above the 50-period EMA. Thus, we interpreted the signals within a bullish context.
2. This bar closed below the micro channel trend line, implying bearish momentum. You could have faded this bar to join the bull trend. This was the trading premise in Example #1 above.
3. If you had decided to wait for more price action to unfold, you would find another bullish observation. Here, this bar confirmed that bullish momentum had taken over, offering another chance to go long.
4. During a deep pullback in a bull trend, a surge of bullishness is a reliable long setup signal. It’s common for the market to go against you for a couple of bars as the momentum consolidates. However, consider an early exit if the market stalls for a more extended period.
Example #3: Analyzing a Two-legged Pullback
This example shows how micro channel trend lines illuminate what’s happening in a counter-trend pullback.
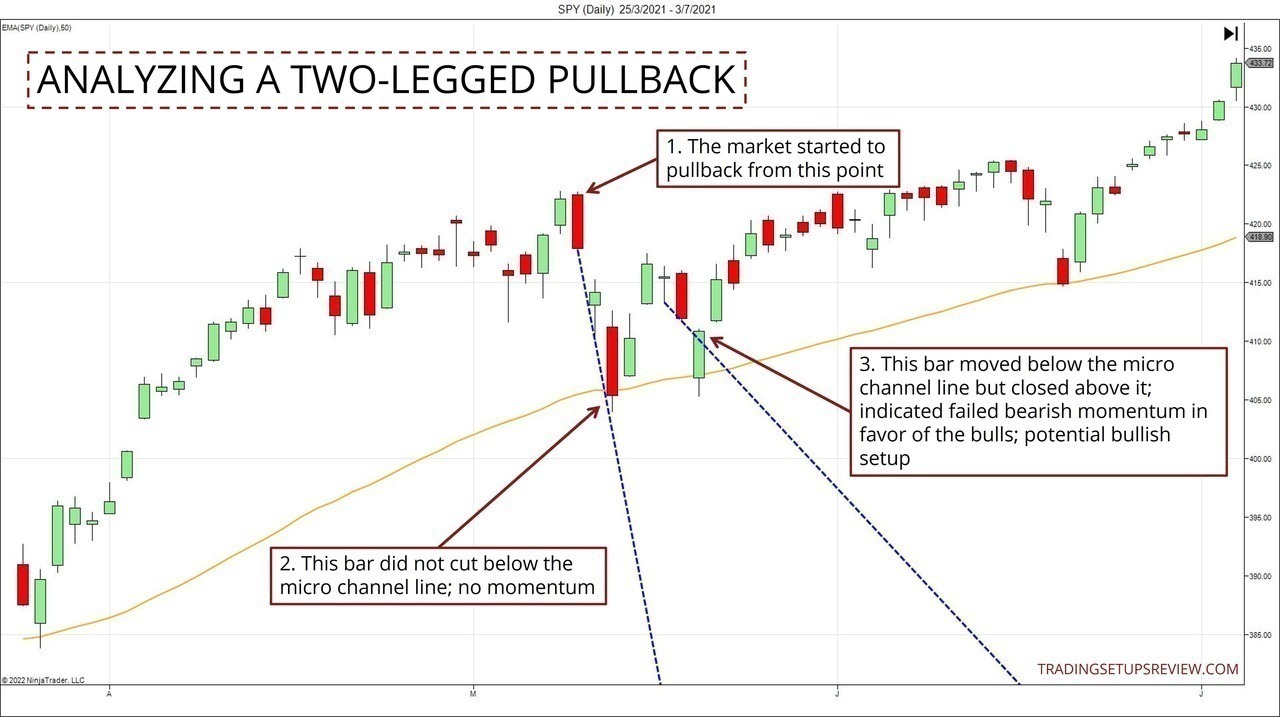
- As the trend pushed to a new high, the market responded with a bearish Engulfing candlestick which led to a pullback.
- Using a micro (channel trend) line, we evaluated a lack of bearish momentum following through in the first leg of the pullback. This observation might have prompted aggressive traders to take a long setup.
- In the second leg of the pullback downwards, the micro line continued to be a useful analytical tool. It highlighted that the bears tried to assert momentum but failed, presenting a long setup in the form of a solid bullish reversal bar.
Integrating our observations above, we found an excellent context for taking a long trade as the second leg ended.
Conclusion - Micro Channel Trend Lines & Momentum
This method is simple and does not require any complex indicator. You can implement this approach as long as your charting platform allows you to draw trend lines. In fact, with some practice, you can visualize these micro lines for analysis without actually drawing them.
This elegant method helps you spot price momentum while staying close to price action. Instead of using a separate indicator to analyze momentum, let the price action set the stage for you.
Note that this method focuses on price momentum over the shortest possible horizon. In essence, our analysis is only over three price bars. We set the stage with the first two bars and seek confirmation with the third. Because of this design, it works well on most timeframes.
The underlying concept of this micro line method is similar to the Anti-Climax pattern in my trading course. Both exploit explosive price movement that is not sustainable against an established trend.
Fire up your charts now. Try reading the market by visualizing micro channel trend lines, and uncover a new layer of price action information.
The article was first published on 5 May 2017 and updated on 4 August 2022.