Belt Hold Candlestick Pattern Trading Strategies Guide
By Galen Woods ‐ 8 min read
Go beyond belt hold candlestick pattern recognition. Learn two practical trading strategies that offer more reliable entries for price action trading.
The belt hold formation is a unique candlestick pattern. As a single candlestick, it offers one of the most explicit signals of the current market direction. But simply knowing how to identify this pattern is not enough. You’ll also need to learn specific ways to trade it effectively.
In this trading guide, you’ll learn to:
- Identify a belt hold candlestick pattern
- Take advantage of the belt hold pattern using a practical price action strategy
- Trade this simple candlestick pattern through in-depth chart analysis
The belt hold candlestick pattern is also known as the Yorikiri. It is a Japanese term borrowed from sumo wrestling.
Want to get a sense of the power implied by this sumo technique? Click here to watch a short sumo wrestling clip showing the Yorikiri.
If you’re familiar with the Marubozu, you will find it easy to grasp the belt hold pattern. In theory, Marubozu is the most potent candlestick. But it’s hard to trade the Marubozu directly.
Think of the belt hold pattern as a relaxed Marubozu. One that you find in a specific context that makes it more useful for traders.
How To Identify The Belt Hold Candlestick Pattern
In your research, you might see different definitions of the belt hold pattern. Traders indeed define it differently based on their understanding.
Hence, I’ve listed the pattern criteria in two categories: essential and optional.
The essential conditions capture the basic idea of the belt hold pattern. They should be present for all instances of the belt hold candlestick pattern.
The optional conditions relate to enhancing the pattern. These supplements are useful. But they are secondary compared to the more significant price context. (e.g., the market structure and support and resistance at that point)
Bullish Belt Hold Candlestick Pattern
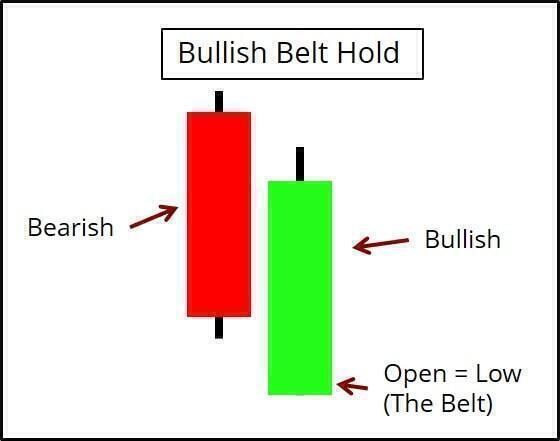
Essential Conditions
- The belt hold candlestick does not trade lower than its opening price. (i.e., no lower shadow)
- The belt hold candlestick bar must be bullish.
- The previous candlestick must be bearish.
Optional Conditions
- The belt hold candlestick must close within the body of the previous candlestick.
- The belt hold candlestick should close near its high.
- The belt hold candlestick must open lower than the low of the previous candlestick.
Bearish Belt Hold Candlestick Pattern
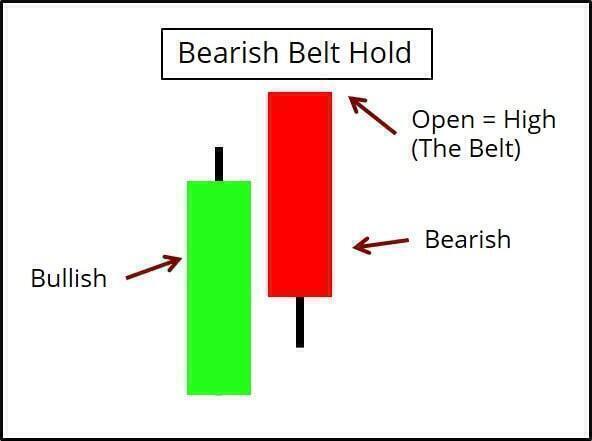
Essential Conditions
- The belt hold candlestick does not trade higher than its opening price. (i.e., no upper shadow)
- The belt hold candlestick must be bearish.
- The previous candlestick must be bullish.
Optional Conditions
- The belt hold candlestick must close within the body of the previous candlestick.
- The belt hold candlestick should close near its low. (i.e., little lower shadow)
- The belt hold candlestick must open higher than the high of the previous candlestick.
What Does The Belt Hold Candlestick Pattern Mean?
Let’s go back to the basics to understand what the belt hold pattern means.
The shaved bottom or top is the most significant feature of a belt hold candlestick.
Consider a bullish belt hold. It is a big show of bullish force. It is telling you that the buying pressure is so overwhelming that the sellers could not gain any ground.
The belt hold pattern has added significance when you find it in the daily timeframe. It represents a session that has moved relentlessly in one direction since its opening.
Explore Two Belt Hold Candlestick Trading Strategies
Price action trading is not about finding price patterns and immediately hitting the buy or sell button.
Instead, it is about using your understanding of price behavior to design strategies that take advantage of the pattern.
To do this, you’ll need a solid foundation in price action analysis and at least some market experience.
Here, I present two trading strategies to get you started with the belt hold pattern.
- The first strategy modifies the standard trading approach. Instead of entering the moment you see a belt hold pattern, wait for the market to test the pattern.
- The second strategy uses consecutive belt hold candlestick patterns. By focusing on overlapping patterns, you can confirm a new trend with confidence.
For the charts below, I’m applying the default candlestick indicator in NinjaTrader. It varies slightly from the essential conditions stated above. But it is close enough for our purpose here. (Specifically, it requires the belt hold to open away from the previous close by at least five ticks.)
First Trading Strategy: Belt Hold Candlestick Pattern Test and Rejection
The standard belt hold strategy would have you entering once the pattern completes. However, waiting for a secondary signal might offer better timing.
This is how it works for a bullish belt hold:
- Assume that the low of the belt hold candlestick serves as a minor support level.
- Look for attempts to push below this support level.
- As these attempts fail, fade them by going long.
Use the same principles to work out the bearish setup rules. If you’re unclear, refer to the bearish example below. (Example #2)
Example #1: Two Bullish Belt Holds
This daily chart shows two bullish belt hold instances in a rising market. Given the context, they served as continuation patterns.
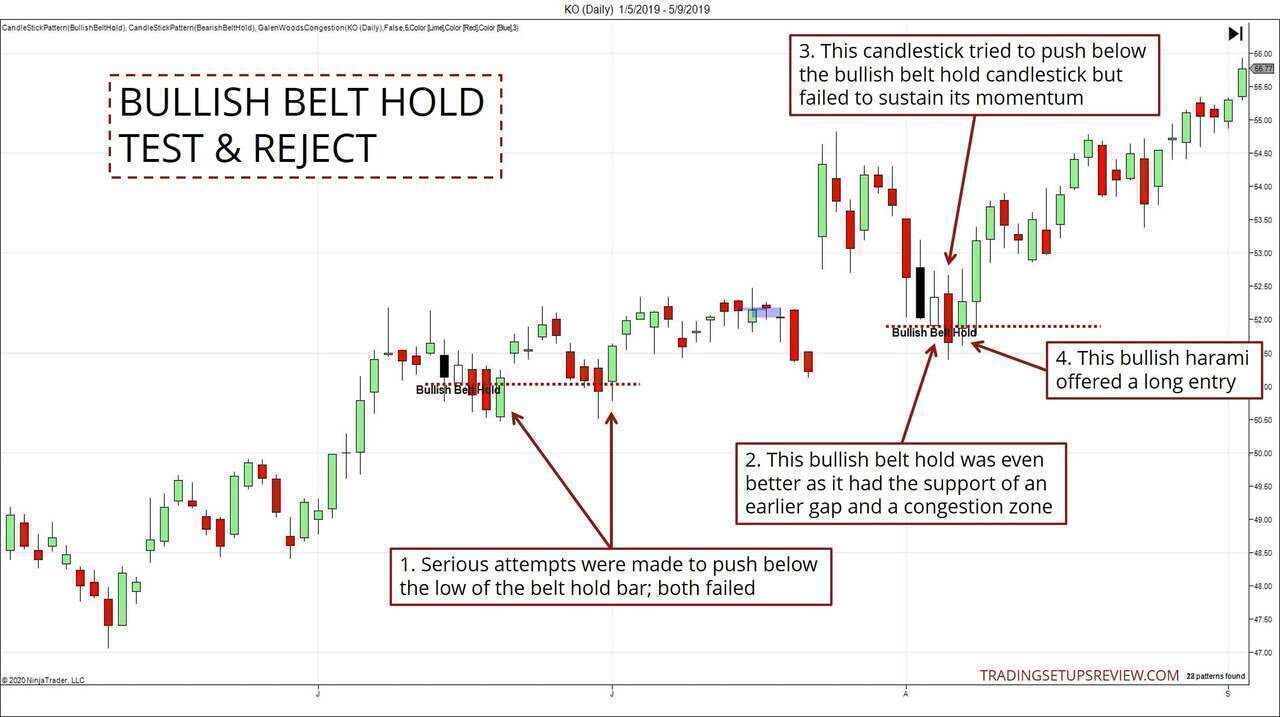
- The market made credible attempts to break the low of the bullish belt hold candlestick. However, the market rejected the attempts swiftly. According to our approach, each of these failures offered a long entry.
- This bullish belt hold had the support of an earlier gap and a congestion zone (blue shading).
- This bearish candlestick tried to push below the bullish belt hold, but it did not gain momentum.
- Instead, a bullish Harami formed and offered an opening to go long.
Example #2: Bearish Belt Hold Test and Reject
This example shows the market reversing into a bear trend.
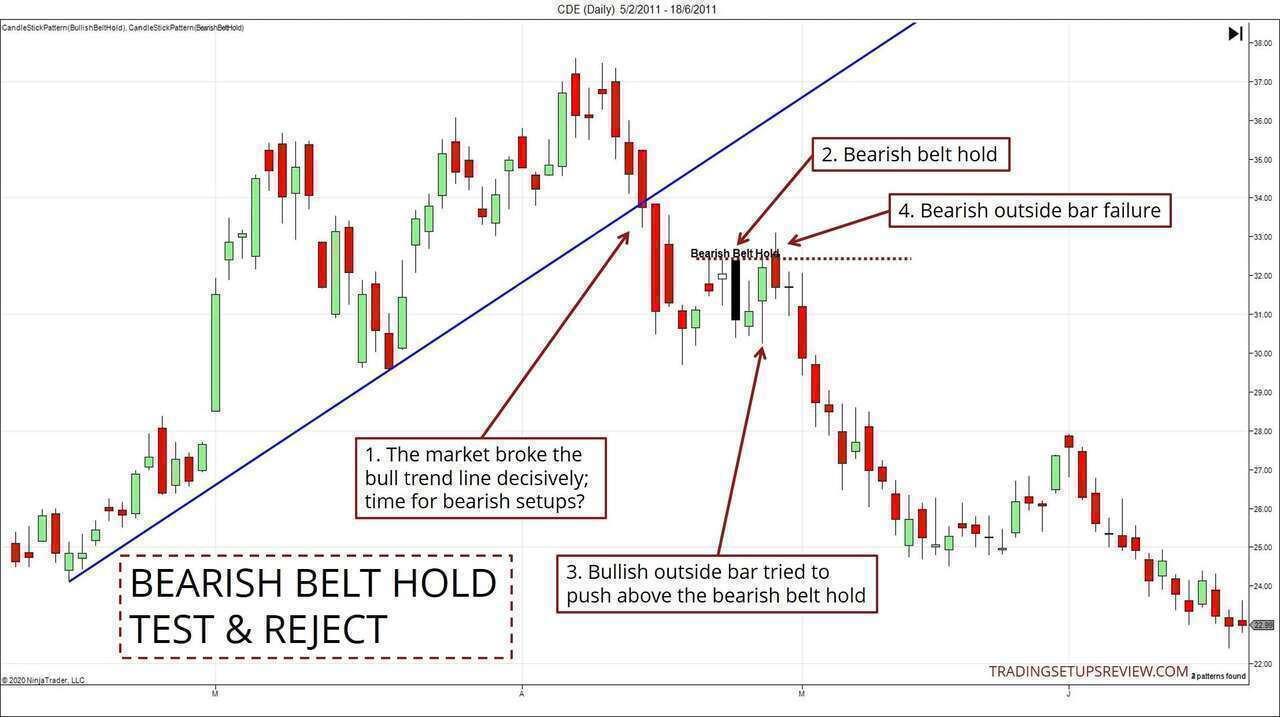
- The market broke this bull trend line decisively. It opened the possibility of a change in market bias.
- A bearish belt hold candlestick formed here. Instead of entering immediately, we waited for a test of its high.
- This bullish outside bar tried to break above the bearish belt hold candlestick.
- While the next candlestick managed to rise above the belt hold, it ended up as a bearish reversal bar. With this rejection, we could get into a short position. (This setup was also an outside bar failure.)
Second Trading Strategy: Consecutive Belt Hold Candlestick Patterns
Take a moment and think about the defining feature of a belt hold candlestick.
Its opening price is always at its lowest or highest price.
This means that, at least for that single candlestick, the bulls are in absolute control. (Or the bears in the case of a bearish belt hold.)
Once you get this, you’ll find that it works great for finding support and resistance levels. And this strategy seeks to achieve that.
This trading strategy is simple. Look for:
- Consecutive belt hold patterns
- In the same direction
- Forming around the same price level
Example #1: Bearish Reversal
This example comes from the daily chart of Altair Engineering.
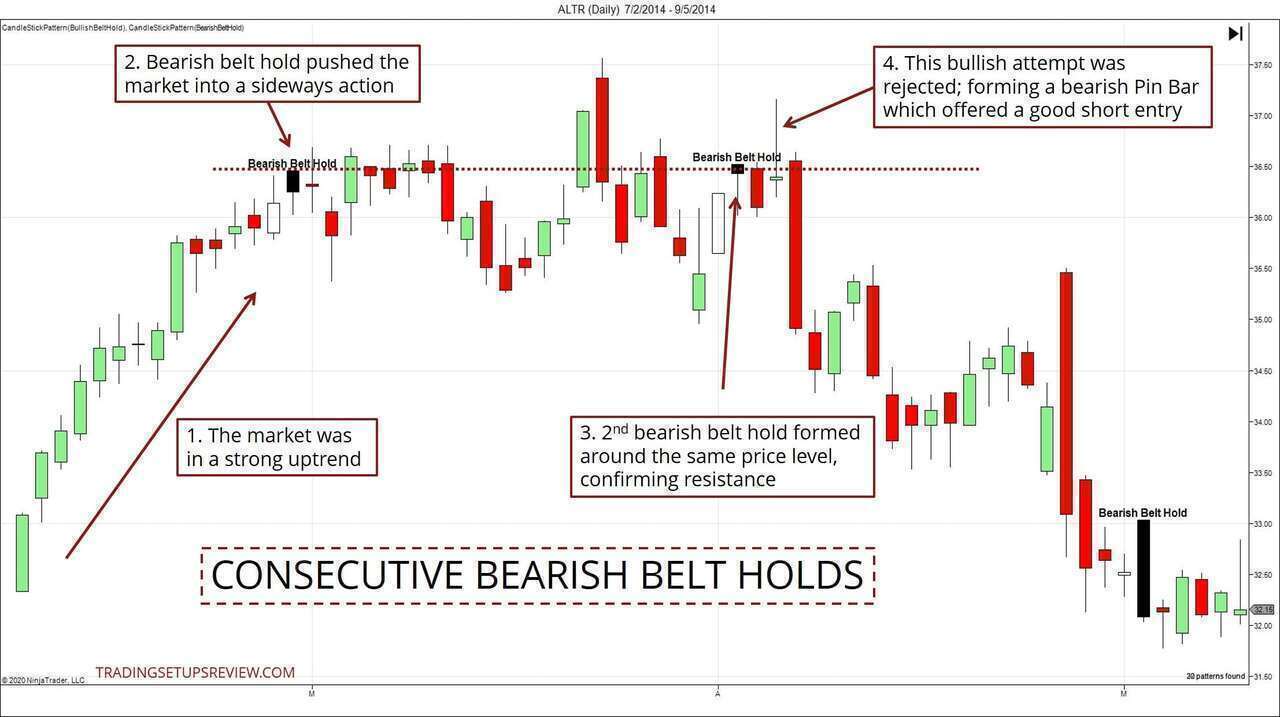
- The market was in a dominant bull trend.
- This bearish belt hold pattern kicked off a meandering phase. The market slid sideways for a couple of weeks before trying to push higher again.
- During the pullback down from the new trend high, a second bearish belt hold pattern formed. Note that it developed around the level of the first bearish belt hold. This formation confirmed the presence of a supply zone (resistance) around this level.
- This bearish pin bar was the result of a failed bullish thrust. It confirmed the bearish inclinations of the market. At the same time, it also offered an entry point for a short position.
Example #2: Confirming The Start of A Bullish Trend
This daily candlestick chart shows the prices of Home Depot Inc (HD).
This example is striking as it contains four belt hold candlestick patterns. Hence, it offers us a chance to compare a set of bearish belt holds with a set of bullish equivalents.
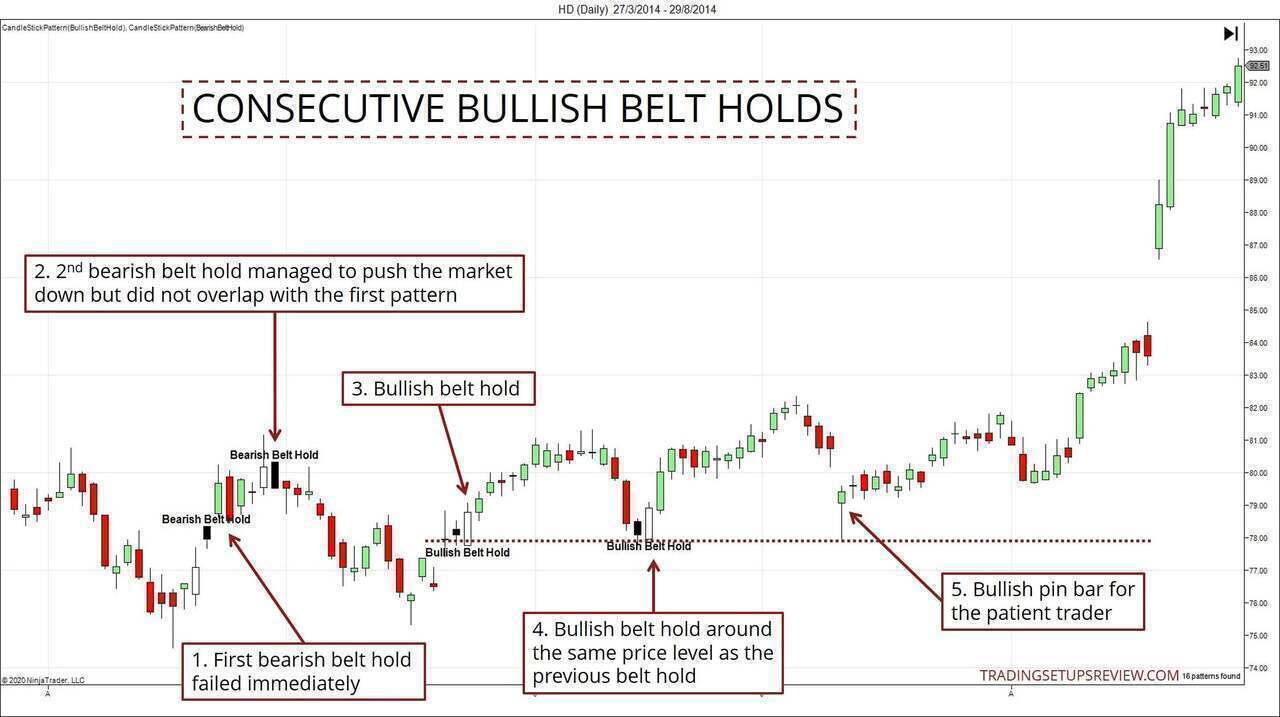
- The first bearish belt hold failed immediately. When a bearish pattern fails swiftly, it usually bodes well for the bulls.
- The second bearish belt hold candlestick pattern managed to turn the market down. However, this pattern did not overlap with the first bearish belt hold. (This is unlike what we saw in the last example.)
- This is the first bullish belt hold pattern. It formed around the level of the first bearish belt hold. This observation brought to mind the idea of flipping support and resistance.
- This second bullish belt hold candlestick sealed the deal for us. It formed almost right at the level of the first bullish belt hold. Together, these patterns signaled that the buyers were aggressive at this price level.
- It was reasonable to enter a long position right after the second belt hold. But for the patient trader waiting for a better entry point, this bullish pin bar was ideal.
Conclusion - Trading The Belt Hold Candlestick Pattern
As you might’ve noticed, the belt hold pattern often forms as part of another candlestick pattern. The engulfing and piercing line are common examples. Learning more about these patterns can enhance your candlestick analysis.
The belt hold candlestick pattern is a simple formation. But remember that trading this pattern is not a mechanical act.
In this guide, we introduced two strategies that employ the belt hold pattern. These strategies are not perfect. But they provide a foundation for you to start exploring the belt hold pattern.
Go ahead and open up your charts to experiment more with the belt hold pattern. Nothing beats using your observations to design a trading plan that suits you.
For course students: The Pressure Zones taught in the course work well with the consecutive patterns approach above. Instead of belt holds, looking for overlapping Pressure Zones.