This website or its third-party tools use cookies which are necessary to its functioning and required to improve your experience. By clicking the consent button, you agree to allow the site to use, collect and/or store cookies.
Please click the consent button to view this website.
I accept
Deny cookies Go Back
  • Price Action Trading Course
  • Trading Setups
  • Topics ↓
    • Price Action Trading
    • Day Trading
    • Trader Development
    • Site Map
  • TSR Trading Guides
  • Resources
    • Udemy Trading Course
    • Trading Books
    • Trading Indicators
    • Forex Tester 4
    • NinjaTrader & Kinetick
  • Member Login

Trading Setups Review

Trading Strategies, Guides, and Articles for Active Technical Traders

You are here: Home / Trading Setups / A Simple and Effective Price Action Trading Setup

A Simple and Effective Price Action Trading Setup

By Galen Woods in Trading Setups on November 18, 2013

Observing price action is the simplest way to trade.

Yet, many price action trading setups are not simple at all, requiring interpretation of complex and subjective chart formations.

The worst part is that traders often memorize price action trading setups without understanding the concept behind them.

In this article, we will introduce a simple and effective price action trading setup – Trend Bar Failure.

Basic Definitions For Price Action Trading

Trend

In price action trading, higher highs and high lows show an upward trend. Lower highs and lower lows show a downward trend.

In our examples, for simplicity, we will be using the slope of the 20-period EMA as our trend filter.

You are free to use your own methods and discretion to find the trend. Some of the more popular trend tools are moving averages and the ADX indicator.

One tip for identifying trends: trends are evident. When it is doubtful whether the market is trending, it is not trending.

Trend Bar

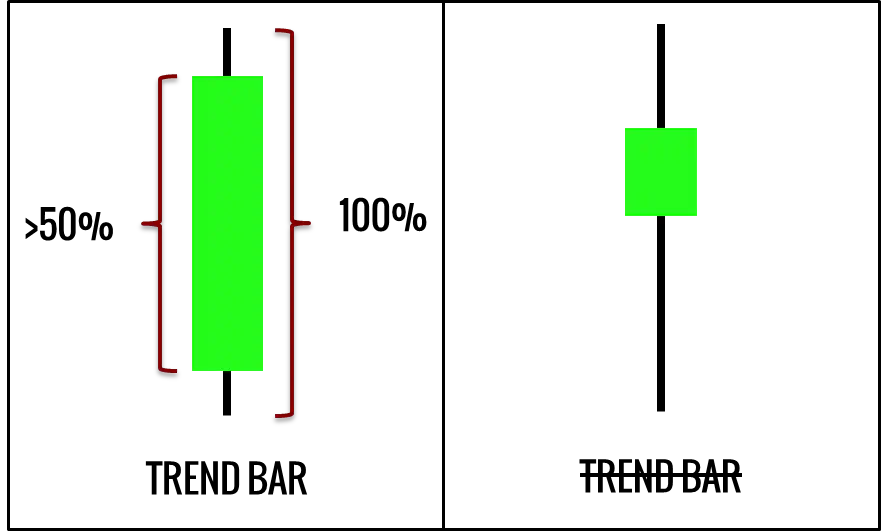
A trend bar is one that represents a trend within a smaller time-frame. It opens and closes on opposite ends of the bar.

A bull trend bar opens near its low and closes near its high. A bear trend bar opens near its high and closes near its low.

What does a trend bar mean?

It means that traders have committed to one direction. Remember that in every bar, the same number of contracts are sold and bought.

The only reason for a bar to end up with a higher price is that the buyers were more aggressive than the sellers. The reverse is true for a bear trend bar.

How does a trend bar look like?

While we can identify trend bars subjectively depending on the market context, I prefer a more objective measure.

A trend bar has a body that is greater than 50% of the entire bar range.

Trend Bar

Trading Premise

These premises set the stage for this price action trading setup and explain its concept.

The explanation below is for a bull trend. The reverse is true for a bear trend.

1. Trends tend to continue.

Our first premise is one of the principles of technical analysis.

As trends tend to continue, our edge lies in following the trend.

2. Trend bars against trend hint at the entry of counter-trend traders.

In a bull trend, bear trend bars represent counter-trend traders trying to reverse the trend. The committed bearish traders are counter-trend traders.

3. The trend continues as counter-trend traders fail in their attempt to reverse the trend.

According to our first premise, the trend is more likely to continue than to reverse. Hence, it is likely that the counter-trend traders are wrong. The bearish trend bar is expected to fail without significant follow-through.

As the counter-trend traders realize that the bull trend is not reversing as they anticipated, they will cover their short positions and might even reverse to buy.

The Trend Bar Failure Trading Setup

Following the premises above, the entry for a trend continuation trade takes place when a trend bar against the trend fails.

If a trend bar is not followed by another trend bar, we should prepare ourselves for a Trend Bar Failure.

Rules for Long

  1. 20-period EMA is sloping up (or if your trend assessment is bullish)
  2. Bear trend bar
  3. Low of bear trend bar broken (without forming a second bear trend bar)
  4. Place a buy stop order above the high of the bar
  5. Cancel order if not triggered within one bar

Rules for Short

  1. 20-period EMA is sloping down (or if your trend assessment is bearish)
  2. Bull trend bar
  3. High of bull trend bar broken (without forming a second bull trend bar)
  4. Place a sell stop order below the low of the bar
  5. Cancel order if not triggered within one bar

Trade Examples – ES Futures (5-Minute)

Trend Bar Failure ES Example
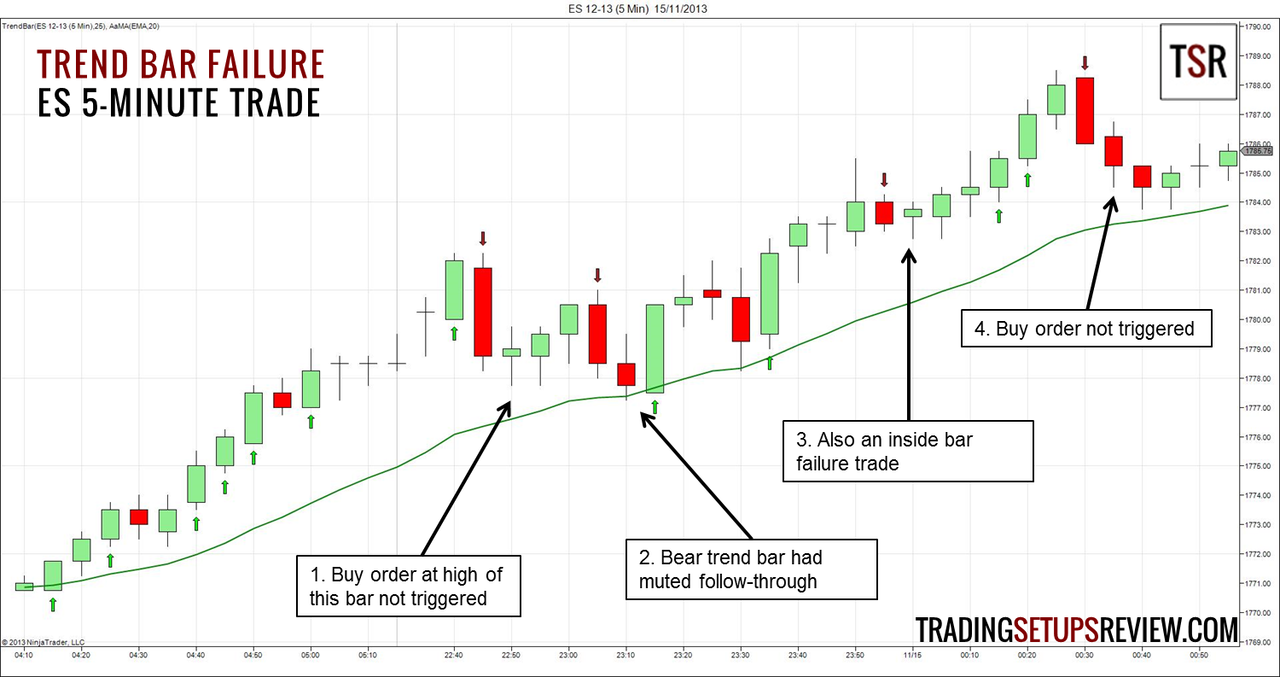
We have marked the trend bars in the charts. Bull trend bars with green arrows and bear trend bars with red arrows.

  1. A powerful bearish bar followed by a bullish reversal bar. It had good potential, but the buy order placed at the high of the bullish reversal bar was not triggered.
  2. A bearish trend bar tested the EMA without much follow-through. The bull trend bar triggered the buy stop order and led to a profitable trade.
  3. This bear trend bar was also an inside bar. The two failure trades (failure of inside bar and trend bar) led to the six consecutive bull bars.
  4. Although the bar after the marubozu was not a bear trend bar, its high was not broken, and our buy order was not triggered.

We cancel the orders if they are not triggered within one bar.

This is because the best trades happen quickly like a knee-jerk reaction. By canceling orders that are not triggered swiftly, we are avoiding inferior trades and taking only the very best trades.

Trade Examples – Ameren Corp (Daily)

Trend Bar Failure AEE Example
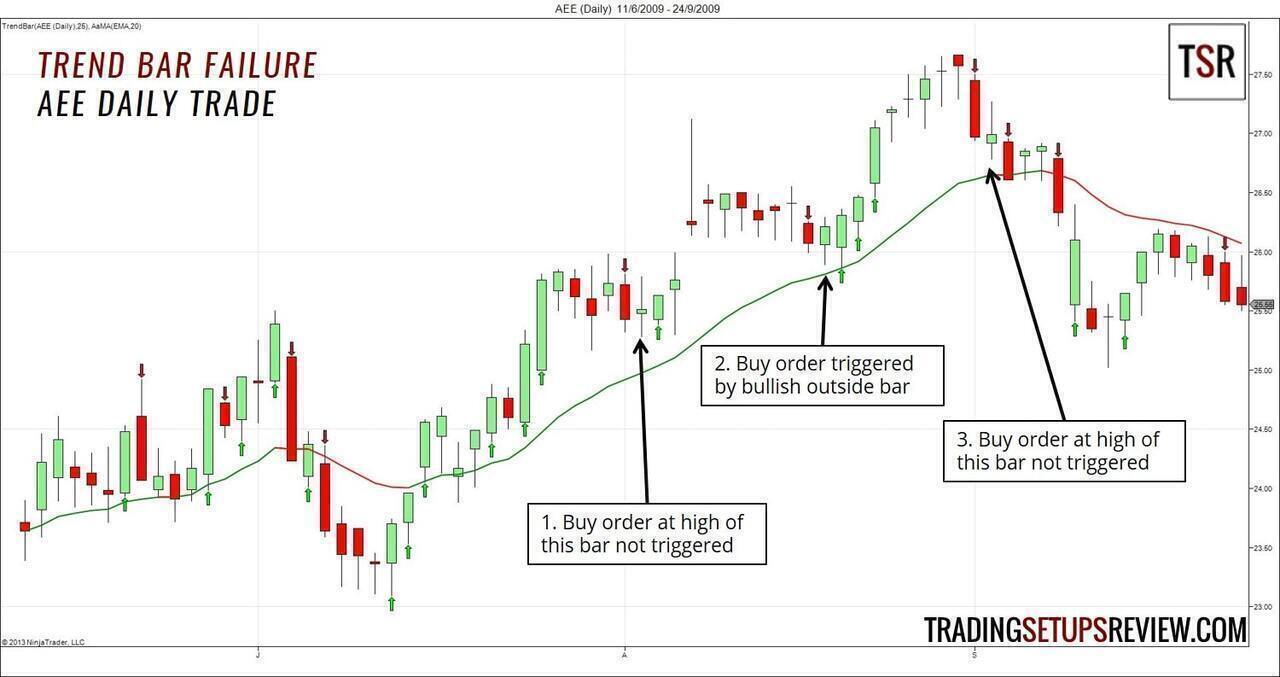
You can use this price action trading setup for swing trading as well.

  1. A doji broke the low of the bear trend bar. However, the buy order was not triggered.
  2. An irresistible trade, with an outside bar hitting our buy stop order after testing the EMA.
  3. The firm bear trend bar had little follow-through, but the buy order was not triggered.

Trade Example – EUR/USD (Weekly)

Trend Bar Failure EURUSD Example
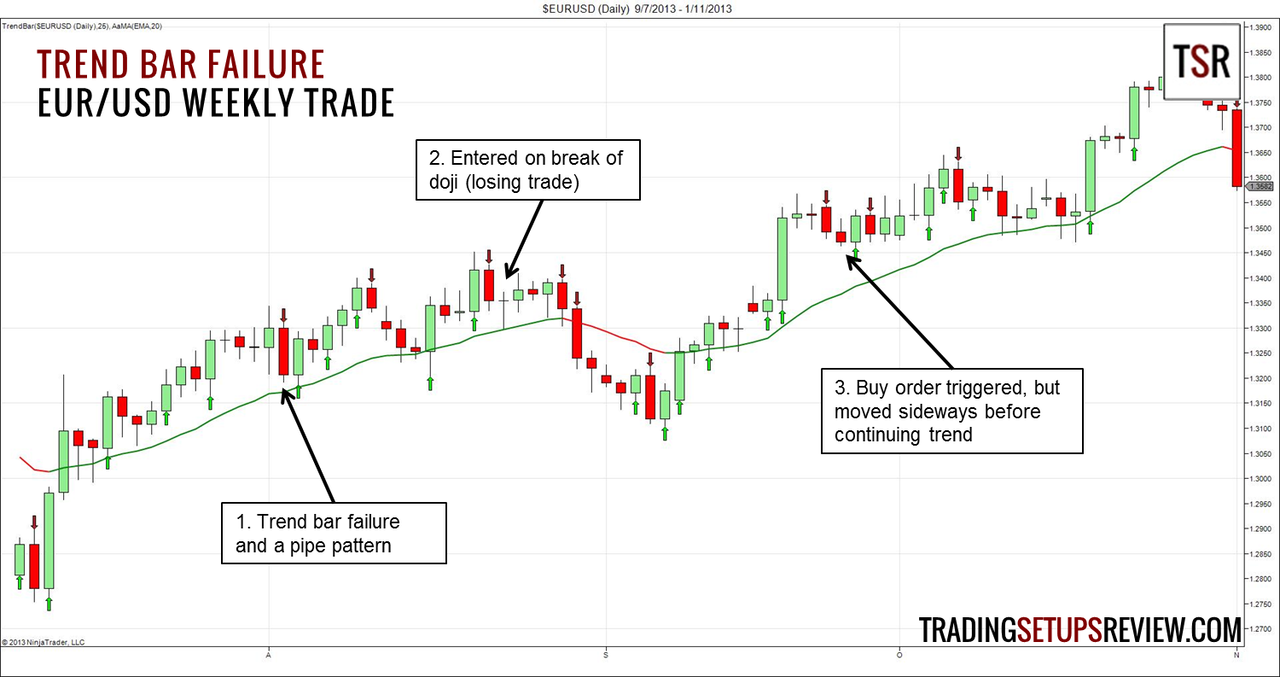
Price action trading setups work well in the forex market.

  1.  The bear trend bar failed with a bull trend bar. This pattern is also known as the pipe pattern.
  2. This trend bar failure was also an inside bar failure. However, the signal bar was a doji and not ideal.
  3. The bear trend bar had limited follow-through. Although this trade was profitable, prices went sideways before resuming the trend. A more conservative trader would have exited during the sideways congestion.

Trade Example – SPDR S&P 500 ETF (Monthly)

Trend Bar Failure SPY Example
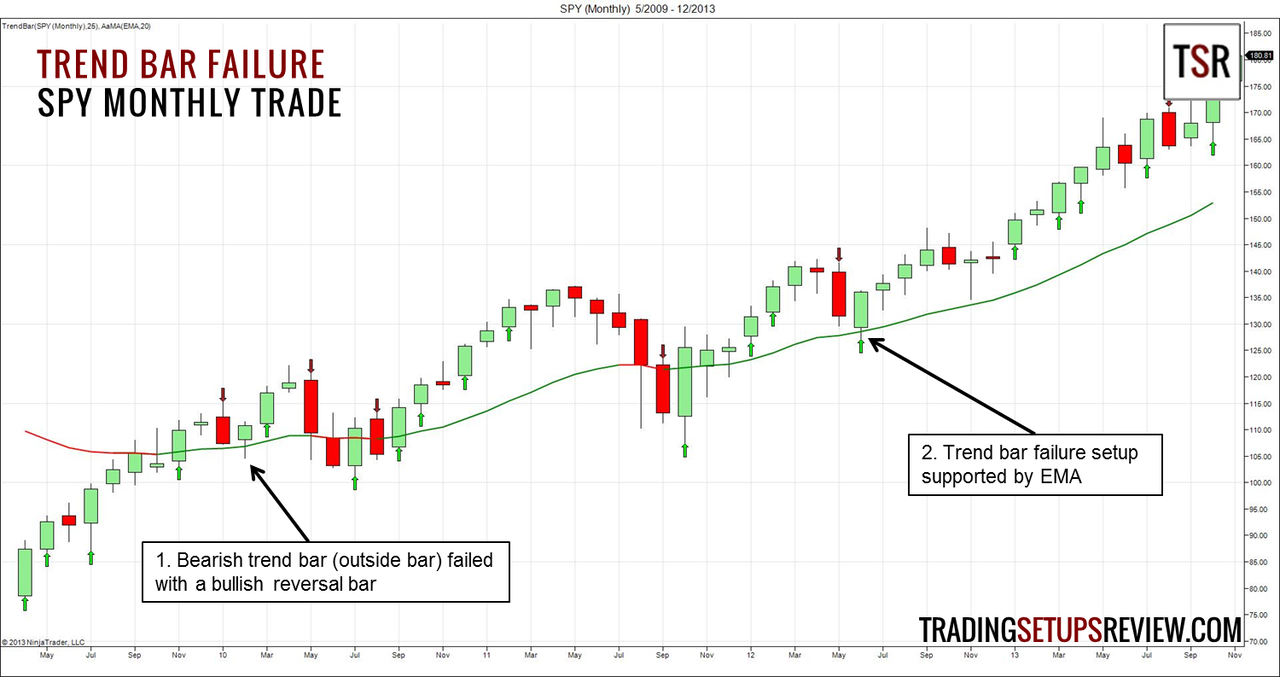
This simple price action trading setup is robust enough for long-term analysis as well.

  1. The bear trend was also an outside bar. This meant that the bears overwhelmed the bulls in that bar. However, the next bar was a bullish reversal bar. It was a good trade with excellent follow-through. However, it might end up as a loss if our targets were further.
  2. Another solid pipe pattern that tested the EMA.

Conclusion

The Trend Bar Failure trading setup is straightforward and versatile. It is the ideal starting point for price action trading.

The basic premise is the trapping of counter-trend traders. However, it manifests in different forms like inside bar failure and the pipe pattern.

As shown in the many examples above, you can use this price action trading setup in time-frames ranging from intraday trading to longer-term monthly analysis.

Want to learn more price patterns like the Trend Bar Failure? Check out my price action trading course and start learning right away.

Read more about Bar Patterns, Price Action Trading, Trading Trend

Serious Traders Only!

Day Trading With Price Action – A complete course that teaches you the art of price action trading.

Perfectly structured with step-by-step guides to help you understand the principles of price action analysis.

Click here for the course syllabus

More From Trading Setups Review

7 Forex Trading Books To Get You Started

4 Price Action Trading Strategies For Pullback Traders

Top 10 Day Trading Books

Trading Course Banner

Comments

  1. Brodwyn says

    January 15, 2014 at 4:15 PM

    Thanks for sharing this setup.

    So far, it looks “simple and effective”. I normally look at price action on daily charts for +2R targets (set and forget, so I only look at charts once a day at the close). Two days ago I put the lens of this setup on the charts and picked up signals on AUDNZD and USDSGD. I didn’t trade it but decided to monitor what would have happened. Both now are a few pips from the +2R targets (as I type) and both trades would have been risk free since I normally move SL to BE after price closes beyond +1R.

    I don’t know the hit rate of this setup on daily, but it’s encouraging that the first two trades I looked at moved in a favorable direction.

    Questions:
    1. Have you got any backtest stats on this (like you did for the inside bar setup).
    2. How much of a trend should exist before you trade? Must the 20EMA be sloping for most of the visible screen? Would you consider setups where the slope recently changed direction with price having made a new HH or LL?

    PS. This is one of the most professional looking trading sites I’ve seen. Your reviews come across as very professional and objective. This makes me quite receptive to this setup that is your own.

    Attached are my two charts mentioned above (the additional indicators are just bar range and body range calculations).

    Reply
  2. Galen Woods says

    January 16, 2014 at 10:57 AM

    Great to hear from you. I’m glad you find the trading setup and the website in general useful.

    To answer your question, I would consider trades where the slope of EMA recently turned. To make the trade “safer”, I consider the following:

    Strength of the swing that made the new HH/LL (the stronger the better)
    Signs of support and resistance from EMA (EMA should reject price in the direction of your trade)
    Trend on a higher time-frame (should support your trade)

    However, taking trend bar failures in a clear established trend is still a superior strategy.

    I have not back-tested this setup. When I do, I’ll definitely share them with you.

    Reply
    • Tage says

      December 13, 2017 at 8:32 PM

      This thread is on 2014. I just wanted to ask. did you back tested this strategy?

      Reply
  3. Quentin Walker says

    April 2, 2014 at 8:01 AM

    Hello Galen great site, the strategy is awesome I use it on the daily time frame and use three emas of the 10,20 and 30 to establish my trend. I also noticed that when the emas indicate a uptrend and a bearish pin bar forms the following day would invalidate the pin bar and force those sellers out often leading to explosive moves in the direction of the trend vice versa for a downtrend.

    Reply
  4. RonricoG says

    April 11, 2014 at 6:07 AM

    Galen,
    Many thanks for sharing this and all the other strategies posted here. I am in 100% agreement with Brodwyn that this is an extremely professional, first-class site. I get immense value out of your content, as I’m sure any serious and aspiring professional trader would. I have learned that new prop traders get buying power and technology from their firms but, depend on other traders when it comes to technique and strategy. I greatly-appreciate your willingness to share and help shorten the learning curve.

    Question re: Trend Bar Failure setup:
    What/which exit strategies do you find work best here for:
    1. Profit Target?
    2. Stop Loss?
    I’m playing with it using fixed % targets/stops, reverse signal, and HOLP/LOLP and would value your thoughts/experiences.

    Thank you!

    Reply
    • Galen Woods says

      April 12, 2014 at 12:05 PM

      Hi RonricoG, thanks for your kind comments.

      I always place a stop-loss just below the setup bar for long setups and above for shorts. As for targets, it’s more flexible. I like measured moves and volatility measures like a multiple of the average range. The methods you mentioned are reasonable choices too. However, I think exiting with a reverse signal might get you out too early, unless the reverse signal occurs at some major S/R.

      Targets, stop-losses and your overall assessment of the market bias should be assessed as a whole in order to find trading opportunities with positive expectancy. There’s a lot more I would like to share regarding this, but it’s too much for any one article. I’m working on a book right now that includes more price action setups with detailed examples including methods to exit. Stay tuned, I’ll send out an update once the book is ready.

      Thanks for reaching out!

      Reply
  5. Taruntapan Roy says

    October 7, 2017 at 12:20 PM

    U have mentioned to place buy stop order above the high of the bar
    Which bar ? Is it the trend failure bar or the trend bar itself
    Also why the order is to be cancelled if not executed in the next bar?

    Reply
    • Galen Woods says

      October 11, 2017 at 12:13 PM

      I’m referring to the high of the trend failure bar, which is the setup bar. We cancel orders because the best trades happen quickly like a knee-jerk reaction. By canceling orders that are not triggered swiftly, we are aiming for the best trades with good momentum.

      Reply
  6. singh says

    February 7, 2018 at 11:48 PM

    i find this website very useful and please update more on price action trading.

    with regards singh

    Reply
    • Galen Woods says

      February 8, 2018 at 5:09 PM

      Glad that you find the website useful. If you want to get updates on our latest articles, please join our mailing list here

      Reply
  7. Saro says

    March 25, 2018 at 6:31 AM

    I’m beginner for trading this website useful to learning

    Reply
    • Galen Woods says

      March 27, 2018 at 7:56 PM

      Hi Saro, glad to hear that! If you have any suggestions for topics you think will help a beginner trader like you, please let me know.

      Reply
  8. Vuyo says

    August 6, 2018 at 1:49 AM

    High Galen.
    Great article, however, i wanted to know what does an inside bar and outside bar failures mean.
    By the way I’m a still a new and aspiring trader.

    This has been a great and insightful post, I’ve read a lot of your post on your website and even have that free ebook.
    P.s I’m still working on buying your ebooks.

    Reply
    • Galen Woods says

      August 6, 2018 at 9:43 AM

      Hi Vuyo, great to hear that you find the content here helpful. Please take a look at this Outside Bar Failure article and this one on Hikkake (Inside Bar Failure).

      Reply
  9. grace says

    August 10, 2018 at 5:25 AM

    oh really bless by this article thanks for the insight. waiting to read more of good stuff. I will apply what I read into practice and share the out come

    Reply
    • Galen Woods says

      August 14, 2018 at 7:51 PM

      All the best!

      Reply
  10. srinivasan says

    September 17, 2018 at 11:42 AM

    Sir,
    IS there any number of points or % of stock price above the HIGH of setup bar we have to buy to avoid fake breakout??

    Reply
    • Galen Woods says

      September 17, 2018 at 7:27 PM

      You should set the entry order slightly above the high of the setup bar (use the bid-ask spread as a benchmark here) so that you enter only with a true breakout. As for avoiding false breakout, especially when you’re not confident of the market bias, you can consider a re-entry approach.

      Reply
  11. Srinivasan says

    November 20, 2018 at 8:50 PM

    sir,
    There is a small variation needed i think,since most traders r used to Super trend indicator .For example,even when candles r below EMA20 & down trend started but they r above Supertrend ,in this case price tends to move upwards due to Supertrend uptrend GREEN line still not broken.
    Whats ur suggestion on this?

    Reply
    • Galen Woods says

      November 25, 2018 at 9:36 AM

      Hi, you can certainly experiment with this pattern with different trend indicators including Super Trend if that’s what you’re familiar with. This pattern is presented as a simple starting point here. But be careful and always remember that you’re trading the price and not the indicator.

      Reply
  12. Andrey says

    November 30, 2019 at 11:07 PM

    thank you!

    Reply
    • Galen Woods says

      December 1, 2019 at 7:09 PM

      Glad you like it!

      Reply
  13. lalabhai says

    August 22, 2020 at 11:49 PM

    good

    Reply
    • Galen Woods says

      August 26, 2020 at 11:12 AM

      Thank you!

      Reply
  14. Srinivasan K says

    November 5, 2020 at 2:06 AM

    Sir
    Do u expect any min no of trending candles above 20sma line or only upward sloping 20sma with candles still below 20sma is enough for better Buy Trend filter??

    How to recognise& confirm trend change from below sma20 to above sma20 line?

    Will u think&wait for buy trade only when the candle is above sma20 ?

    Reply
    • Galen Woods says

      November 6, 2020 at 12:11 PM

      Hi Srinivasan, in the trading rules we used above, we only considered the slope of the MA. There are certainly ways to improve the trend assessment method using the MA, like waiting for a number of candles to be above the MA, as you mentioned. I’ve covered a few of these methods in this guide. Hope you find it helpful.

      Reply

Leave a Reply Cancel reply

Your email address will not be published. Required fields are marked *


Search Trading Setups Review

Get a Free Course Chapter from Galen Woods' Day Trading With Price Action Course [PDF]

Plus, our latest trading guides and tips in right your inbox.

Recommended For You

Top 10 Non-Trading Udemy Courses For Traders

Ease of Movement Trading Strategy

Intraday Trend Trading With Price Action (Trade Price)

The Ultimate Guide to Volatility Stop-Losses

10 Ways For Traders to Take Profit

How To Find The Intraday Market Bias With Price Action

John Hill’s Trend Line Theory – Using Trend Lines for Trading Pullbacks

Trading Course Banner

Trading Setups Review

  • About Us
  • Contact Us
  • Advertise With Us
  • Privacy Policy
  • Affiliate Disclaimer
  • Full Risk Disclosure

Learn More

  • Day Trading With Price Action Course
  • TSR Trading Guides
  • Trading Setups
  • Trading Articles
  • Trading Books
  • Site Map

Futures and forex trading contains substantial risk and is not for every investor. An investor could potentially lose all or more than the initial investment. Risk capital is money that can be lost without jeopardizing ones financial security or life style. Only risk capital should be used for trading and only those with sufficient risk capital should consider trading. Past performance is not necessarily indicative of future results.


The website contents are only for educational purposes. All trades are random examples selected to present the trading setups and are not real trades. All trademarks belong to their respective owners. We are not registered with any regulating body that allows us to give financial and investment advice.


Trading Setups Review © 2012–2021