Head And Shoulders Pattern Trading Guide (In-Depth)
By Galen Woods ‐ 13 min read
Learn advanced tactics to trade the head and shoulders pattern in our expert trading guide. Master this reliable chart pattern for trading market reversals.
The head and shoulders pattern has a memorable name and a striking look.
But the quote below confirms that the head and shoulders pattern is more than just a cute pattern. It offers real value to traders.
Head-and-shoulders tops are the best performing bearish chart pattern in a bull market.
Thomas Bulkowski, Author of Encyclopedia of Chart Patterns
Introduction
This guide, chocked full of practical chart examples, covers everything you need to know about this high performing pattern: head and shoulders.
To avoid confusion, the explanation in this guide is for the head and shoulders top pattern. It is a bearish reversal formation.
Its bullish equivalent is the head and shoulders bottom (inverse head and shoulders).
Familiarize yourself with the head and shoulders pattern. Then, you can apply the same logic to find and trade inverse head and shoulders.
Head And Shoulders Guide Overview
This comprehensive guide covers both the core and advanced concepts of the head and shoulders pattern.
Depending on your experience with this pattern, you may like to navigate directly to the sections that interest you.
#1: How To Identity The Head And Shoulders Pattern
#2: How To Trade The Head And Shoulders Pattern (Classic Trading Rules)
#3: Why Does It Work
#4: Advanced Trading Insights For Head And Shoulders
- Entry Methods
- Stop Loss Placement
- Target Price
- Volume Considerations
- Reversal Trading Tips
- Continuation Trading Possibility
- Best Pattern Form Guidelines
- Miscellaneous Tips
#5: Potential Pitfalls
#6: More Resources
#1: How To Identify The Head And Shoulders
Essential Parts
This diagram shows the key traits of a head and shoulders formation. Below it, you will find a list elaborating on each aspect.
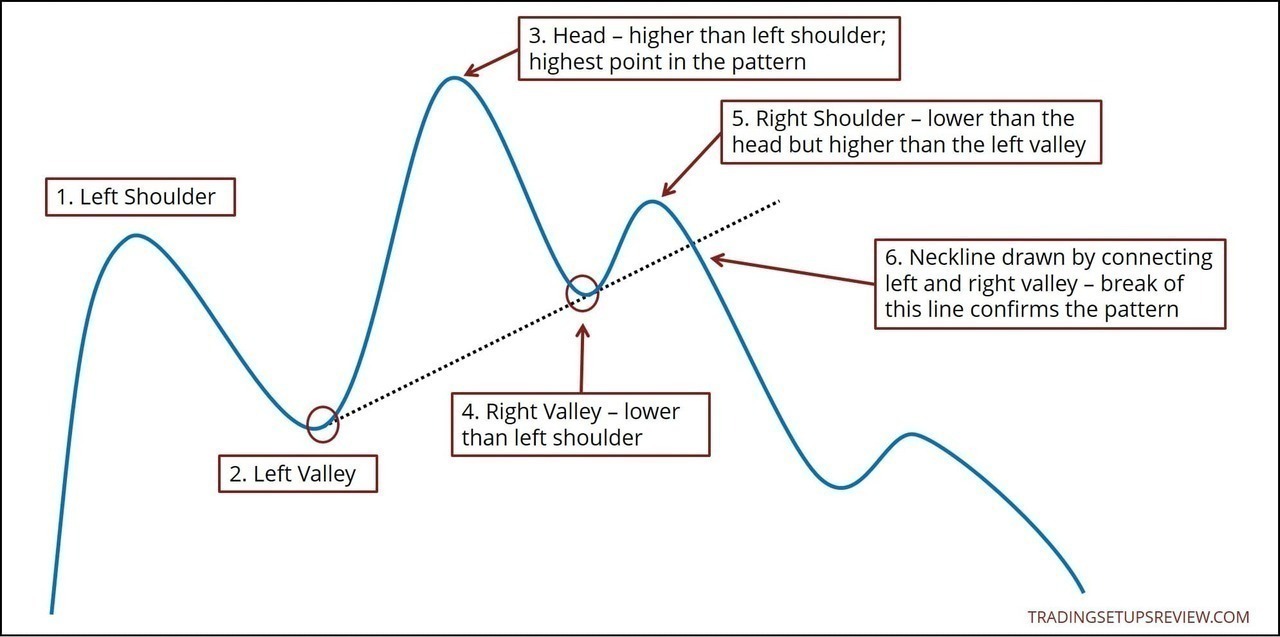
#1: Left Shoulder
- Must be the highest point of the current bull trend at the point of its formation
#2: Left Valley
#3: Head
- Must make a new high in the bull trend
- Must be the higher than the left shoulder
#4: Right Valley
- Must be lower than the left shoulder
#5: Right Shoulder
- Must be in between the head and the left valley
#6: Neckline
- Connect the left and right valleys to form the neckline
- The market must break below the neckline to confirm the head and shoulders. If the market rises above the head before breaking the neckline, the pattern becomes invalid.
Practical Tip For Finding Head and Shoulders
A head and shoulders pattern stands out on a chart. It looks like a head with shoulders.
And the shoulders must overlap. (#4 and #5 above made sure of that.)
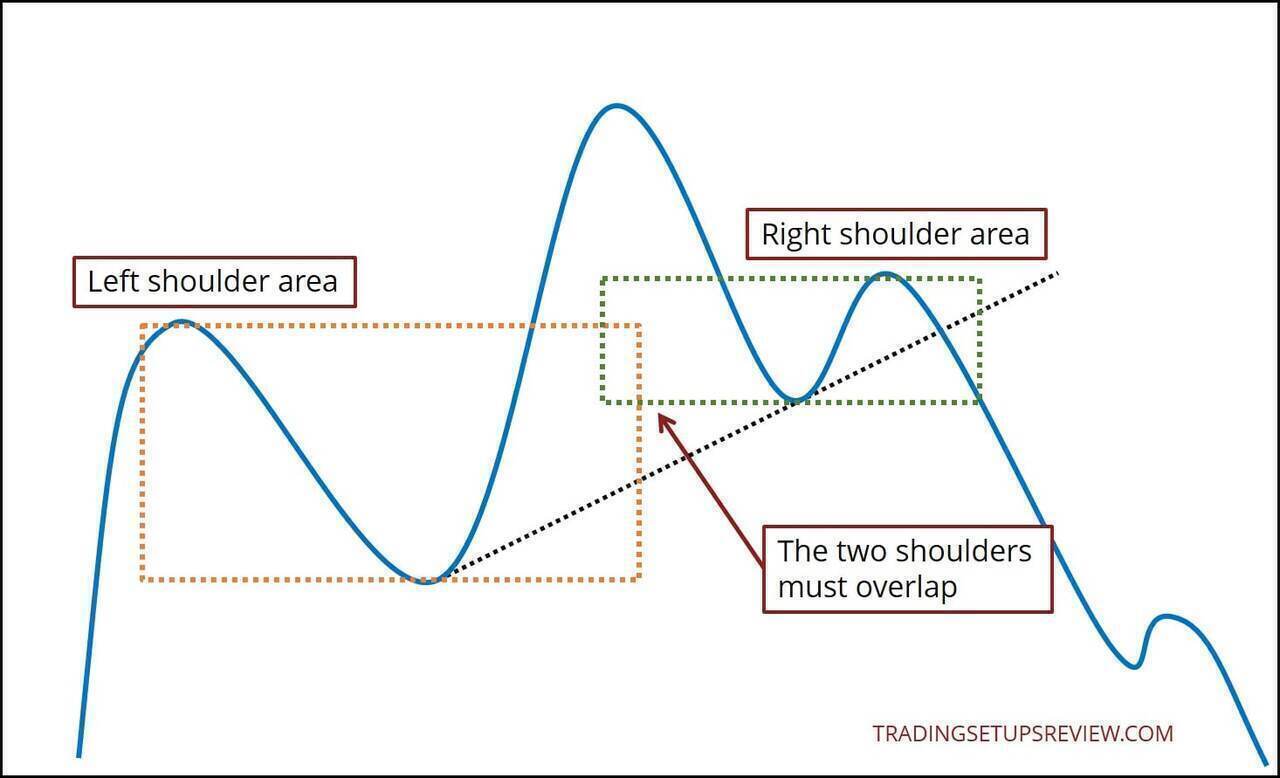
Hence, an efficient way to find head and shoulders is to scan your charts for an outstanding head and overlapping shoulders.
Then, take a closer look to see if they fulfill the pattern criteria above.
#2: Classic Head And Shoulders Trading Rules
The classic head and shoulders pattern triggers a bearish reversal trade. Hence, a current bull trend is necessary.
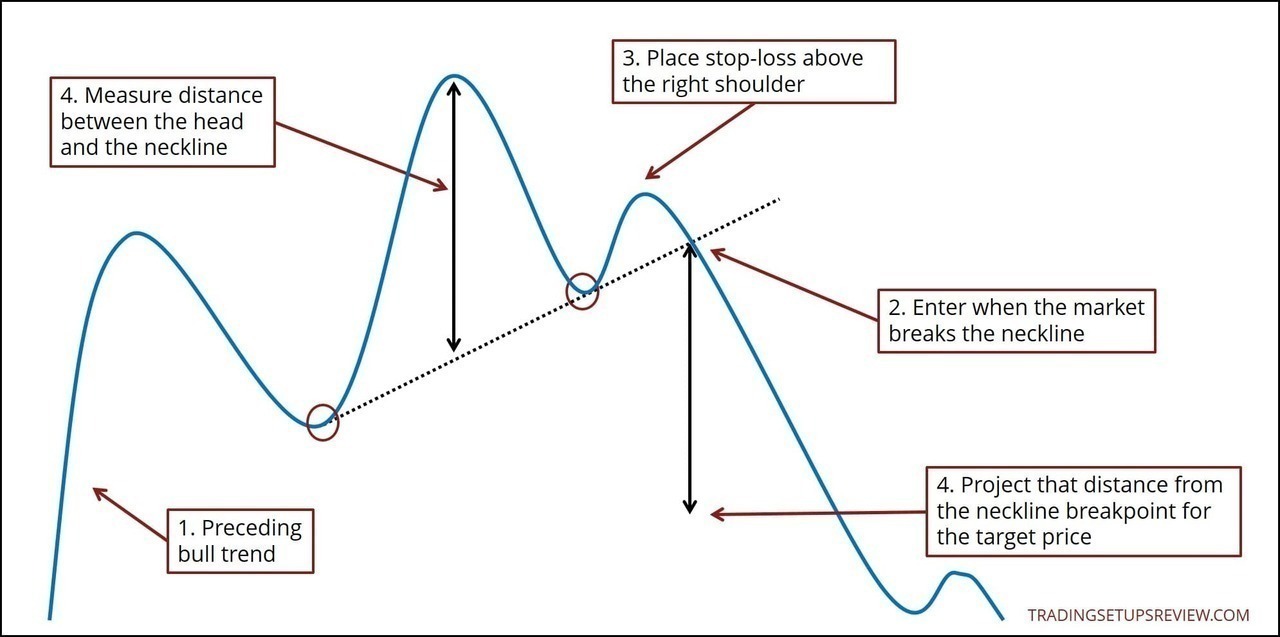
1. Make sure that the market is in an uptrend. (You should have a bull trend line intact.)
2. Enter when price breaks below the neckline.
3. Place your stop-loss above the right shoulder.
4. Measure the distance between the head and the neckline (X).
5. Project the distance (X) down from the neckline. Place your target limit order there.
#3: Head And Shoulders - Why Does It Work?
We will never know the exact reason for why each pattern works.
But it’s useful to think of the pattern formation as a struggle between buyers and sellers.
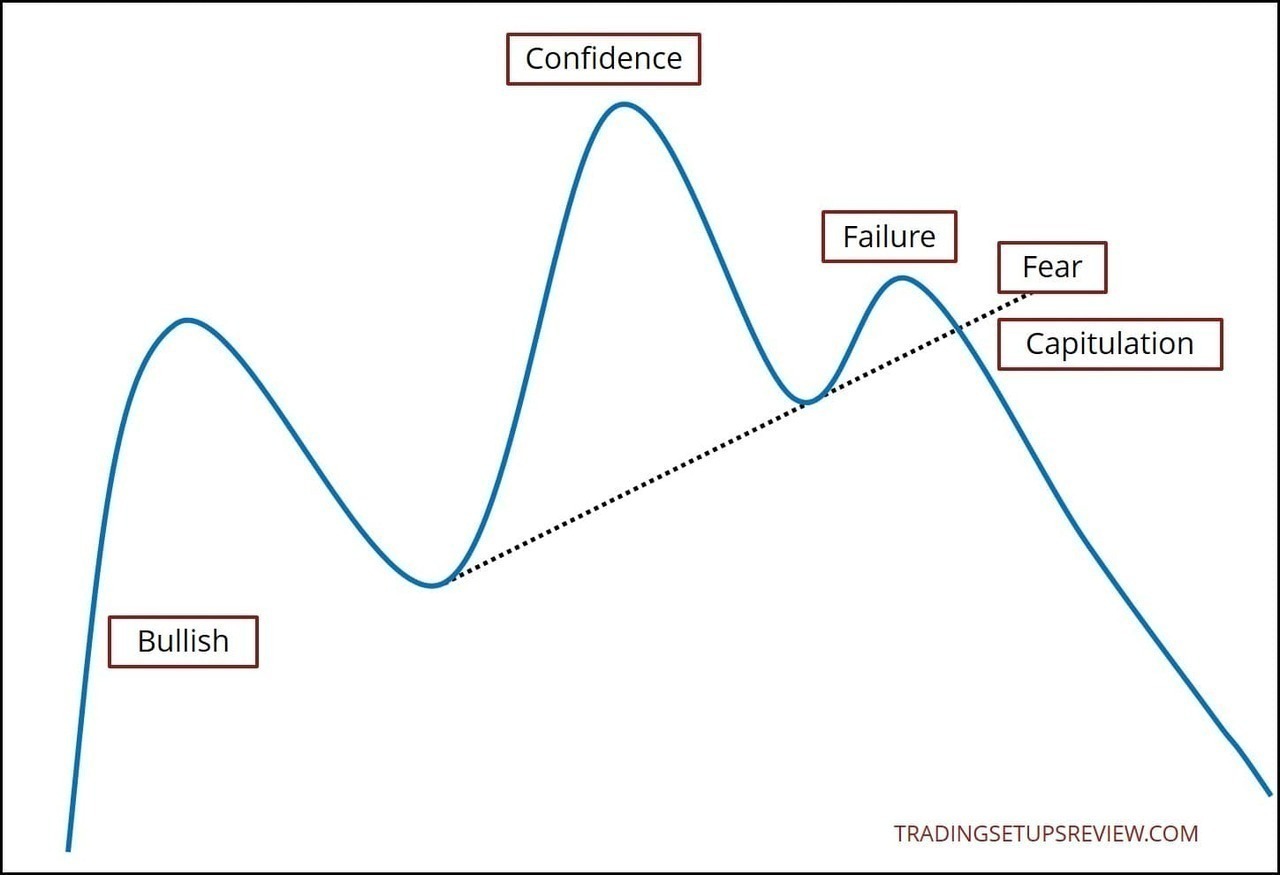
The head is higher than the left shoulder. It empowers the buyers and gives them the confidence to enter the market.
However, when the right shoulder forms, it is lower than the head. It represents the failure of the market to continue the trend upwards.
Of course, this inability to resume the trend is not enough to justify a trade. The buyers are disappointed but have not given up. However, the uncertain buyers get the jitters. They are fearful and become sensitive to the price action that comes next.
In this context, the neckline becomes a critical support level. Its failure will cause the buyers’ fear to swell. They will start selling, and more sellers will join in, causing a market reversal.
#4: Advanced Trading Insights For The Head And Shoulders Pattern
As with every price pattern, there are nuances you can only learn through experience. Hence, from here on, you will see real chart examples, and not the earlier textbook diagrams.
These insights will accelerate your progress. But remember, they are mere guidelines. Apply with discretion.
#4.1: Entry Methods
You should always wait for a neckline break to trigger a position.
Entering earlier might make sense for continuation setups. However, a head and shoulders pattern often targets a significant reversal.
When gunning for a shift in the market bias, an earlier entry is unlikely to compensate for the lower probability. Further confirmation is always helpful.
According to your level of confidence, you can vary your entry trigger. Instead of entering right after the market breaks the neckline, consider these triggers.
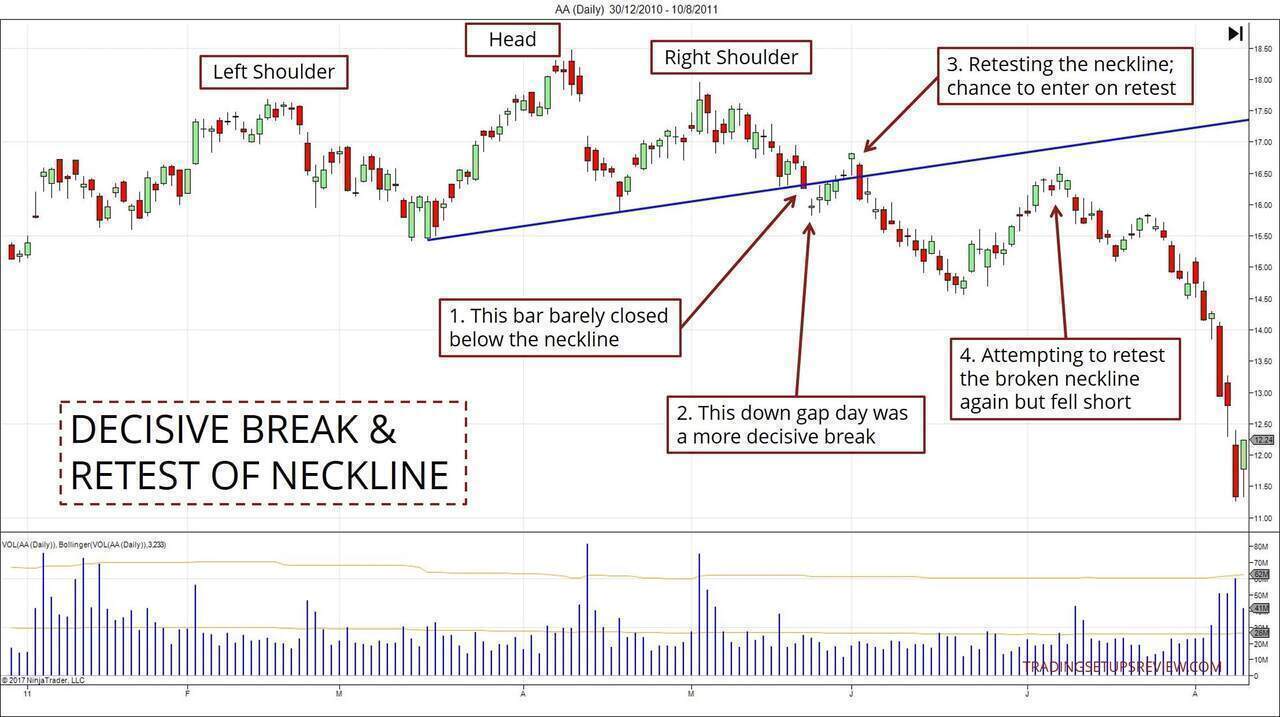
Wait for a decisive break of the neckline. You can look for a price bar close below the neckline to confirm a breakout.
Wait for a retest of the neckline to enter. When the neckline is broken, it flips from support to resistance. Hence, you may go short when the market pulls back to retest the neckline as resistance.
However, many neckline breaks are followed by a sudden fall with no retest. Thus, you must be prepared to miss some of the best head and shoulders setups.
If not, you may consider a half and half strategy. Enter with half of your position size on the breakout of the neckline. Then, if there’s a retest of the neckline, enter the market with the remaining half. This approach ensures that you get on board a runaway plummeting market.
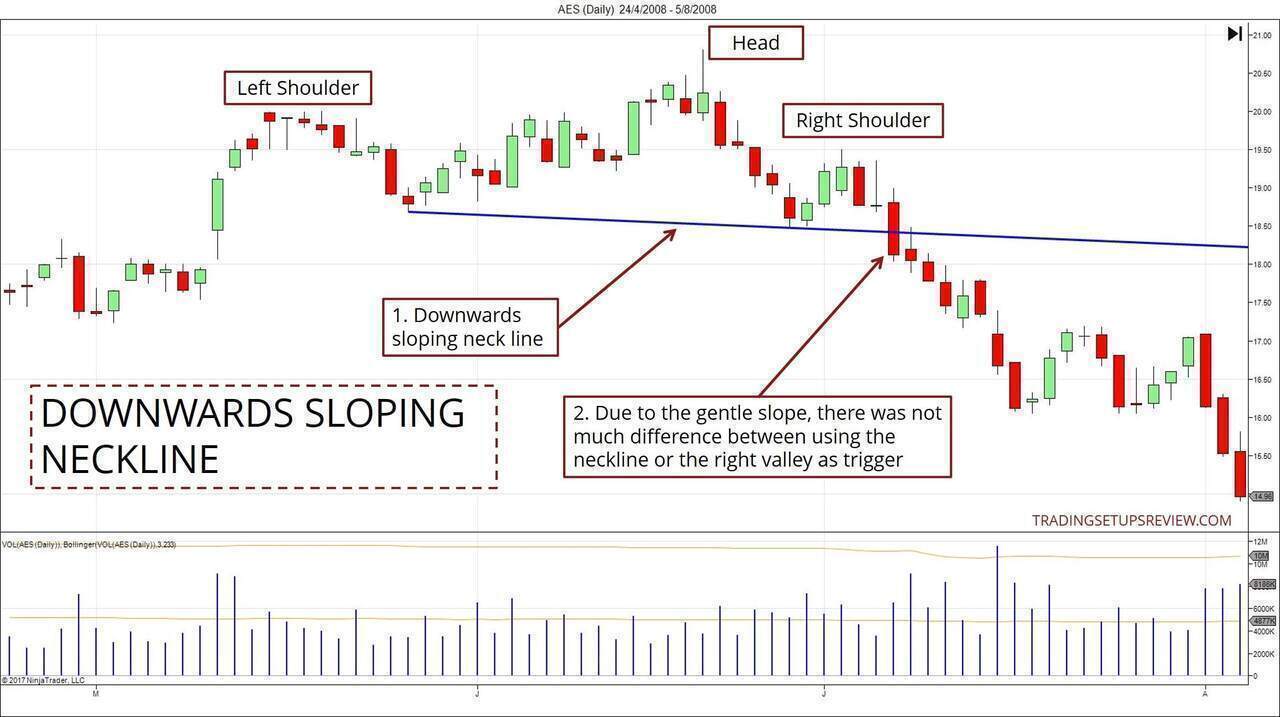
When the neckline is sloping down, it is not an ideal trigger. The market has to fall more before it can break a downward sloping neckline. This implies that it’s offering a delayed entry.
Hence, some traders choose to skip head and shoulders with downwards sloping necklines. I advise doing the same if the neckline has a steep downslope.
For a neckline with a slight downslope, you can trade them if there other supportive factors. In fact, some traders find that the pattern works better when the neckline slope is down.
If you choose to trade them, consider using the right valley as your trigger price.
#4.2: Stop Loss Placement
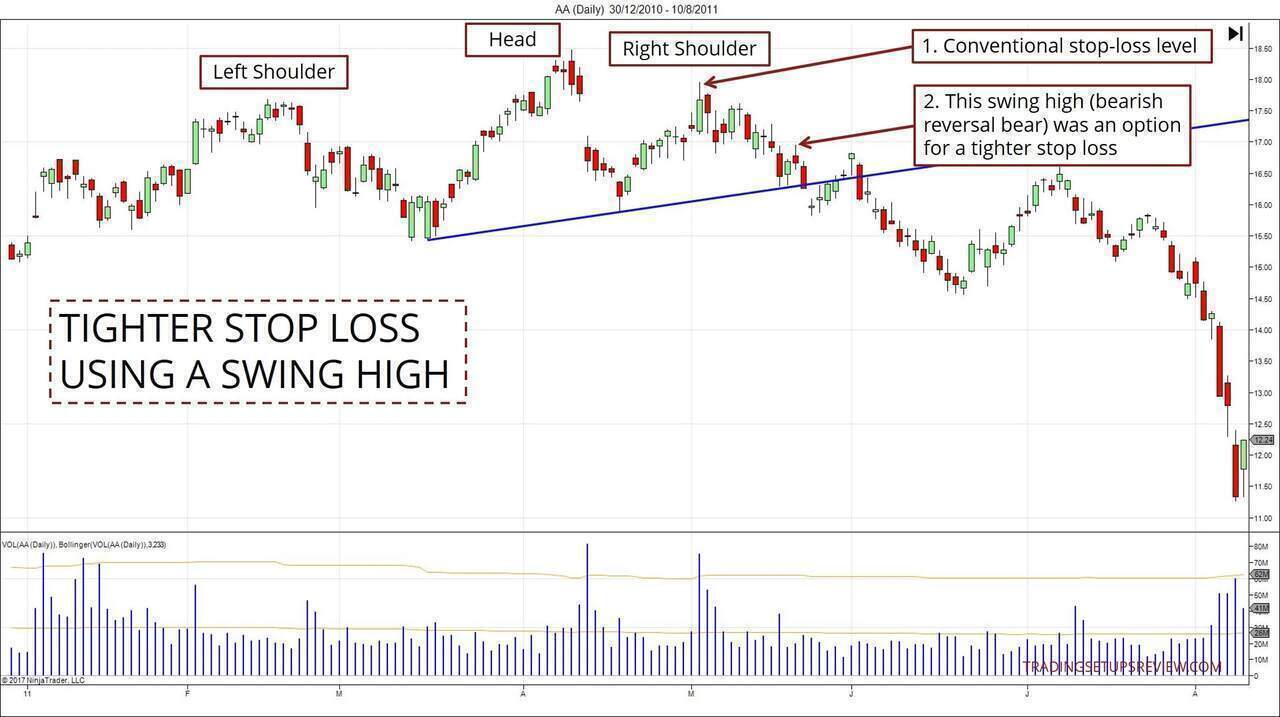
The classic stop loss for a head and shoulders is just above the right shoulder.
However, for many cases, this convention will produce a wide stop.
When the stop loss implied by the right shoulder is too wide, it makes sense to place a tighter stop. At the same time, use a systematic strategy for re-entering the trade.
There are many logical ways for you to tighten the stop-loss order.
You may use a bearish price pattern or a closest swing high to place your stop loss. A volatility stop loss works too.
The example below shows a swing high as an option for a tighter stop loss.
The most aggressive exit strategy is one based on strategy invalidation. When the market closes above the neckline, the pattern is deemed invalid, and the position is closed.
However, this approach might push you out of good trades due to minor whipsaws. Hence, consider a re-entry if the price action is favorable.
#4.3: Target Price
The projected target of a head and shoulders pattern is a theoretical minimum. In practice, treat it as a draft target to work with before integrating other information.
It’s important to look for significant support that might impede the falling momentum. Check if any critical support exists between the head and shoulders pattern and the target. If so, don’t stick stubbornly to the target price.
An equally relevant factor is confluence. This concept refers to the overlap of results from different observations. If the projected target price falls within a support zone, accord greater weight to it.
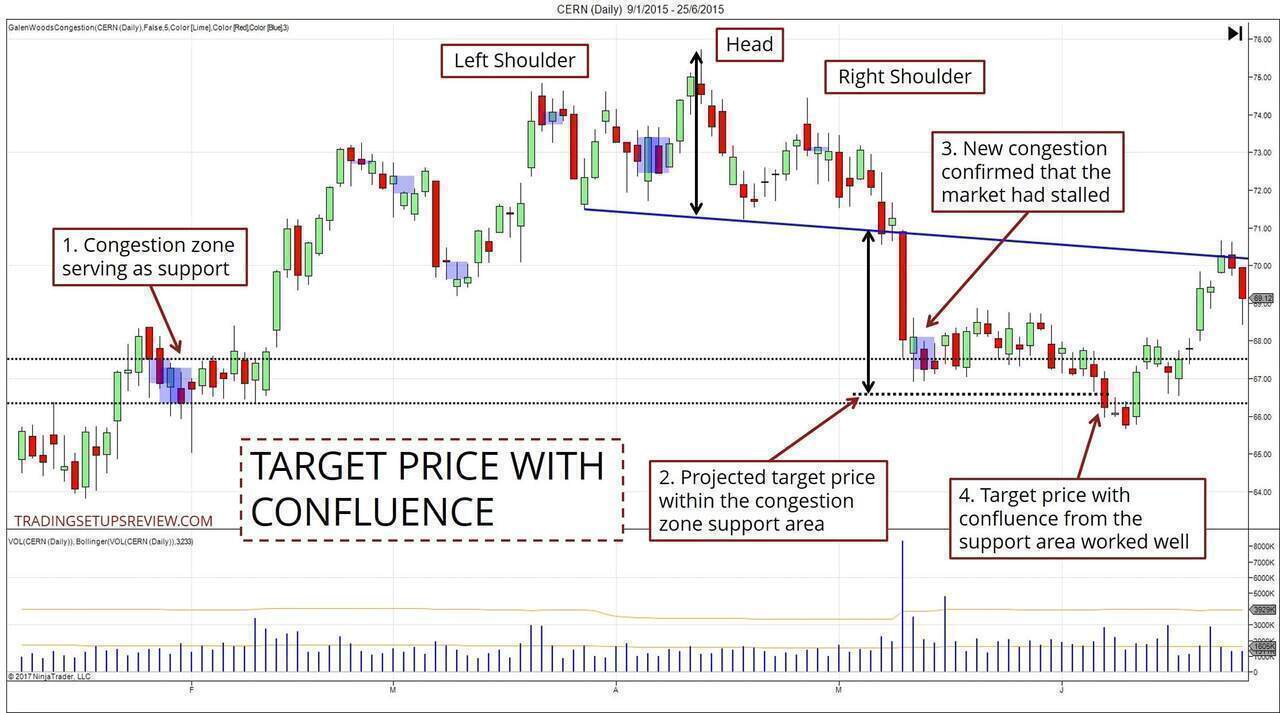
In the example above, the projected target fell within a congestion zone support area. Hence, it was an excellent target for this trade. (Congestion zones are taught in my trading course as a way to identify support and resistance.)
Remember that your target can be fluid. If the market stalls and forms prolonged congestion, you can exit at the market price. You need not wait for your target price to be hit.
#4.4: Volume Considerations
The neckline break should occur with a volume surge. This is a critical factor for high-quality patterns. It works well as a filter to remove low-quality setups.
You can identify the volume surge with a volume overlay or with the help of a volume indicator like the OBV.
In the example below, the volume surge was subtle but meaningful. You do not see a significant one-bar volume spike. Instead, the volume rose steadily as the market fell to break the neckline. This shows that the bears were gaining strength.
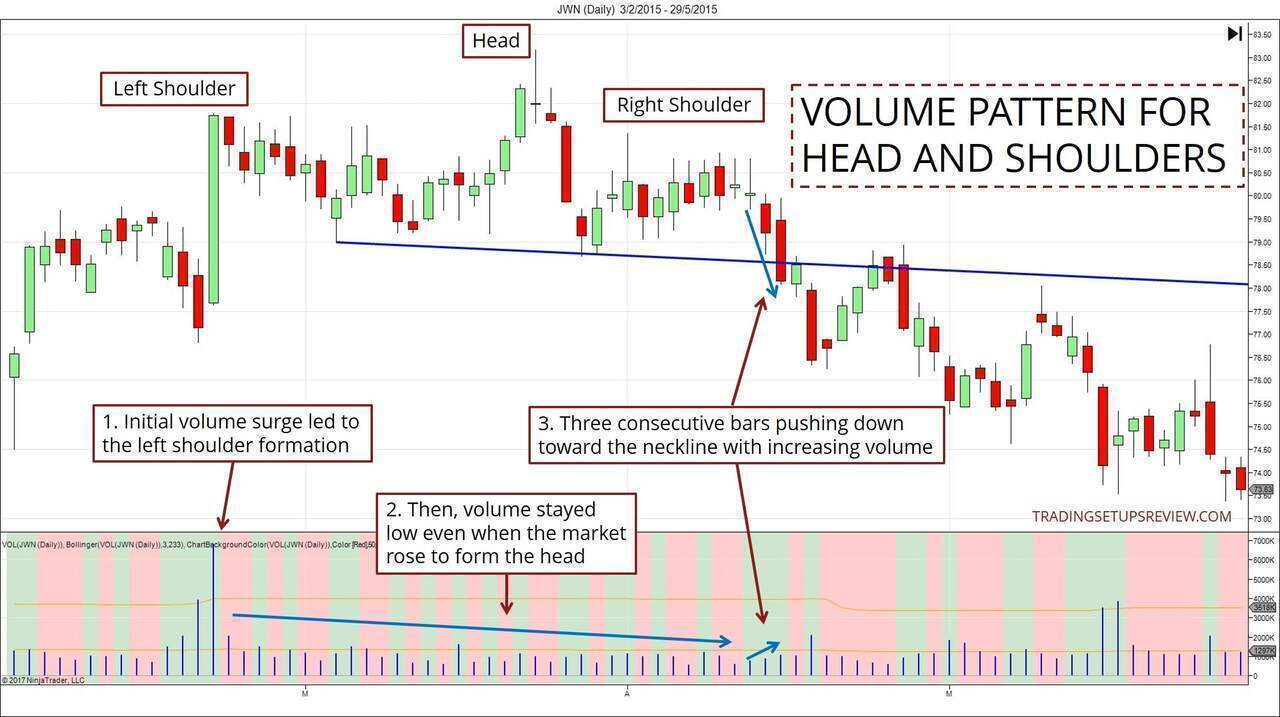
(The bar-on-bar volume changes is highlighted by the Chart Background Color Indicator. Green means increasing volume, and red means decreasing volume.)
The volume pattern before the neckline break is less important than the volume at the neckline break. But it’s still useful to apply the following guidelines in your analysis.
- If the head shows less volume (compared to the left shoulder), it signals a lack of interest in the bullish trend.
- If the head forms with extremely high volume, it might be a sign of exhaustion. (See Anchor Bar and Stopping Volume.)
#4.5: Reversal Trading Tips
Before you think of a reversal trade, you must first find a trend to reverse.
An efficient way to do this is to employ a stock scan. There are two basic scans you can use for this.
- High ADX Values
- X Day Above The X Period EMA (e.g. 50 Days Above The 50 EMA)
With these scans, you can start building a watchlist of bullish stocks. You can then check them periodically to find potential head and shoulders patterns.
As head and shoulders patterns take some time to form, you need not check each chart daily. Frequent reviews are necessary only after the formation of the right valley.
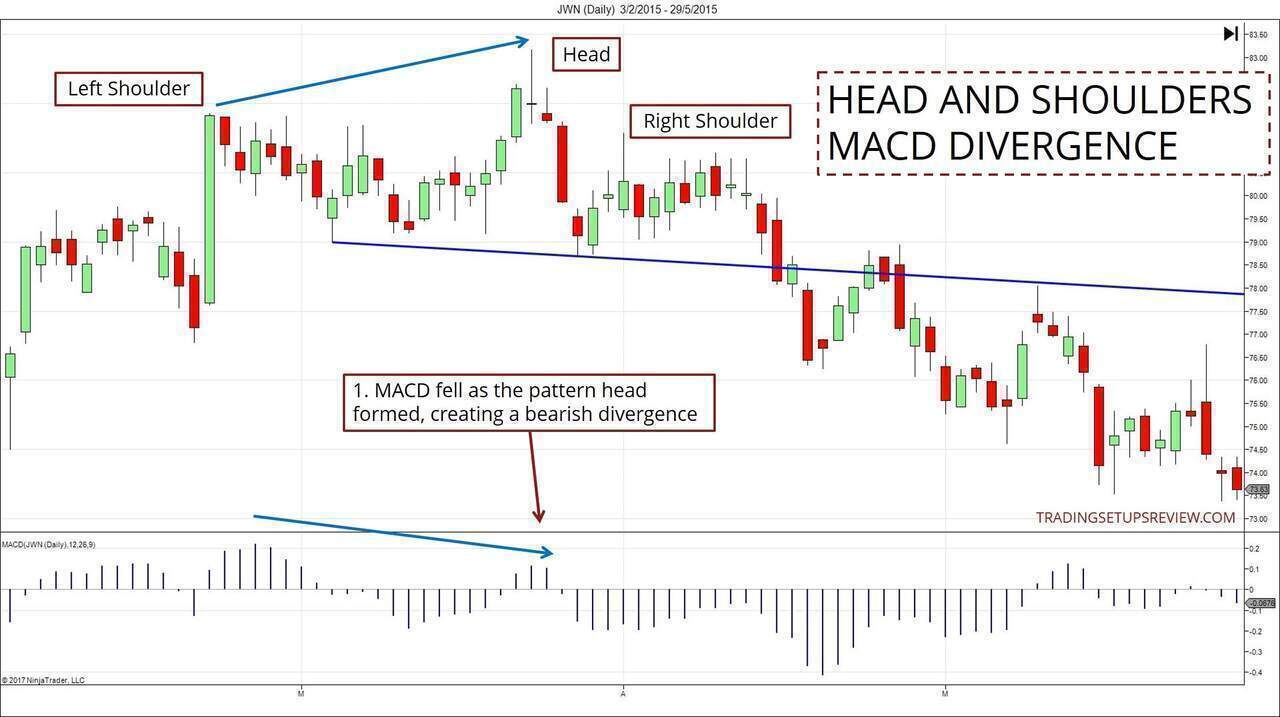
Consider looking for an indicator divergence to confirm the reversal. Bearish divergence and a head and shoulders pattern form a potent reversal recipe.
The example below shows a head and shoulders pattern with a MACD bearish divergence.
Look for markets that had a powerful and swift rise before forming a head and shoulders pattern. The subsequent reversal is likely to be potent as well.
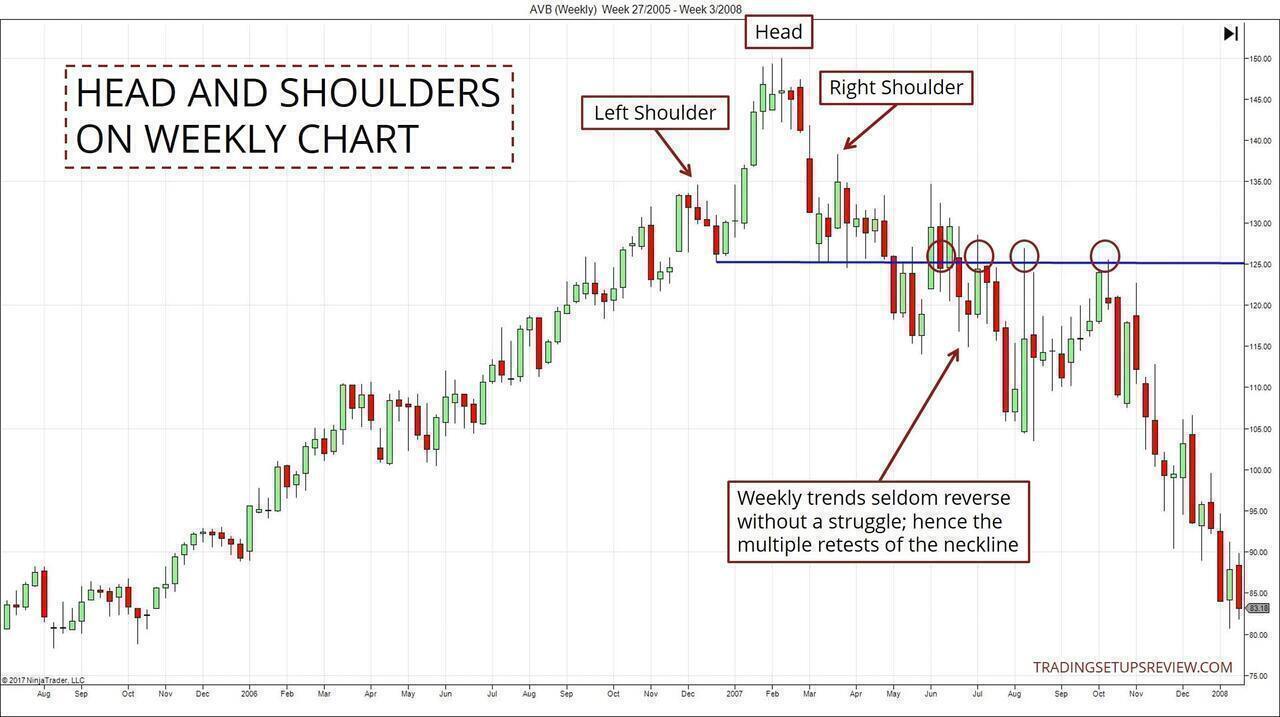
However, a major trend reversal requires a significant head and shoulders pattern. To reverse a strong bull trend, you should look for a head and shoulders pattern that forms over a longer period. In such cases, waiting a few weeks for a pattern to complete is common.
You’ll learn that patience is the key to trading head and shoulders patterns.
#4.6: Continuation Trading Possibility
Head and shoulders is a reversal pattern by convention. But that does not mean that you cannot use it for continuation/pullback trades.
A mini head and shoulders formation is a potential trigger for a pullback trade.
Look at the example below.
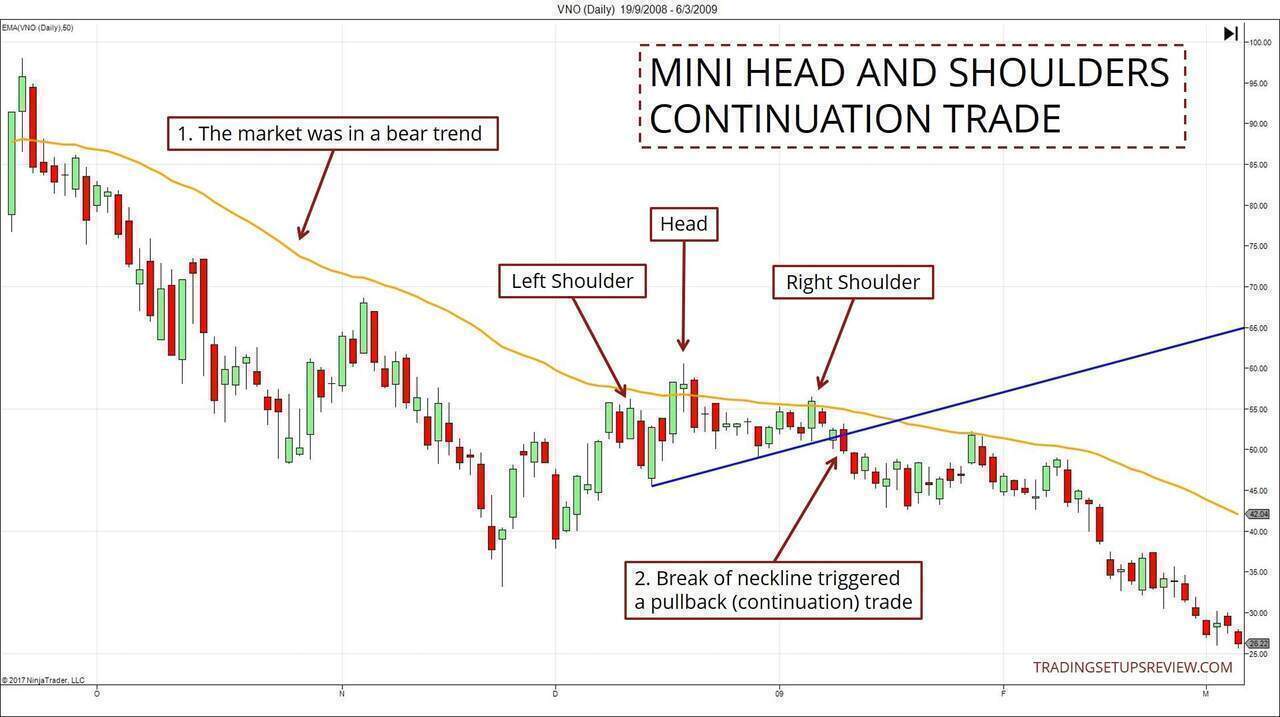
In this example, the market was in a bearish trend. The pullback to the 20-period EMA also formed a small head and shoulders pattern.
Here, the neckline break was the perfect trigger for a bearish pullback trade.
#4.7: Best Pattern Form Guidelines
These are guidelines with regards to how the ideal head and shoulders should look like. While they are helpful when you are choosing among patterns, don’t get obsessed with them. Reading the market context is more important than finding the perfect pattern.
Give more weight to head and shoulders patterns with upsloping necklines.
When the right shoulder is lower than the left shoulder, consider it a sign of greater profit potential.
Some traders get mired in geometry. They think of symmetrical patterns as superior. But according to research by Thomas Bulkowski, “symmetrical looking patterns perform worse.”
Trend Line Interaction
Do you use trend lines to track the market?
If so, pay attention to how the head and shoulders pattern interacts with the trend line.
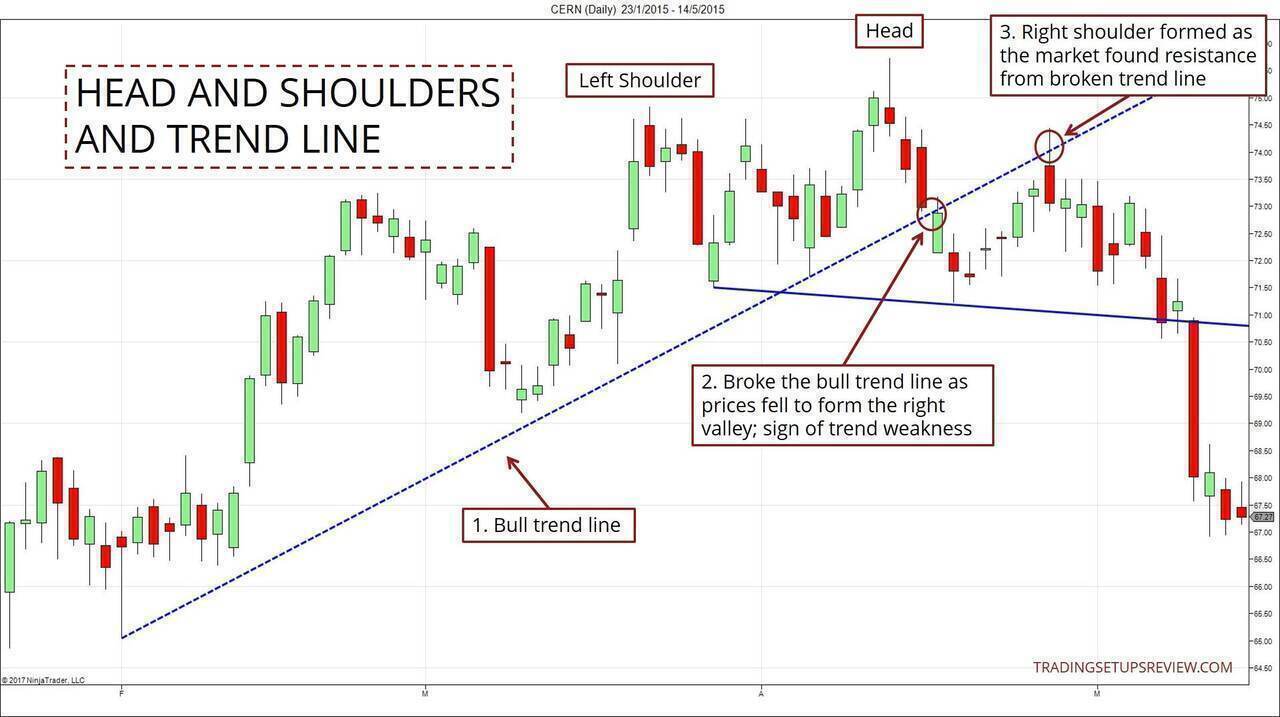
- This is a bull trend line tracking the current trend.
- The right valley broke the trend line, implying that the trend has weakened.
- This retest of the broken bull trend line as resistance led to the formation of the right shoulder.
This example shows that you can confirm the high quality of a head and shoulders pattern with a trend line.
#4.8: Miscellaneous Tips
In theory, chart patterns like the head and shoulders work for traders of all time frames.
But in practice, the most powerful head and shoulders patterns take longer to form. Hence, most traders focus on daily and weekly charts to find head and shoulders.
Note that the bullish version (inverse head and shoulders) takes even longer to form. This is a general observation that applies to bottoming patterns. It takes more time to reverse a falling market.
#5: Head and Shoulders - Potential Pitfalls To Avoid
Don’t get fixated on the label of the head and shoulders pattern. The name of the pattern is not important except for kickstarting your education. You can often interpret the best setups through different patterns and concepts.
(Take a look at the triple top pattern. You’ll see this when the pattern head is so low that it’s close to the two shoulders.)
Recognize that all chart patterns are a combination of swing pivots and trend lines. In the case of the head and shoulders, it’s the combination of three swing highs, two swing lows, and a neckline.
Hence, as you gain experience, define your own rules for identifying swings and chart patterns like the head and shoulders.
(Note to course students: If you look for a tested high to be the right shoulder, it will become a valid high after the neckline break. This will enhance the pattern and give you a basis for drawing a new trend line.)
Define my own rules?
Yes, you can deviate from the classic rules. Just make sure you stay consistent. This is the best way to avoid the confusion that chart patterns present at times.
For this, I think Jim from Trading-Naked got it right. He wrote:
I have received many emails and posts on yahoo groups telling me my pattern is not a Head and Shoulder. Ok, I agree perhaps some are different from traditional definitions. Those that write books on technical analysis have their definitions. I massage those definitions and create my definitions.
After all, you are the one trading your account, not the authors of the technical analysis textbooks.
Don’t feel compelled to trade every head and shoulders pattern you find. Take only the best trades. This advice is especially important for reversal trades. Reversal setups make sense because of their high profit potential. So don’t settle for a setup that has a weak reward-to-risk ratio.
You need not always trade a pattern. You can also use a chart pattern for analysis.
For instance, a well-formed head and shoulders failed to reverse a bullish trend.
What does this failure imply? What does it tell you about the current price action?
Finally, remember that the head and shoulders is just a chart pattern. It is a useful tool, but it does not define the market.
#6: More Resources
- A consistent price action framework to define swings and how you draw trend lines is helpful for analyzing head and shoulders - take a look at my trading course. [COURSE]
- Investopedia video explaining the head and shoulders pattern [VIDEO]
- Some of the examples above show a complex head and shoulders. Learn more here. [WEBSITE]
- Encyclopedia of Chart Patterns [BOOK]
- Visual Guide to Chart Patterns [BOOK]