This website or its third-party tools use cookies which are necessary to its functioning and required to improve your experience. By clicking the consent button, you agree to allow the site to use, collect and/or store cookies.
Please click the consent button to view this website.
I accept
Deny cookies Go Back
  • Price Action Trading Course
  • Trading Setups
  • Topics ↓
    • Price Action Trading
    • Day Trading
    • Trader Development
    • Site Map
  • TSR Trading Guides
  • Resources
    • Udemy Trading Course
    • Trading Books
    • Trading Indicators
    • Forex Tester 4
    • NinjaTrader & Kinetick
  • Member Login

Trading Setups Review

Trading Strategies, Guides, and Articles for Active Technical Traders

You are here: Home / Trading Setups / NR7 Trading Strategy

NR7 Trading Strategy

By Galen Woods in Trading Setups on January 16, 2014

The quiet period before the next explosive market move is like the calm before the storm. NR7 helps us to find the calm so that we can prepare and profit from the impending storm.

NR7 means narrow bar 7. It is a bar that has a smaller range than the six bars before it. It is a range contraction that precedes range expansion.

In our trading strategy, we add a simple trend rule to find low risk trend trades.

Trading Rules – NR7 Trading Strategy

Long Trading Strategy

  1. Past 7 bars are completely above the 20-period EMA
  2. Buy on break of high of NR7 bar

Short Trading Strategy

  1. Past 7 bars are completely below the 20-period EMA
  2. Sell on break of low of NR7 bar

NR7 Trading Examples

Winning Trade – Bearish NR7

NR7 Trading Strategy Winning Trade
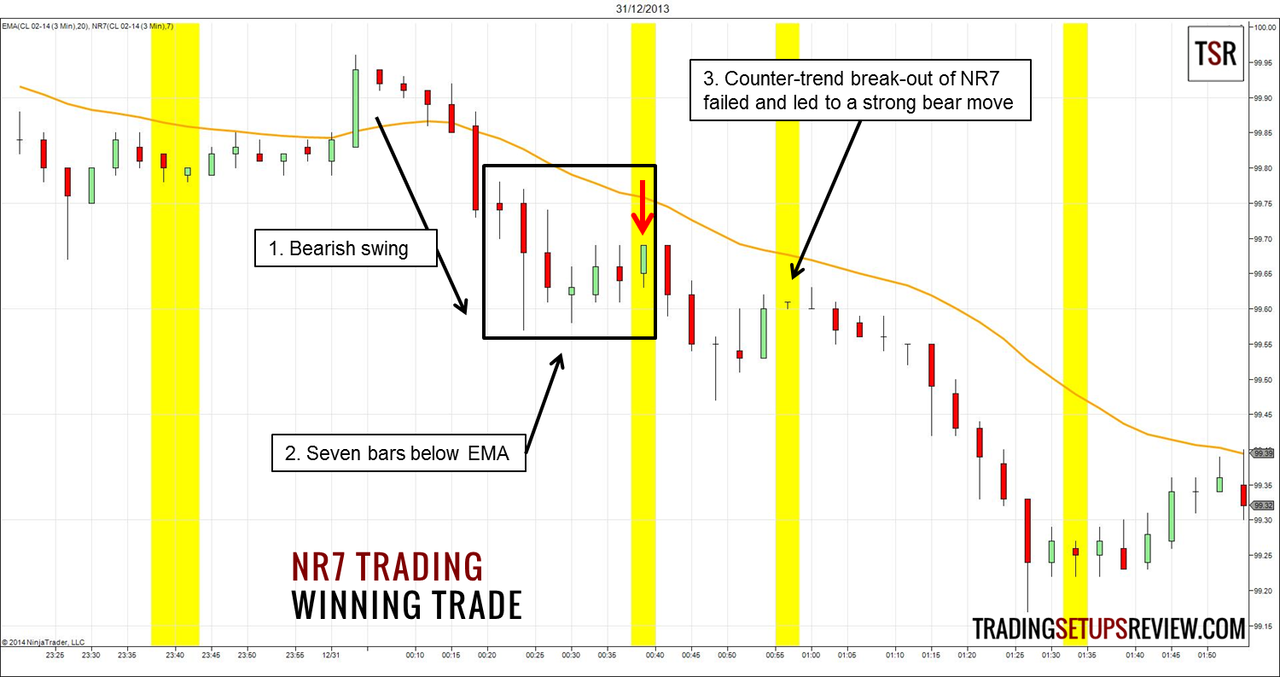
This is a 3-minute chart of CL futures on NYMEX. The orange line is the 20-period EMA. The NR7 bars have a yellow background.

  1. Price swung down from above the EMA with eight consecutive bearish bars.
  2. The seven bars that defined the NR7 bar were all below the EMA, showing that the bearish momentum held up. Although the NR7 bar closed higher than its open, it formed a micro triple top with the two bars before it. After the low of the NR7 bar broke, we went short.
  3. Price came back up to test the break-even level of the trade. However, following a failed bull break-out of the doji NR7, prices plummeted.

The doji NR7 is also a great example to warn us against using NR7 to trade reversals without confirmation from other analysis.

Losing Trade – Bearish NR7

NR7 Trading Strategy Losing Trade
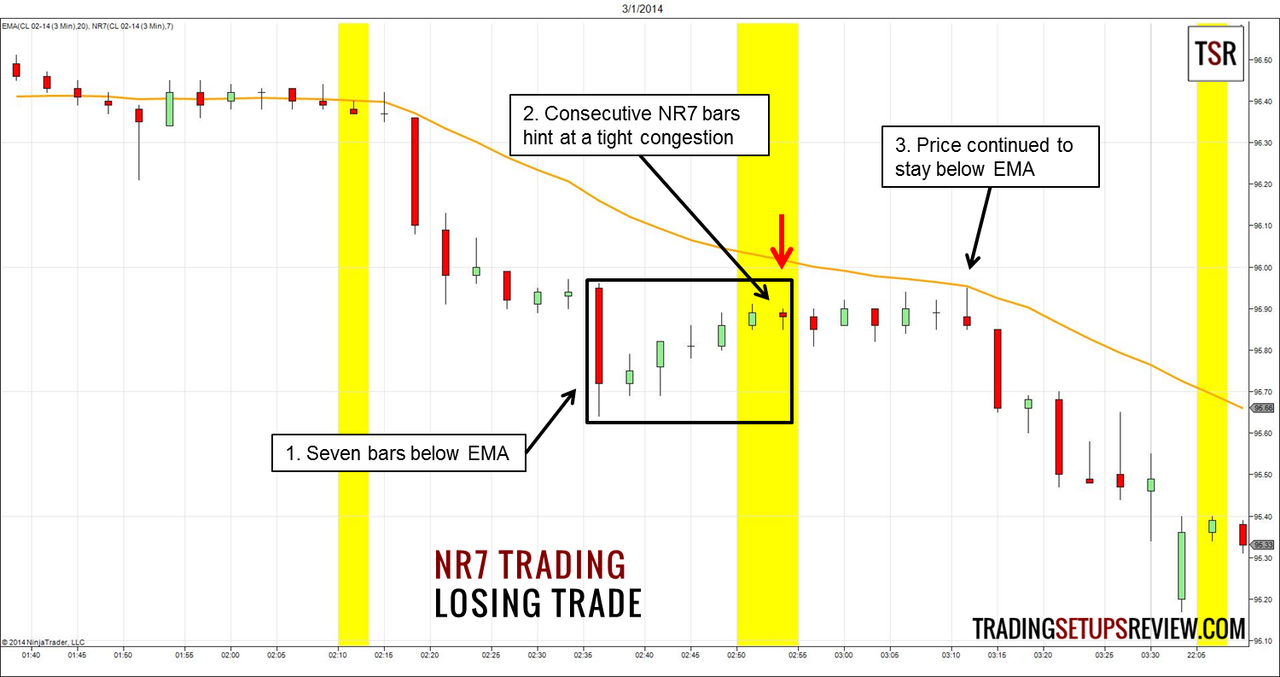
This is another 3-minute chart of CL futures. In this example, the NR7 trade experienced whipsaws.

  1. The seven bars leading up to the NR7 bar were all below the EMA. Despite the four bullish bars in the retracement, price could not reach the EMA.
  2. As price broke the low of the second NR7 bar, we went short. However, the consecutive NR7 bars was a hint of the tight congestion that followed.
  3. Price hit our stop-loss at the high of the NR7 bar. It was a false break-out that reversed and continued the bear trend. Re-entry was a valid option as price stayed below the EMA throughout the retracement and our bearish outlook was not compromised.

Review – NR7 Trading Strategy

Toby Crabel studied the NR7 pattern together with the NR4/ID trading setup. Both patterns are popular trading tools found in many trading strategies.

(Read: Day Trading with Short Term Price Patterns and Opening Range Breakout)

In this NR7 trading strategy, we looked for markets with a strong trend and used NR7 as a low risk entry point to join the trend.

Do not follow the trading rules mechanically. Some NR7 bars appear at the high of a bull trend or the low of a bear trend. These setups are not the target of our trading strategy. Wait for a real pullback to enter.

Be very careful when you see multiple NR7 bars. Narrow range bars in proximity are a sign of price congestion in which NR7 patterns are less reliable.

Remember to follow the path of least resistance. The best NR7 bars occur when price is moving against the path of least resistance.

Read more about Bar Patterns

Serious Traders Only!

Day Trading With Price Action – A complete course that teaches you the art of price action trading.

Perfectly structured with step-by-step guides to help you understand the principles of price action analysis.

Click here for the course syllabus

More From Trading Setups Review

Day Trading For Dummies Book Review

5 Checks Before You Start Day Trading For A Living

Modified Hikkake Price Pattern For Trading Reversals

Trading Course Banner

Comments

  1. Frank says

    March 15, 2018 at 9:28 AM

    Excellent! Could I ask you an off topic question ? How should I intrepret a large bullish candle with a shaven head in an established up trend ( possibly engulfing) that sees a spike in accompanying vol but then proceeds to fail or reverse ? Thank you very much !

    Or possibly Morning Doji Star

    Reply
    • Galen Woods says

      March 15, 2018 at 2:44 PM

      Hi Frank, you’re describing an exhaustion type price move which can take on various forms. Take a look at this article on Anchor Bars.

      Reply
  2. Tosi says

    September 6, 2018 at 1:34 AM

    Could you clarify little more?

    In a downtrend, has to be 6 bars closing lower than 20 MA and the 7th has to be a inside candle and then you buy on 8th bar ?

    Cheers

    Reply
    • Galen Woods says

      September 9, 2018 at 8:39 AM

      No problem!

      First, there must be seven bars completely below the MA. This means that the high of each of these seven bars should be below the MA.

      Next, the 7th bar does not need to be an inside bar. NR7 simply means that the 7th bar has the narrowest range among the most recent 7 bars (including itself).

      Finally, you do buy on the 8th bar, provided that it breaks out of the range of the 7th bar (NR7 bar) in the direction you are trading.

      Reply
      • Shubham phadtare says

        July 13, 2019 at 6:35 PM

        What is the target when we buy the share, I mean how many percent we can achieve from this strategy.

        Reply
        • Galen Woods says

          July 15, 2019 at 6:29 AM

          Hi Shubham, there’s no way to state a percentage as there are too many factors affecting it. For ideas on placing targets for trades, please take a look at this article.

          Reply

Leave a Reply Cancel reply

Your email address will not be published. Required fields are marked *


Search Trading Setups Review

Get a Free Course Chapter from Galen Woods' Day Trading With Price Action Course [PDF]

Plus, our latest trading guides and tips in right your inbox.

Recommended For You

Flipping Support and Resistance for Swing Trading

4 Trading Myths About The Moving Average

4 Effective Ways to Trade a Channel

The Best Day Trading Strategy For Beginners

The Logical Trader’s Guide To Setting Stop-Losses

10 Price Action Candlestick Patterns You Must Know

Looking Inside the Inside Bar for Day Trading

Trading Course Banner

Trading Setups Review

  • About Us
  • Contact Us
  • Advertise With Us
  • Privacy Policy
  • Affiliate Disclaimer
  • Full Risk Disclosure

Learn More

  • Day Trading With Price Action Course
  • TSR Trading Guides
  • Trading Setups
  • Trading Articles
  • Trading Books
  • Site Map

Futures and forex trading contains substantial risk and is not for every investor. An investor could potentially lose all or more than the initial investment. Risk capital is money that can be lost without jeopardizing ones financial security or life style. Only risk capital should be used for trading and only those with sufficient risk capital should consider trading. Past performance is not necessarily indicative of future results.


The website contents are only for educational purposes. All trades are random examples selected to present the trading setups and are not real trades. All trademarks belong to their respective owners. We are not registered with any regulating body that allows us to give financial and investment advice.


Trading Setups Review © 2012–2021