John Hill's Trend Line Theory - Using Trend Lines for Trading Pullbacks
By Galen Woods ‐ 5 min read
Trend lines are potent trading tools that can help you pinpoint setups. John Hill's Trend Line Theory gives you a framework to apply trend lines for profit.
Trend lines are amazing trading tools. Even traders who swear off indicators draw trend lines. Seasoned traders can see how price action interact with trend lines without drawing them. If you want to join their ranks, John Hill’s Trend Line Theory is an excellent place to start.
John Hill is a co-author of Ultimate Trading Guide, an excellent trading book. The Yum-Yum Continuation Pattern I reviewed earlier is found in this book. John Hill has another lesser known book called Scientific Interpretation of Bar Charts. It is a concise manual with a chapter devoted to trading with trend lines - Trend Line Theory.
In the Trend Line Theory chapter, John Hill introduced a variety of trend line breakout setups. The basic idea is to find if each breakout is valid by considering :
- Trend
- Number of pullback swings
- Relative swing length
- Swing retracement percentage
Trend Lines and Pullbacks
In this review, let’s look at an elegant use of trend lines to find pullback trades found in the Trend Line Theory.
In general, the weaker the pullback, the more likely for a trend to resume. This means that a weak pullback is worth risking our precious trading capital. On the other hand, a strong pullback is a clue that the market might reverse soon. Pullback traders should hold their reins.
With two simple trend lines, you can observe the strength of complex pullbacks. (What is complex? At least a three-legged pullback).
Trading Rules - Trend Line Theory (Pullback)
First, you need to learn how to draw the 0-2 and 0-4 lines. In a bull trend, point 0 is the extreme high of the trend. It is the point where the pullback downwards begin.
- Refer to the diagram below and start by labeling the points 0 to 4.
- Then, connect point 0 to point 2. That’s your 0-2 line (in green).
- Now, connect point 0 to point 4 for your 0-4 line (in red).
The crux of our evaluation lies in which the relative slope of the two lines.
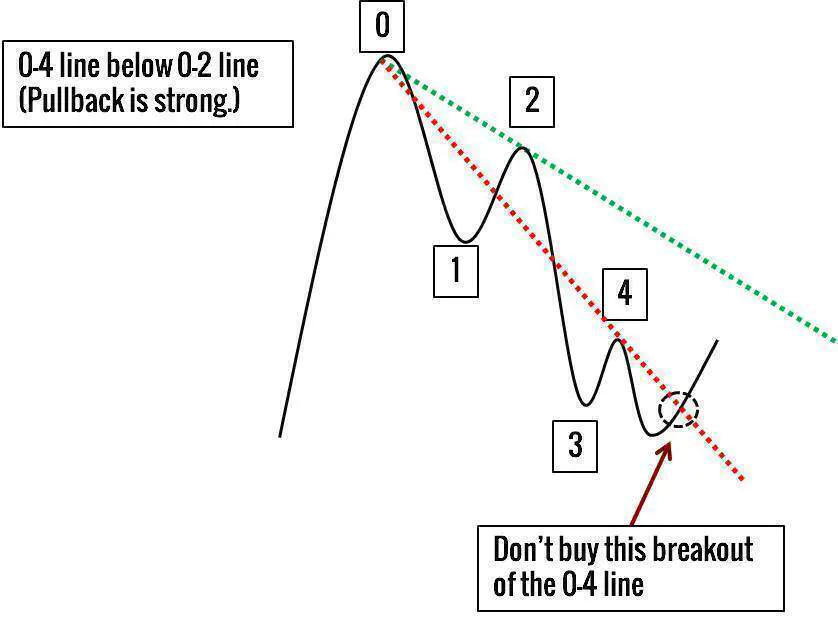
If the 0-4 line is steeper, the pullback has power. Avoid trading this pullback.
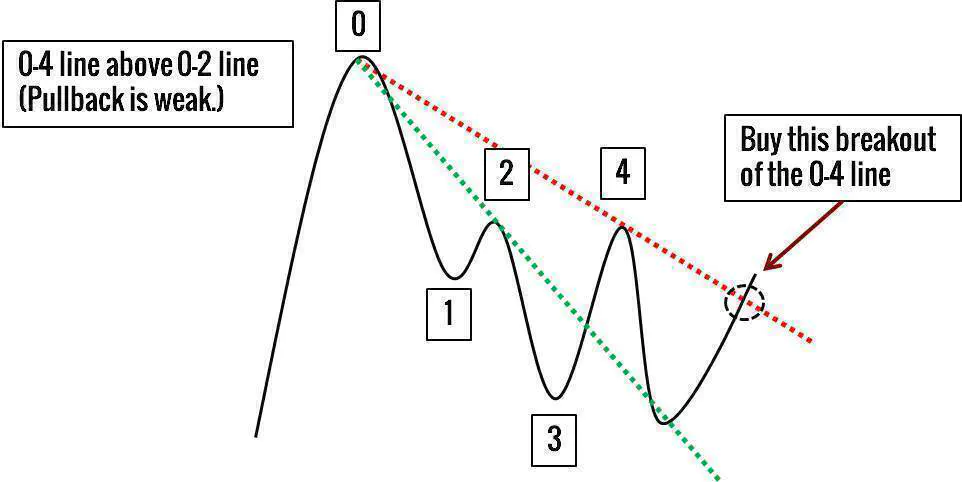
If the 0-2 line is steeper, the pullback lacks strength, consider trading this pullback.
The examples above show a bullish market. You can apply the same logic to bearish markets. Go through an exercise to draw the equivalent diagram for a bearish trend. (Check your conclusion against the trading rules below.)
Long Pullback Trade
- Bull trend
- 0-4 line is higher than 0-2 line
- Buy on bullish breakout of 0-4 line
Short Pullback Trade
- Bear trend
- 0-4 line is lower than 0-2 line
- Sell on bearish breakout of 0-4 line
The setup rules might be a little confusing at first. Just focus on the 0-4 line.
- For a long pullback trade in a bull trend, the 0-4 line should be higher.
- For a short pullback trade in a bear trend, the 0-4 line should be lower.
Trading Examples - Trend Line Theory (Pullback)
As we expect to trade deeper pullbacks here, an intermediate indicator period is suitable. Hence, in the examples below, I used the 50-period SMA (orange) to check the trend.
I have also marked the price swings in blue to highlight the anchors of each trend line.
Winning Trade - MCD
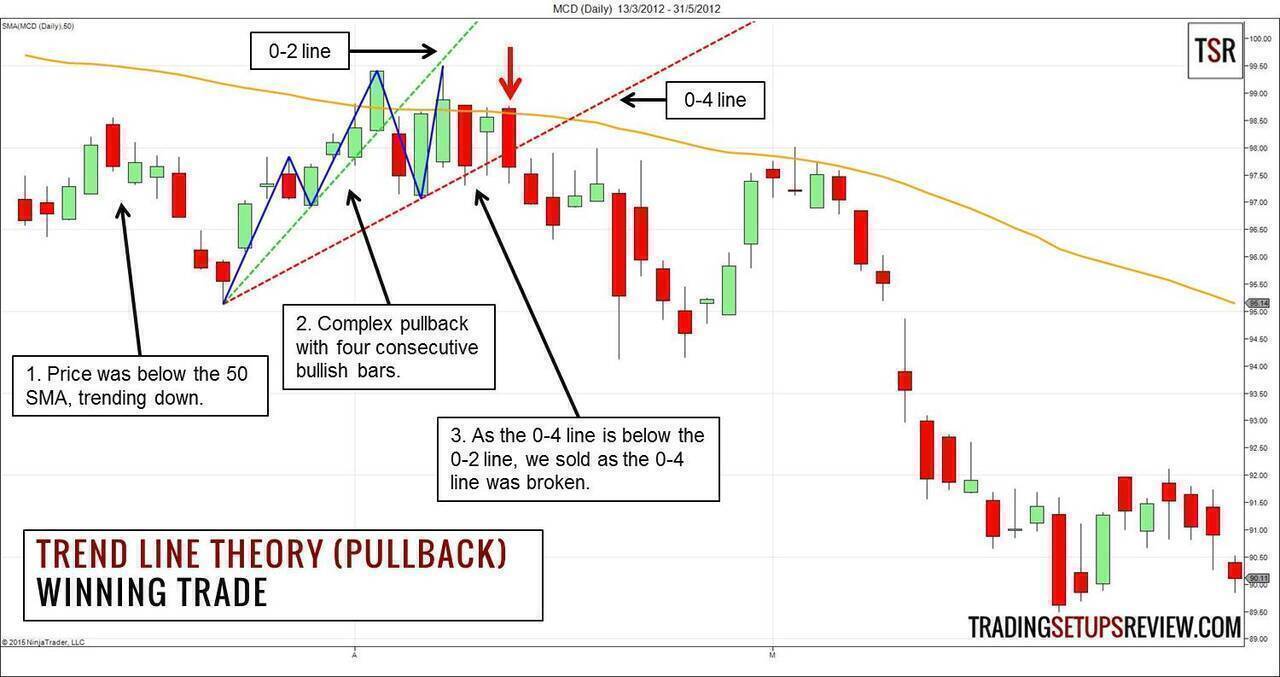
This is a daily chart of McDonald’s Corporation (MCD).
- MCD was below its 50-period SMA, trending downwards.
- Price started to pullback upwards. In the second leg up, there were four consecutive bull bars, a sign of strength.
- However, the trend line analysis produces a different conclusion. The 0-4 line was lower. This meant that, despite the upwards thrust, the bears were growing stronger. Moreover, there was resistance from the SMA. Hence, we sold as price broke below the 0-4 line.
MCD continued the downwards trend, and the short position was profitable.
Losing Trade - XOM
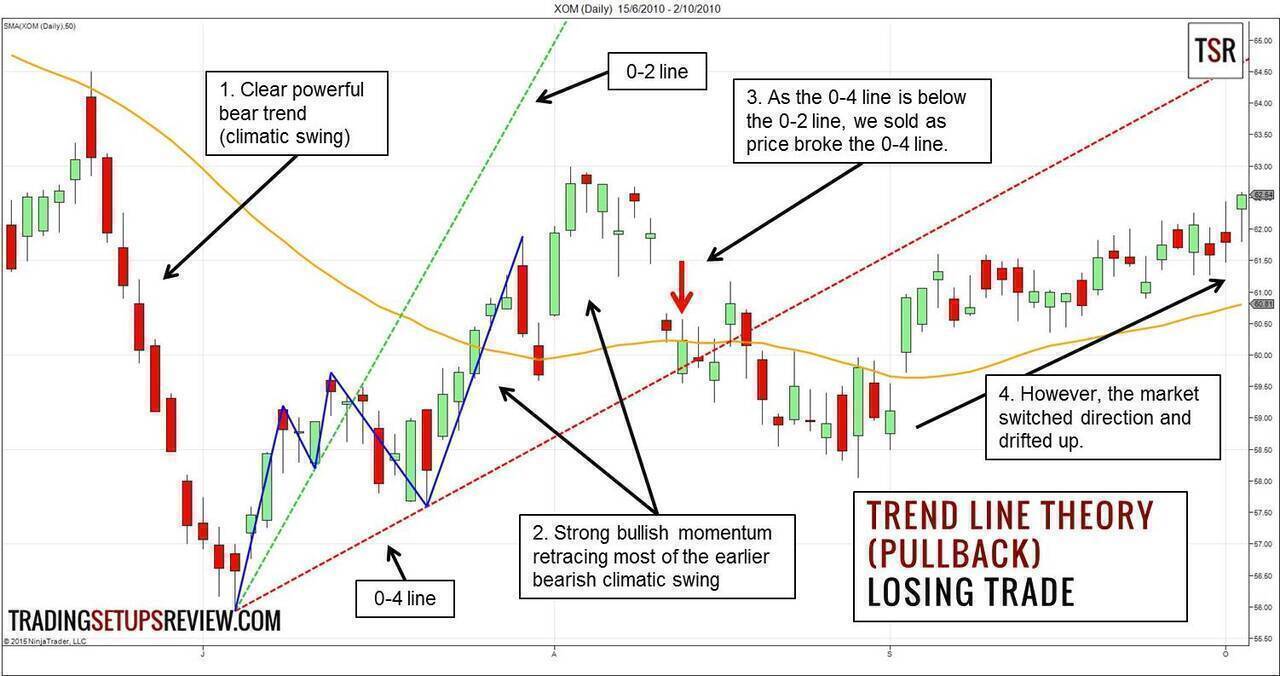
This is a daily chart of Exxon Mobil Corporation (XOM).
- XOM was in free fall after a pullback to the 50-period EMA.
- This pullback showed many strong bullish trend bars and great momentum. Moreover, it cancelled most of the earlier bear swing.
- As the 0-4 line was below the 0-2 line, the market prompted a short entry when it broke the 0-4 line.
- However, instead of continuing to fall, prices drifted up after some meandering.
In this losing example, the deep retracement of the pullback was a clear warning sign. When pullbacks go too deep, it might be a reversal in disguise.
Review - Trend Line Theory (Pullback)
I’m impressed by this strategy. This is a clever way of using trend lines. Pay attention to the trend context, and you have a reliable pullback setup.
This setup goes beyond using trend lines for judging market bias or simple breakouts. It combines two trend lines (0-2 and 0-4 lines) to judge the strength of a pullback.
Trend lines hang on swing pivots. A point of confusion is that there are many ways to mark swing pivots. These different methods affect the slope of the resultant trend lines.
In the examples above, I used what I call basic pivots in my course. Of course, it’s not the only method. Any method of marking minor pivots will do, but stay consistent.
A safer entry method is to wait for a confirmed trend line break. It means waiting for a bar to close below (or above) the trend line. But this could cause you to miss (or get in late for) the most profitable and swift breaks.
In all, John Hill’s Scientific Interpretation of Bar Charts has many intriguing price action ideas like this one. It is definitely a book worth studying in detail for all price action traders.