Improved Three Bar Pullback Pattern
By Galen Woods ‐ 8 min read
Learn how to improve a basic three bar pullback pattern to find high probability trend trades that work well for both swing trades and position trading.
Trading pullbacks are very popular among price action traders. However, while pullback trading is a simple concept, you’ll find many different strategies due to the myriad ways to qualify trends and pullbacks. This article will examine one of the simplest methods to identify a pullback using only price action: the three-bar pullback.
In the Futures & Options Trader magazine (August 2008), Lee Leibfarth suggested improvements to the three-bar pullback pattern. (Active Trader has replaced The Futures & Options Trader magazine. Active Trader itself has ceased operations.)
Here, we are using his variant of the three-bar pullback as a starting point.
Trading Rules - Improved Three-Bar Pullback Pattern
In this strategy, Lee Leibfarth used the TRIX indicator to define the trend.
The TRIX is an exciting indicator that goes beyond a triple-smoothed exponential moving average (EMA) to create an oscillator-type indicator.
The TRIX line displays the rate of change (slope) of a triple-smoothed EMA and adds a signal line to interpret its movement. The signal line is an EMA of the TRIX series.
TRIX Parameters
When setting up the TRIX, you need two parameters: the lookback period and the signal line period.
These are our settings:
- Lookback Period: 9
- Signal Line Period: 3
Long Entry
- The 9-period TRIX is above its signal line, indicating a bullish bias.
- Three-bar pullback down (three consecutive bars that closed down, i.e., three red bars)
- Place a buy stop order just above the last bar of the three-bar pullback pattern.
Short Entry
- The 9-period TRIX is below its signal line, indicating a bearish bias.
- Three-bar pullback up (three consecutive bars that closed up, i.e., three green bars)
- Place a sell stop order just below the last bar of the three-bar pullback pattern.
If you are looking for a tool to identify three-bar pullback patterns, refer to the section below - More Resources.
Three Bar Pullback Pattern Trade Examples
Within this section, you’ll find four examples.
- In the first two examples, we will follow the trading rules above strictly.
- In the third example, we will explore alternative entries using price patterns.
- Finally, in the last example, we will take advantage of TRIX divergence to clue us into a trade.
In the charts below, the lower panel shows the TRIX indicator, which displays the TRIX line in black, and its signal line in red.
Example #1: Winning Trade - Bullish Pattern
This is a daily chart of Apple Inc (AAPL on NYSE).
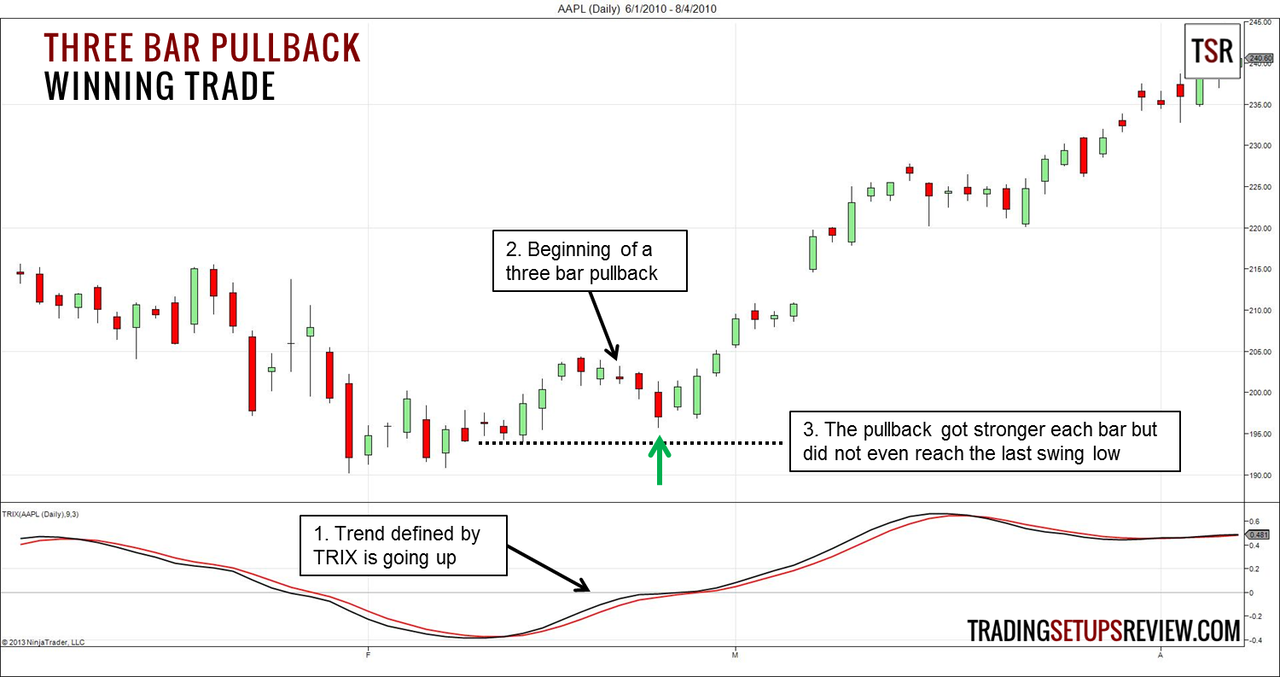
- The black TRIX rose above its red signal line and presented an upwards trend.
- Shortly after, we observed a three-bar pullback pattern that pushed the market downwards.
- The first bar of the pattern was a doji. The following bar had a larger body, and the last bar was a decent bear trend bar. Each bar in the pullback was more robust than the one before it, suggesting a climactic move. However, the market did not even reach the last swing low (dotted line) despite the strong thrust. This was a bullish sign for traders who considered the context. (Also, note that the TRIX remained bullish throughout the pullback.)
Based on our trading rules, we would have bought on breakout of the high of the pattern’s last bar. Here, we got lucky and caught the first pullback of a new bull trend. The TRIX also worked pretty well for taking profits.
Example #2: Losing Trade - Bullish Pattern
This example shows a daily chart of the S&P exchange-traded fund (SPY on NYSE Arca).
In Lee Leibfarth’s article, he tested this strategy on the daily S&P E-mini futures, and the results were encouraging. However, in this example, we will discuss a less ideal setup.
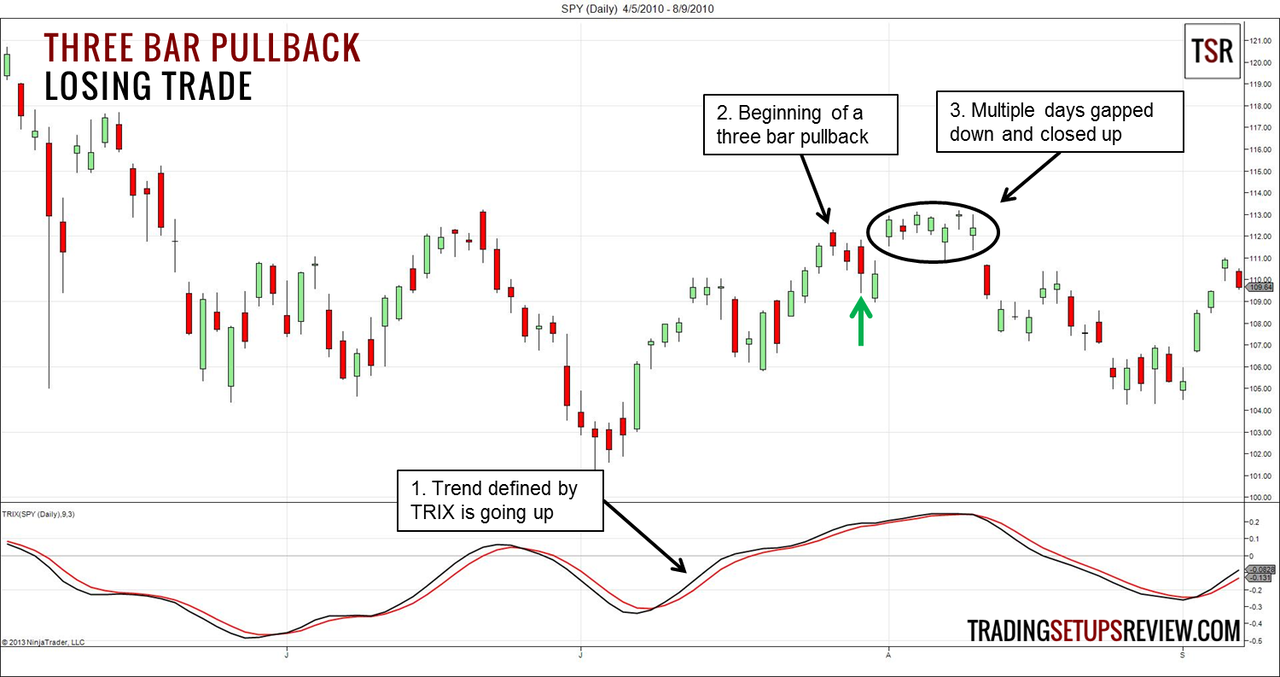
- The TRIX moved above its signal line to define a bullish trend.
- We got a three-bar pullback down. The last bar was an outside bar, and we placed a buy stop order just above it. As prices gapped up two days later, the market triggered our buy stop order.
- After our entry, there were several days that gapped down but closed up. Taken in isolation, these days were bullish. However, the market did not follow through with bullishness after several days. Eventually, it became clear that the market was moving sideways, and the trend did not resume.
The meandering price action after our entry could have prompted us to scratch the trade earlier. Unfortunately, this means that even the best outcome for this trade was around break-even.
Example #3: Alternative Entries
In this example, we’ll look at separating our entry trigger from the three-bar pullback pattern.
While the three-bar pullback still acts as a way to qualify our pullback, our exact entry trigger need not depend on it. As long as a three-bar pullback has formed, we can use any valid reversal price pattern as our market entry trigger.
This chart comes from the EURUSD spot forex market. It shows two trades, one in each direction.
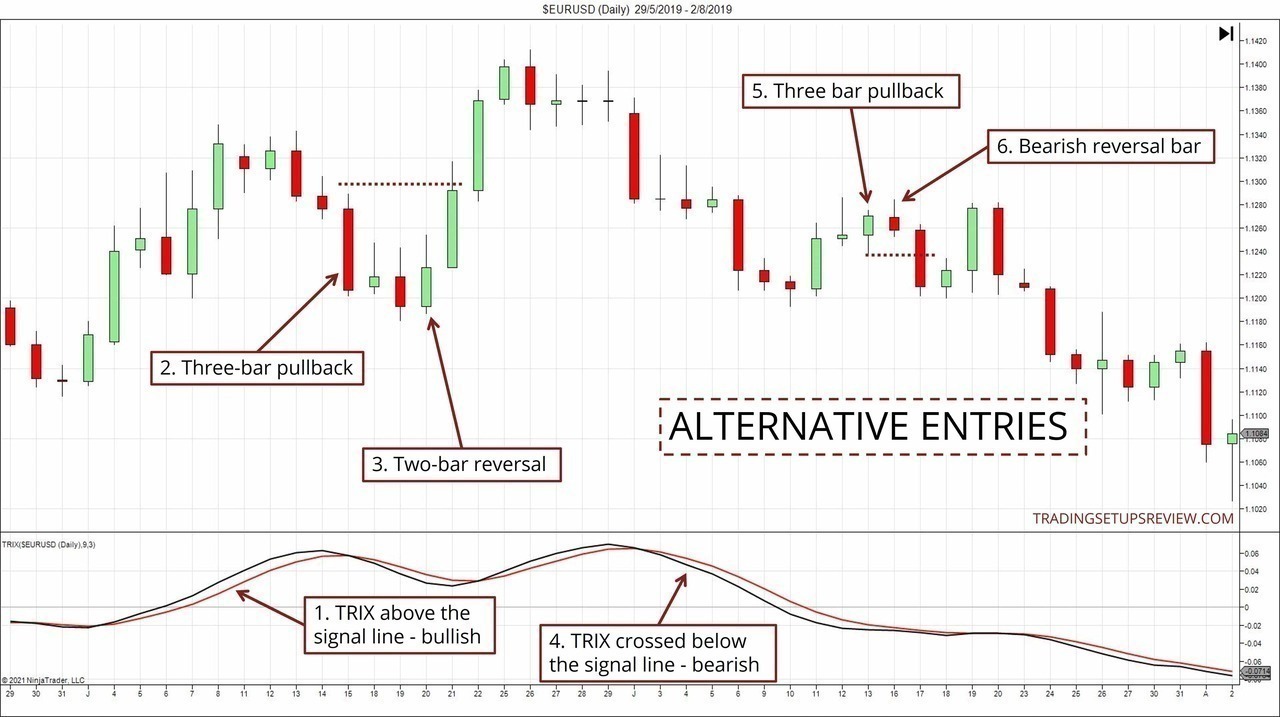
- The TRIX line moved up and away from its signal line, highlighting a bullish trend.
- This three-bar pullback was apparent, and we would place a buy stop order above the high of the last bar (dotted line). As the pullback pattern concluded, the TRIX came very close to turning bearish but did not. Hence, the setup was still technically valid, although a more conservative trader could have skipped this trade.
- This bullish two-bar reversal offered a solid alternative trigger with a better entry price. (However, the TRIX was bearish at this point, and skipping this setup was a reasonable option.)
- Let’s now look at the second half of the chart. Here, the TRIX line crossed below its signal line, suggesting a bearish bias.
- This series of three bullish candlesticks produced a three-bar pullback pattern. The standard entry would be the low of the last bar in the pattern. (dotted line)
- For this setup, a bearish reversal bar offered a slightly better entry.
Very often, there will be opportunities to enter using price patterns following a three-bar pullback. To evaluate these options, consider secondary factors like:
- In the long entry above (Point #3), the two-bar reversal formed at the low of an earlier bullish outside bar, which was a possible support level. Hence, it looked good.
- On the other hand, in the later short entry (Point #6), the bearish reversal bar was part of a Congestion Zone and did not look as good for an entry trigger. (Note the adverse movement as the market rose to test our entry price before resuming its fall.)
Example #4: TRIX Divergence
As mentioned earlier, TRIX is an oscillator that is useful for determining short-term trends with our parameters.
Being an oscillator, it is not surprising that, at times, the TRIX diverges from price action. Thus, standard interpretation for divergences applies.
This chart shows the daily candlesticks of Citigroup Inc. (C on NYSE).
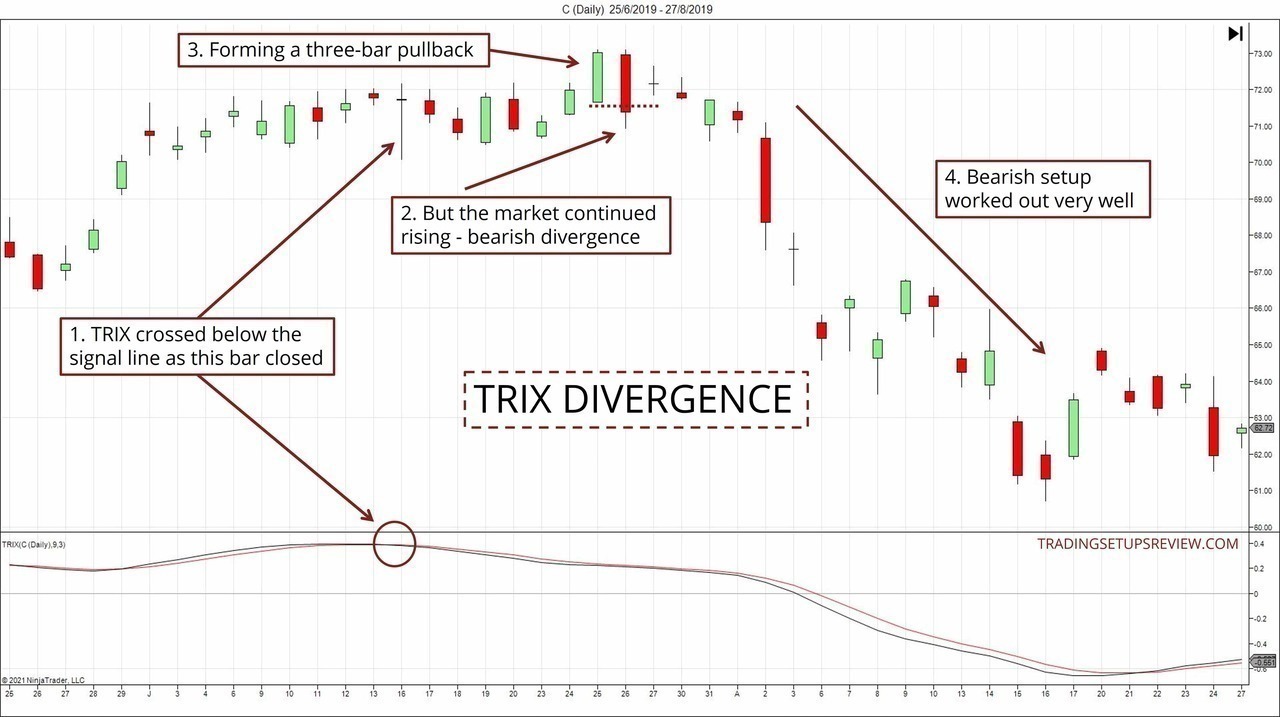
- Here, the TRIX crossed below its signal line and started drifting downwards.
- However, the market continued rising. This divergence between price action and the TRIX implied possible weakness in the market’s upwards drift.
- As the TRIX continued sloping down, a three-bar pullback pattern formed. However, “pullback” was a misnomer as its direction was with the price trend and not against it. Nonetheless, it did meet our trading rules for a short setup.
- Not only that, the short trade took off quickly and worked out well.
As you probably realized, this setup is fundamentally different from the earlier setups. While the first three examples focus on pullbacks within short-term trends, this final example is a reversal trade.
Although all four examples fulfilled the same trading rules, we were trading very different price action conditions. This is important as the proper market context in each case will differ as well.
Review - Improved Three Bar Pullback Pattern
This strategy demonstrates how to take a basic price action pattern (three-bar pullback) and improve it with your favored tactics (TRIX, in this case).
After all, our most effective trading strategies reflect our personality and market perspectives.
Using the TRIX indicator to define the trend is only a part of Lee Leibfarth’s improvisation. He also tested two sets of exit rules that improved the pattern’s performance. One set for short-term trades and another for trend-followers. Refer to his original article to learn more or do your own testing to explore further.
One important note - in this strategy, we are fading the three-bar pattern. But it is always possible that a three-bar pullback gains the momentum to follow through instead of reversing. For instance, a series of three consecutive bearish bars might be the start of a bearish trend and not a pullback within a bullish trend.
This outcome would foil our approach. From this perspective, the rule to enter with a stop order helps to mitigate this risk.
Hence, it’s helpful to observe the market structure relative to the three-bar pullback pattern. E.g., did the pullback break any significant support or resistance decisively? If so, it is more likely that the setup might not work out.
And, of course, we need to be extra cautious if more than three consecutive bars are closing in the same direction.
(For some reason, “three” is a familiar number to traders. Elliot wave practitioners count three impulse waves. We also have the three-bar reversal pattern and three-bar candlestick patterns like the Morning/Evening Star. I offer no explanation, but here’s some unrelated trivia on the number three for your reading pleasure.)
More Resources
I created a simple indicator on TradingView to highlight consecutive bars based on three different conditions. (You will need at least a free TradingView account to use it.)
- Current Close vs. Current Open
- Current Close vs. Previous Close
- Current High and Low vs. Previous High and Low
In particular, the condition used in the three-bar pullback we reviewed is the first condition. You can use it to find more three-bar pullback patterns for further study.
Also, this is another article discussing the concept of consecutive up and down days.
The article was first published on 30 December 2013 and updated on 5 October 2021.