Piercing Line Candlestick Trading Guide With Chart Examples
By Galen Woods ‐ 4 min read
The Piercing Line candlestick trading pattern can help you find reversal entries effectively. Learn how to do it with three in-depth chart examples.
The Piercing Line is a dramatic candlestick pattern. This bullish formation packs two formidable price action concepts: climax and reversal. Here, you’ll learn this superb candlestick pattern through three detailed charts.
But first, let’s run through a short primer on the Piercing Line candlestick pattern.
How To Identify The Piercing Line Candlestick Pattern
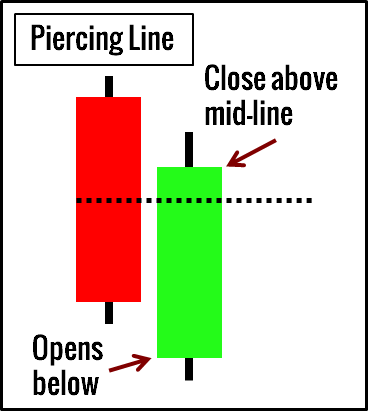
The Piercing Line pattern contains two candlesticks.
The first candlestick is bearish.
The second candlestick must:
- Open below the low of the first candlestick; and
- Close above the mid-point of the first candlestick.
Look at the diagram below.
The Dark Cloud Cover pattern is the bearish version of the Piercing Line.
In this tutorial, we’re focusing on the Piercing Line pattern.
What Does The Piercing Line Pattern Mean?
The first candlestick identifies a bearish context.
The second candlestick opens with a bearish gap beyond the low of the first candlestick. It presents an initial rush of bearish expectations.
However, the second candlestick ends on a strong bullish note. It erodes much of the first candlestick. This unexpected upwards reversal has excellent potential to shock and trap bearish traders.
Hence, to evaluate the quality of a Piercing Line pattern, consider:
- The range of both candlesticks
- The extent of the gap
- The proportion of the first candlestick that’s reversed by the second one
For these factors, you want them to be large. They contribute to the shock factor of the eventual bullish reversal of the Piercing Line.
Piercing Line Trading Examples
Example #1: Piercing Line With Support Zone
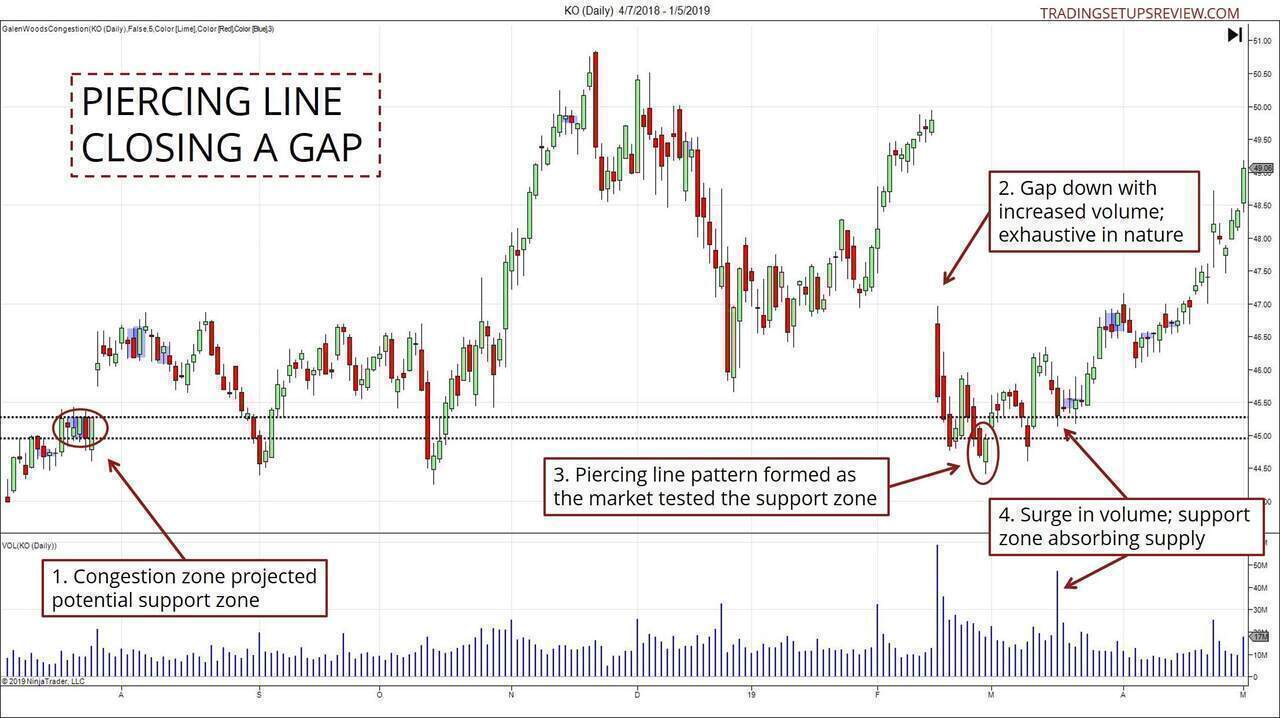
- Candlestick patterns play well with price action support and resistance. In this case, we focused on a support zone projected by an area of congestion. It was affirmed by two subsequent tests which led to the formation of a double bottom.
- The down gap took place with a volume surge, implying that it might be exhaustive.
- The market moved sideways along the support zone. However, the attempt to punch below the area failed as a Piercing Line pattern formed. This failure offered a signal to go long, and we expected the market to close the gap.
- This final test of the support zone had increased volume. It implied that the market was absorbing the supply.
Example #2: Piercing Line With Trend Channel Overshoot
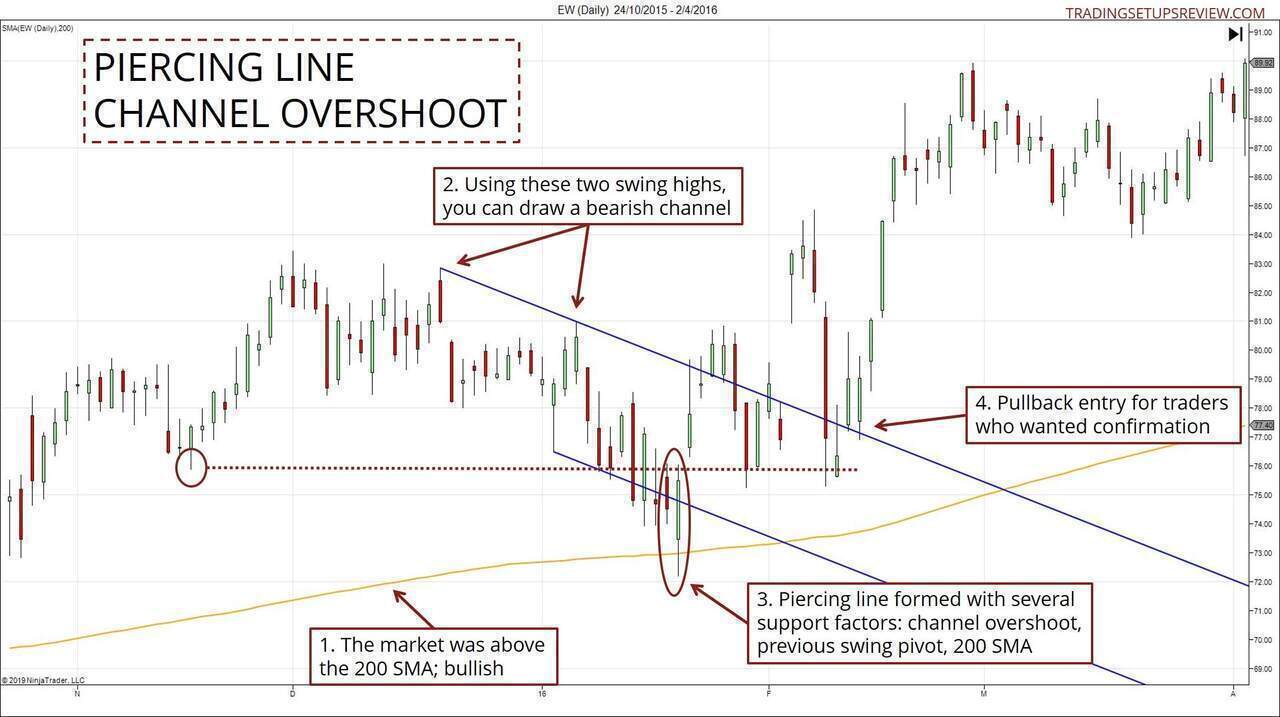
- Here, we aimed for a trend setup by looking for an overextension against the long-term trend. The 200-period SMA worked well here to highlight a bullish market bias.
- A counter-trend channel was drawn with these two swing highs. Overshoots imply that the counter-trend momentum has been exhausted. Click here to learn more about channel overshoots.
- This Piercing Line candlestick was impressive. It had a confluence of support working for it: the trend channel line, the 200-period SMA, and an earlier valid pivot.
- This pullback tested the broken bear trend line as a support level. More importantly, it offered an entry point for more conservative traders.
Note: The best Piercing Line patterns have immediate bullish follow-through. Hence, the bullish gap (or window in candlestick-speak) that followed the Piercing Line was encouraging. If you look closely at Example #1, you’ll also find a small window right after the Piercing Line pattern.
Example #3: Piercing Line Reversal With RSI Divergence
The first two examples focused on price action analysis.
But candlesticks also play well with oscillators. This example makes use of the RSI indicator to pinpoint a reversal.
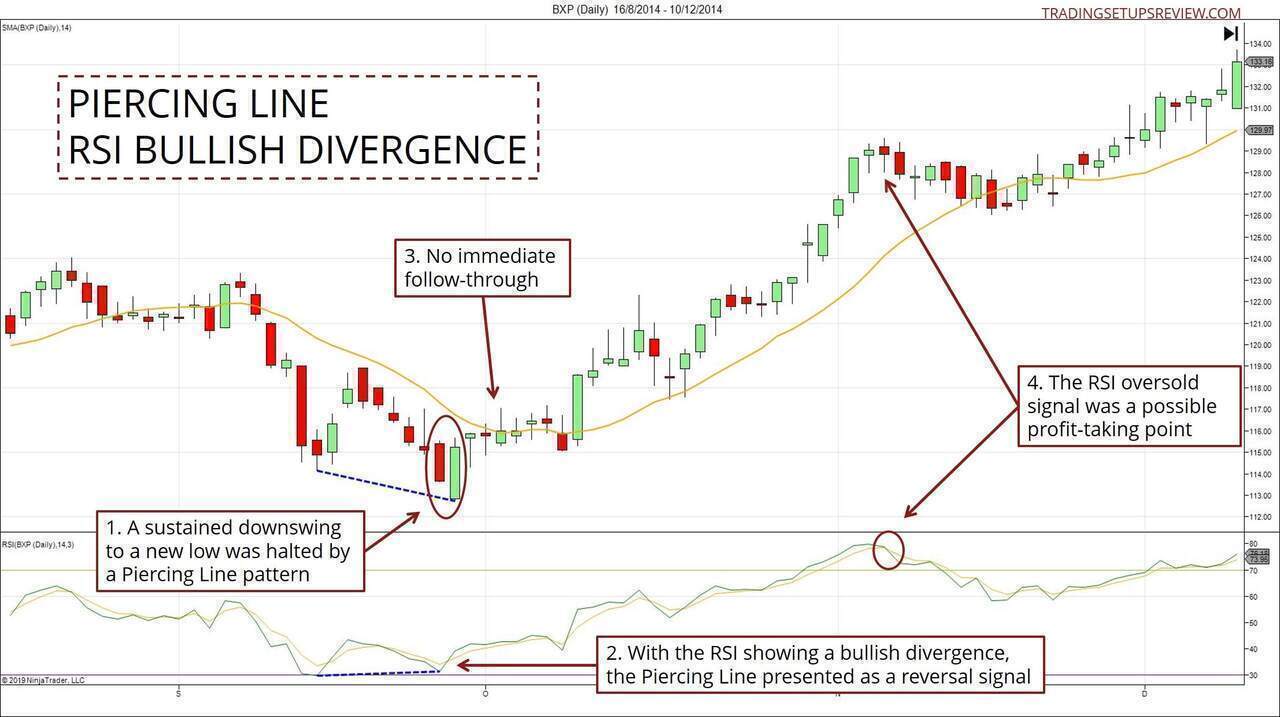
- The Piercing Line stopped a series of six consecutive bearish bars.
- In isolation, the candlestick pattern offered little basis for considering a long position. But in this case, the pattern occurred together with a bullish RSI divergence, and as a result, a bullish reversal trade became an attractive option.
- Unlike the earlier examples, there was no immediate follow-through. Instead, the market stayed indecisive for a period. It could be due to the earlier bearish momentum (the six consecutive bars). Nonetheless, a bullish breakout bar came soon after.
- Here, the RSI indicator helped us make sense of the context. For simplicity, you could also consider taking profits according to the RSI.
Conclusion
The Piercing Line is a compelling candlestick pattern.
You might find them in congestion zones with both candlesticks having small ranges. But in that context, they might not be worth your time.
Instead, focus on them when you find the pattern jutting out clearly on charts. That’s when they are more effective as reversal patterns.
Finally, as with all candlestick patterns, remember this principle.
Trade the market, not the pattern.
Pay more attention to the market context than to the exact form of the candlestick pattern.