10 Price Action Candlestick Patterns You Must Know
By Galen Woods ‐ 11 min read
Candlestick patterns are essential tools for every price action trader. Here are 10 candlestick patterns that you must know, complete with trading examples.
Are you using candlestick charts as your default chart type for price action analysis?
Most likely, the answer is yes. In that case, why not make the most out of it by mastering candlestick patterns?
According to Thomas Bulkowski’s Encyclopedia of Candlestick Charts, there are 103 candlestick patterns (including both bullish and bearish versions). While the encyclopedia is great for reference, there is no need to memorise the 929-page compendium.
Simply learn these 10 candlestick patterns for an illuminating foundation.
Basic Sentiment Candlesticks
1. Doji
2. Marubozu
Reversal Candlestick Patterns
3. Harami
4. Engulfing
5. Piercing Line / Dark Cloud Cover
6. Hammer / Hanging Man
7. Inverted Hammer / Shooting Star
8. Morning Star / Evening Star
9. Three White Soldiers / Three Black Crows
10. Hikkake
1. Doji
What does it look like?
It looks like a cross, with the same opening and closing prices.
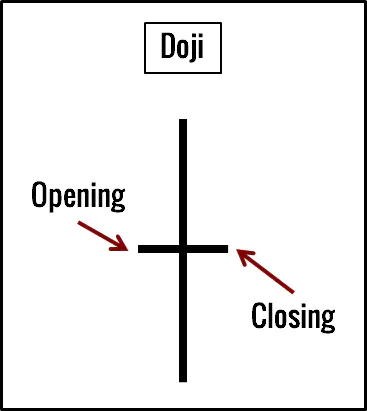
What does it mean?
Simple. In a Doji candlestick, price is essentially unchanged. Hence, it represents market indecision. It’s like an area of congestion compressed into one candlestick.
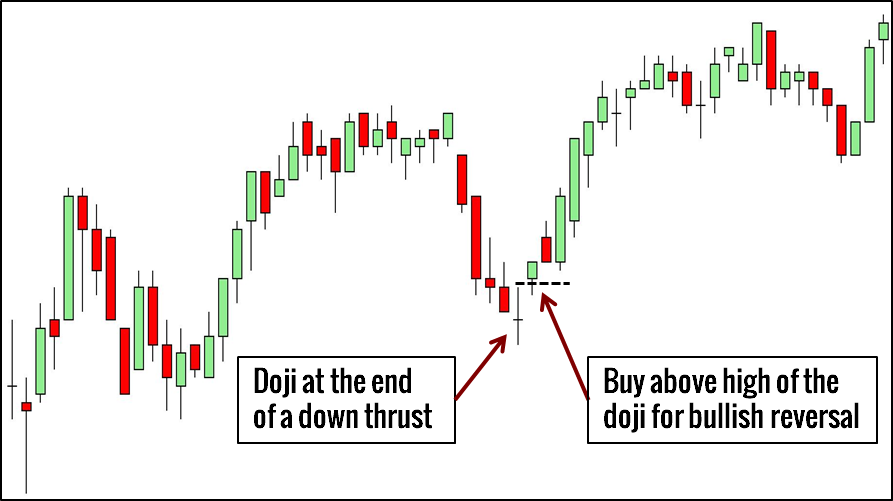
How do we trade it?
- Trade it like a reversal signal (if there is a trend to reverse)
- Treat it as a signal to stand aside (if there is no trend to reverse)
Read: Combining a Doji Pattern with Floor Pivots For Intraday Reversals
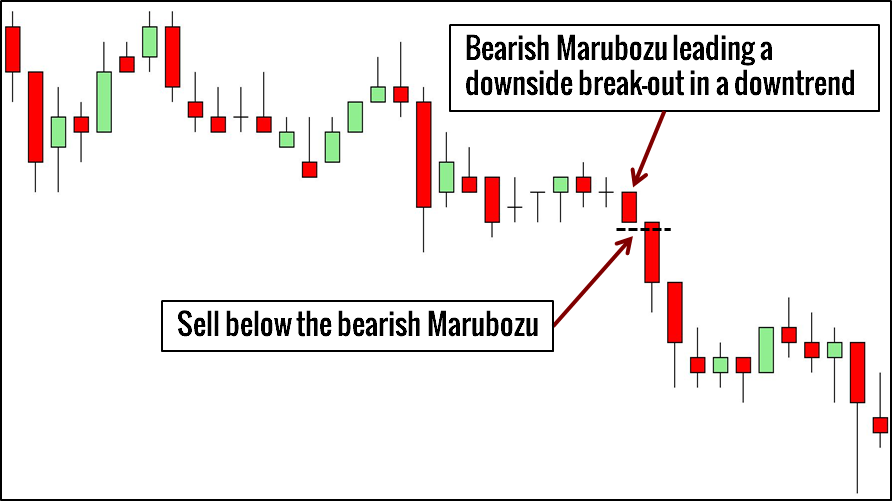
2. Marubozu
What does it look like?
A Marubozu is the polar opposite of a Doji. Its opening price and closing price are at the extreme ends of the candlestick.
Visually, it is a block.

What does it mean?
A Marubozu that closes higher signifies powerful bullish strength while one that closes lower shows extreme bearishness.
How do we trade it?
The Marubozu is more useful as a learning tool than as a pattern for trading. Together with the Doji candlestick, they highlight the extremes of the candlestick spectrum.
By placing a candlestick on this spectrum, we are able to judge the directional strength of any bar.
If you must trade the Marubozu pattern, consider the following.
- Continuation pattern in a strong break-out aligned with the market bias
- Part of another candlestick pattern (discussed below)
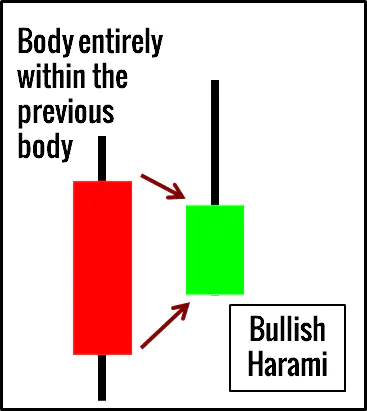
3. Harami Candlestick
What does it look like?
Just remember that Harami means pregnant in old Japanese. The first candlestick is the mother, and the second candlestick is the baby.
Focus on their bodies. The body of the baby bar must be entirely within the body of the mother bar.
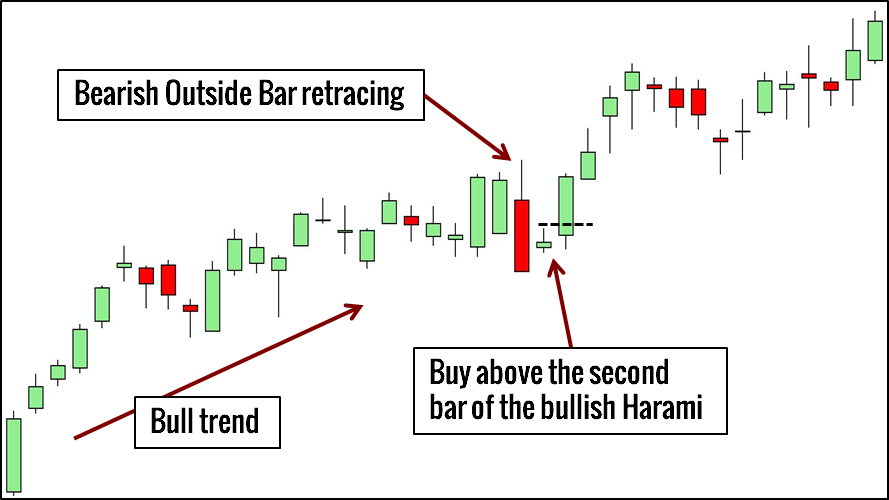
Typically, in a bullish Harami, the first bar closes lower than it opens while the second bar closes higher. Similarly, in a bearish Harami, the first bar closes higher than it opens while the second bar closes lower.
What does it mean?
It means that the market has come to a muted reversal.
The candle body stands for the real price change of the candle regardless of its intra-candle excursions. Hence, it represents the real and conclusive movement of the candlestick. The smaller candle bodies point to decreased volatility. Thus, it is not surprising that many Harami candlestick patterns are also inside bars.
Compared with the Engulfing candlestick pattern below, it is a weaker reversal pattern.
How do we trade it?
- In a bull trend, use the bullish Harami to pinpoint the end of bearish retracement.
- In a bear trend, use the bearish Harami to pinpoint the end of bullish retracement.
Read: How To Trade Trend Reversals With Harami and Trend Channels
4. Engulfing Candlestick
What does it look like?
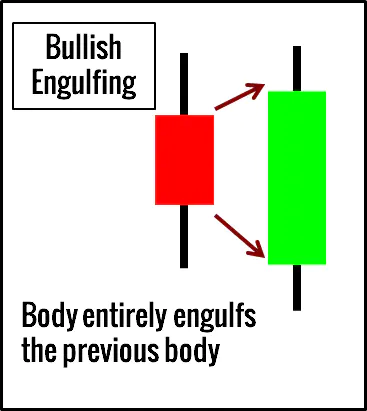
Simply flip a Harami pattern horizontally and you will get an Engulfing pattern.
The body of the second candle completely engulfs the body of the first.
What does it mean?
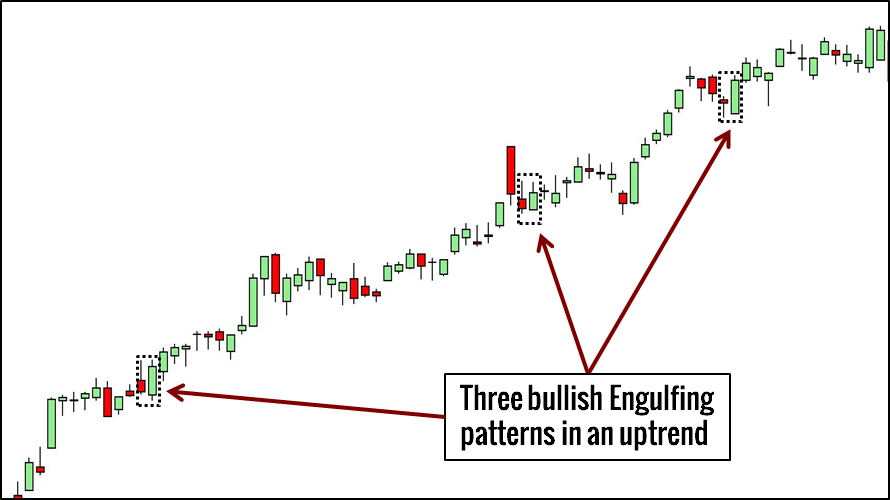
Again, the focus on the candle bodies looks for a real reversal. In this case, the second candle body fully engulfs the first and represents a strong reversal signal.
How do we trade it?
- In a bull trend, buy above the bullish Engulfing pattern for bullish continuation.
- In a bear trend, sell below the bearish Engulfing pattern for bearish continuation.
Learn how to trade the Engulfing pattern using the market structure of swings as a guide.
5. Piercing Line / Dark Cloud Cover
What does it look like?
The Piercing Line and the Dark Cloud Cover refer to the bullish and bearish variants of the same two-bar pattern.
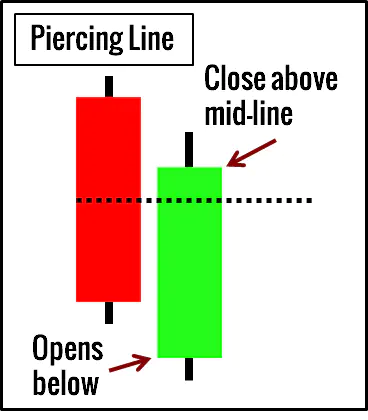
The first candlestick of the Piercing Line pattern is bearish. The second candlestick:
- Opens below the low of the first candlestick; and
- Closes above the mid-point of the first candlestick.
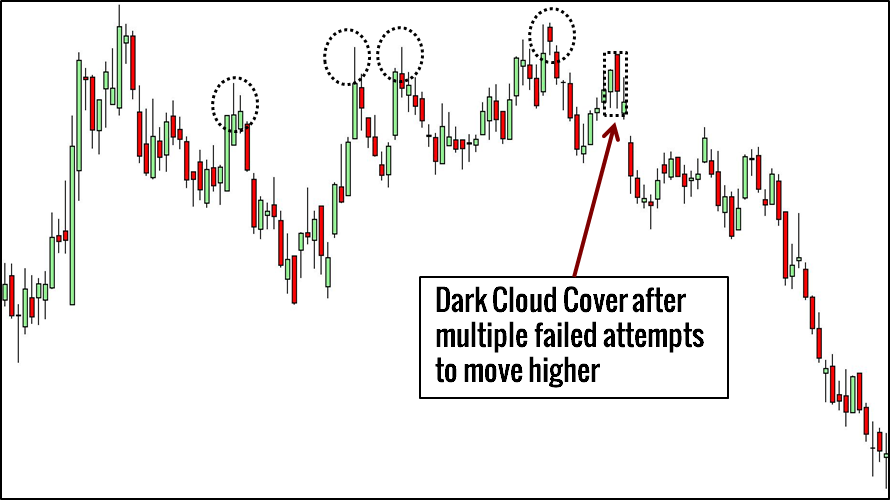
As for the Dark Cloud Cover pattern, the first candlestick is bullish. The second candlestick:
- Opens above the high of the first candlestick; and
- Closes below the mid-point of the first candlestick.
Due to the first criterion of both patterns, the second bar must open with a gap away from the close of the first bar. Hence, these candlestick patterns are unusual in intraday time-frames where gaps are uncommon.
What does it mean?
It means some traders are sorely disappointed.
In the Piercing Line pattern, the second bar opened with a gap down, giving an initial hope of a strong bearish follow-through. However, not only did the bearishness fail to materialise, it proceeded to erase more than half of the bearish gains from the first bar. This bullish shock offers a great long trade.
Likewise in the Dark Cloud Cover pattern, the first gap up prompted hope from the bulls before the lower close crushed it.
How do we trade it?
- Find major bullish reversals with the Piercing Line pattern (preferably after a break of a bear trend line)
- Find major bearish reversals with Dark Cloud Cover pattern (preferably after a break of a bull trend line)
6. Hammer / Hanging Man Candlesticks
What does it look like?
Let’s get this straight. Both the Hammer and the Hanging Man patterns look exactly the same.
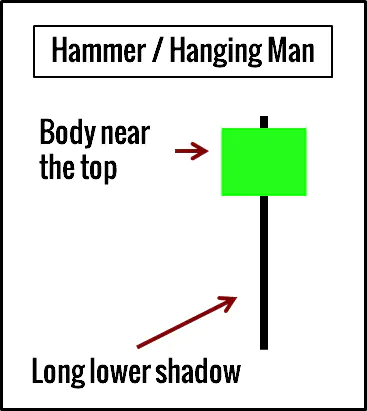
Both have a:
- Candle body near the top of the candlestick; and
- A long lower shadow (around twice of the candle body).
(Color of the candle body does not matter.)
The difference is this. The Hammer pattern is found after a market decline and is a bullish signal. However, the Hanging Man appears (as an ill-omen) at the end of a bull run and is a bearish signal.
What does it mean?
The Hammer pattern traps traders who sold in the lower region of the candlestick, forcing them to cover their shorts. As a result, they produce buying pressure for this bullish pattern. Its bar pattern equivalent is the bullish Pin Bar.
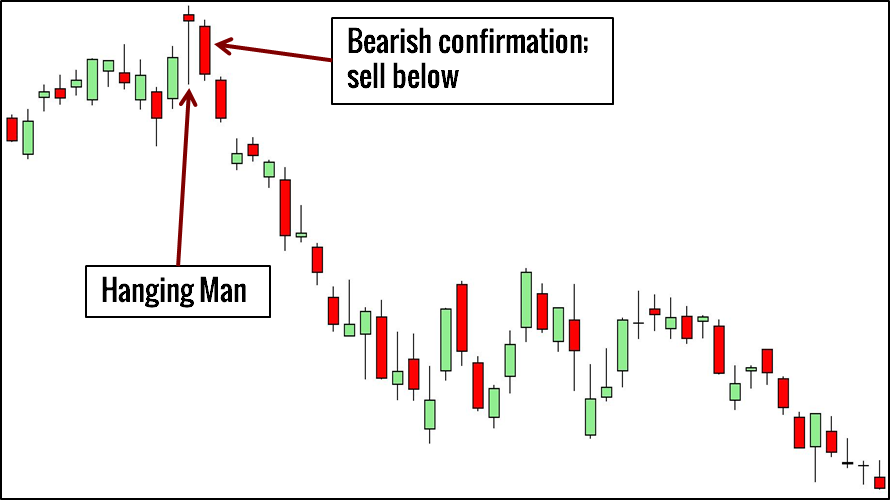
The Hanging Man pattern is a seemingly bullish candlestick at the top of an upwards trend. Infected by its optimism, traders buy into the market confidently. Hence, when the market falls later, it jerks these buyers out of their long positions. This also explains why it is better to wait for bearish confirmation before going short based on the Hanging Man pattern.
How do we trade it?
- In a downtrend, buy above the Hammer pattern for a reversal play. (You can also trade the Hammer pattern like a bullish Pin Bar.)
- In a uptrend, sell below the Hanging Man pattern for a reversal play after bearish confirmation.
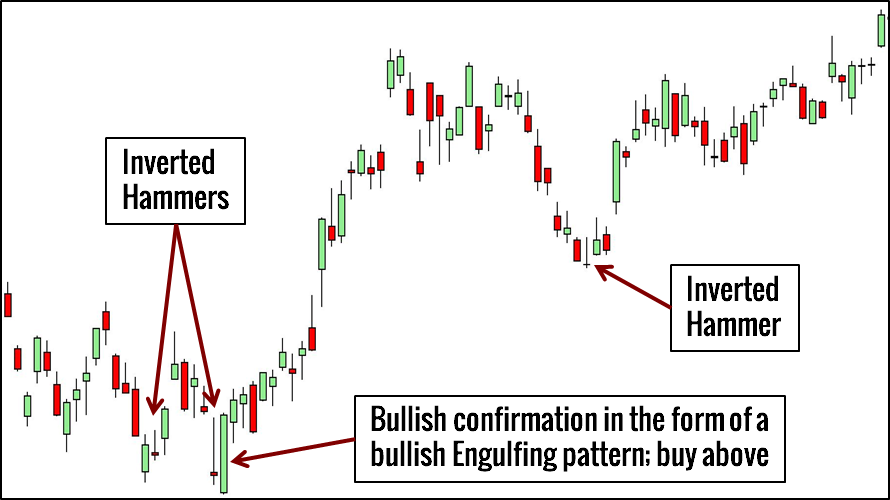
7. Inverted Hammer / Shooting Star Candlesticks
What does it look like?
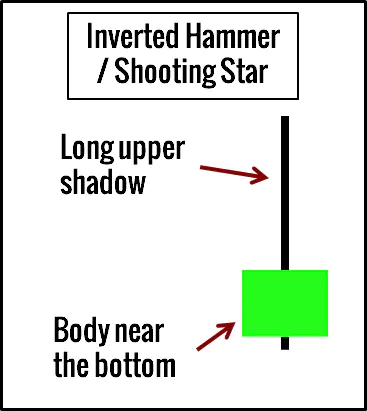
Simply invert the Hammer pattern.
The Inverted Hammer is visually identical to the Shooting Star pattern.
The difference is in where you find them. An Inverted Hammer is found at the end of a downtrend while a Shooting Star is found at the end of a uptrend.
What does it mean?
The Inverted Hammer is a bullish pattern. In a down trend, the Inverted Hammer pattern emboldens the sellers. Hence, when the Inverted Hammer fails to push the market down, the bullish reaction is violent.
The bearish Shooting Star pattern implies a different logic. The Shooting Star traps buyers who bought in its higher range, forcing them to sell off their long positions and hence creating selling pressure. Its bar pattern equivalent is the bearish Pin Bar.
How do we trade it?
- In a downtrend, buy above the Inverted Hammer pattern for a reversal play after bullish confirmation.
- In a uptrend, sell below the Shooting Star pattern for a reversal play. (You can also trade it like a bearish Pin Bar.)
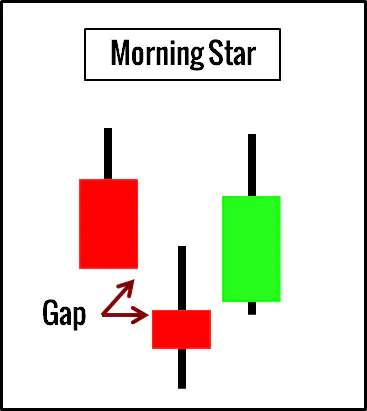
8. Morning Star / Evening Star
What does it look like?
Both star patterns are three-bar patterns.
In candle-speak, a star refers to a candlestick with a small body that does not overlap with the preceding candle body. Since the candle bodies do not overlap, forming a star will always involve a gap. Thus, it is uncommon to find Morning Stars and Evening Stars in intraday charts.
A Morning Star comprises (in sequence):
- A long bearish candlestick
- A star below it (either bullish or bearish)
- A bullish candlestick that closes within the body of the first candlestick
An Evening Star comprises (in sequence):
- A long bullish candlestick
- A star above it (either bullish or bearish)
- A bearish candlestick that closes within the body of the first candlestick
This pattern is similar to the three-bar reversal.
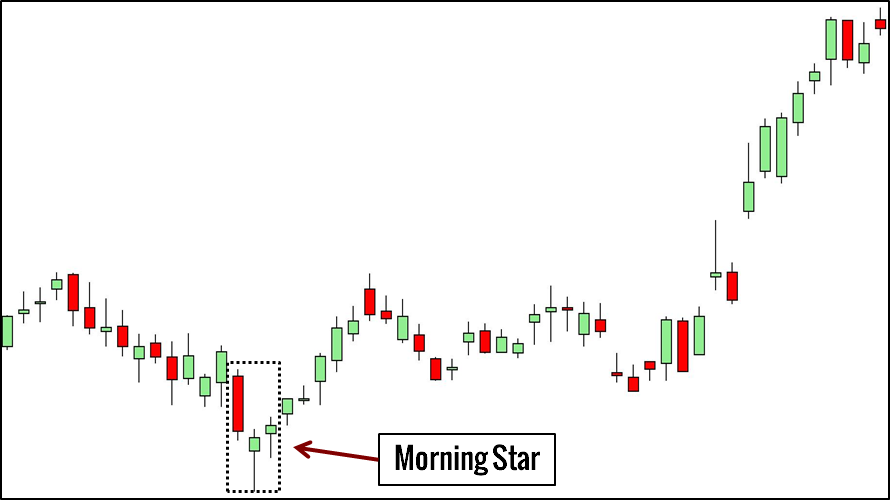
What does it mean?
The first candlestick in the Morning Star pattern shows the bears in control. The star hints at a transition to a bullish market. Finally, the strength of the last candlestick confirms the bullishness.
The Evening Star expresses the same logic. The first candlestick shows the bulls in control. Uncertainty sets in with the star candle. The last candlestick confirms the bearishness.
How do we trade it?
We apply both patterns to catch reversals as well as continuations.
- Buy above the last bar of the Morning Star formation
- Sell below the last bar of the Evening Star formation
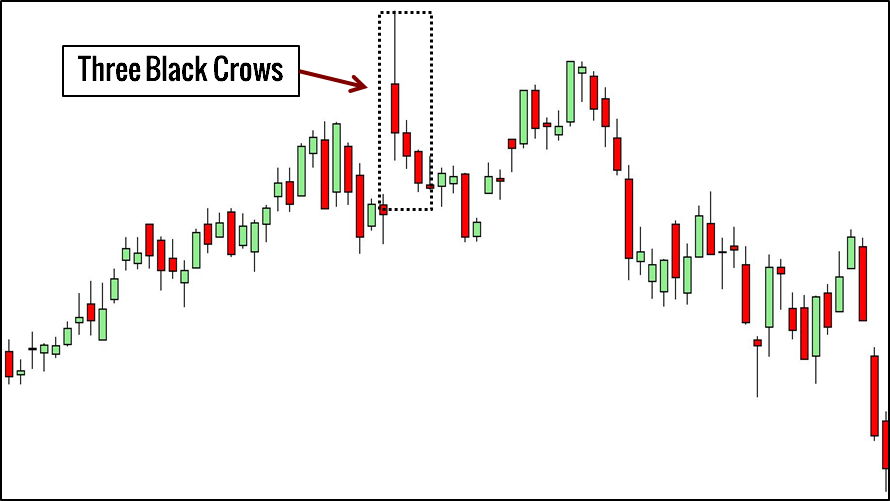
9. Three White Soldiers / Three Black Crows
What does it look like?
Each of the three candlesticks in the Three White Soldiers should open within the previous candle body and close near its high.
Each of the three candlesticks in the Three Black Crows should open within the previous candle body and close near its low.
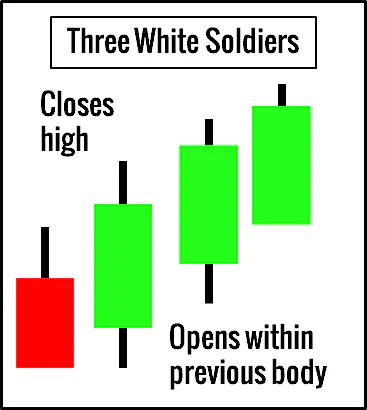
What does it mean?
In the Three White Soldiers pattern, each bar opens within the body of the previous candlestick and suggests a potential fall. However, each bar ends up with a strong and high close. After three instances, the bullishness is undeniable.
In the Three Black Crows pattern, each bar opens within the body of the previous candlestick, suggesting bullishness. However, as each bar closes lower, the bearishness is clear.
How do we trade it?
These patterns are effective for trading reversals.
- Buy above the Three White Soldiers after a substantial market decline
- Sell below the Three Black Crows after a substantial market rise
Read: Trading with Mountains, Rivers, Soldiers, and Crows
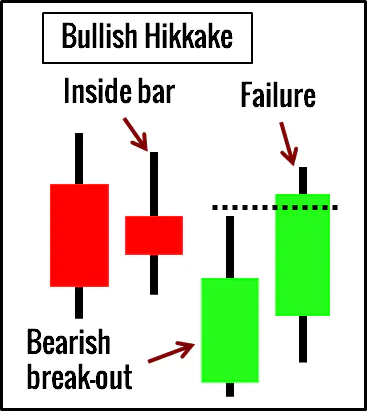
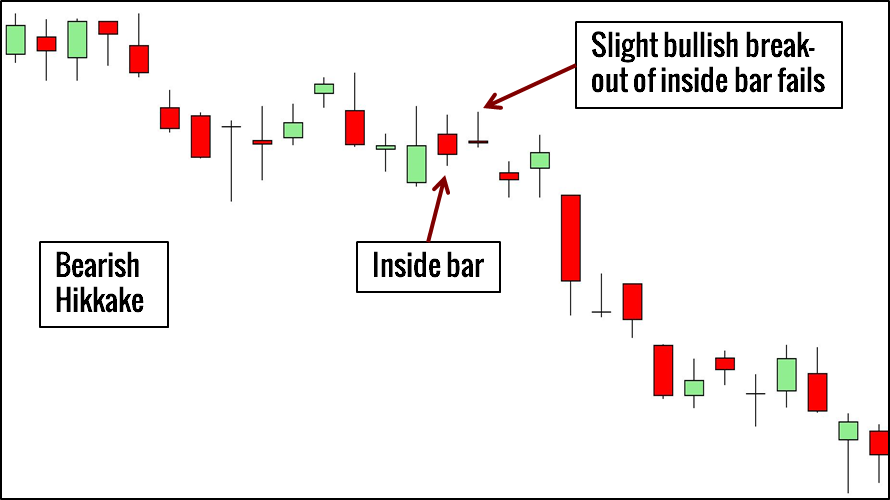
10. Hikkake
(Despite having a Japanese name, the Hikkake is not one of the classic candlestick patterns. However, it is an interesting pattern that illustrates the concept of trapped traders.)
What does it look like?
To find a Hikkake pattern, first look for an inside bar.
For a bullish Hikkake, the candlestick after the inside bar must have a lower low and a lower high to signify a bearish break-out of the inside bar. When this bearish break-out fails, we get a long Hikkake setup.
For a bearish Hikkake, the next candlestick must have a higher high and higher low. When this bullish break-out of the inside bar fails, the market forms a short Hikkake setup.
If you need help looking for the Hikkake pattern, check out our Price Action Pattern Indicator.
What does it mean?
The Hikkake pattern pinpoints the failure of inside bar traders.
Trading the break-out of inside bars is a popular strategy. When the break-out fails, we expect the price to blaze in the other direction.
How do we trade it?
We use Hikkake for continuation trades.
- Buy if a downside break-out of an inside bar fails within three bars
- Sell if an upside break-out of an inside bar fails within three bars
Read: Detailed Review of the Hikkake Pattern
What’s Next?
Learn More Candlestick Patterns

Of course, you should not limit yourself to the 10 candlestick patterns above.
However, you should familiarise yourself with one pattern before moving to the next. Trying to look out for dozens of patterns without knowing what they are trying to tell you lands you in a confusing mess.
Start with Steve Nison’s Japanese Candlestick Charting Techniques, which is the closest you can get to the source of candlestick patterns without picking up a Far Eastern language with three scripts.
Compare with Bar Patterns
Despite differences in nomenclature, bar patterns and candlestick patterns are not mutually exclusive. In fact, integrating both will greatly improve your price action analysis.
Read: 10 Bar Patterns You Must Know
In particular, you would find that candlestick patterns brought along with it a deep focus on analysing the candle body. The comparison of the candle body (the range between the open and close), which is largely ignored by bar patterns, adds great value to price action analysis.
The pairings below will get you started on studying the similarities and differences between bar patterns and candlestick patterns.
- Harami - Inside Bar
- Engulfing - Outside Bar
- Hammer/Shooting Star - Pin Bar
- Piercing Line/Dark Cloud Cover - Two-Bar Reversal
- Morning Star/Evening Star - Three-Bar Reversal
- Three White Soldiers/Three Black Crows - Three-Bar Pullback
Study Candlestick Trading Strategies
Note that we based the trading methods above on our own experience. They might not correspond strictly to Steve Nison’s book.
While you can refer to books and other online resources on candlestick patterns for a start, the best conclusion is always based your own observation and testing. You need to keep good trading records for this purpose.
Get started with candlestick trading with the strategies below.
Are you spending too much time learning patterns? And too little time on learning how to trade? Learn to take profitable trades with my price action trading course.