How To Find and Profit From Trapped Traders
By Galen Woods ‐ 7 min read
Trapped traders offer a sound premise for a trading setup. With two simple guidelines, you can identify bear and bull traps and exploit them in your trades.
One of the best ways to time your market entry is to locate trapped traders. When these traders realize they are wrong, they will try to get out of the market and reverse their positions. In doing so, they offer us an advantage in our entry timing.
An example is the Hikkake pattern, which takes advantage of traders who went in on the wrong side of an Inside Bar.
The diagram below illustrates the basic concepts.
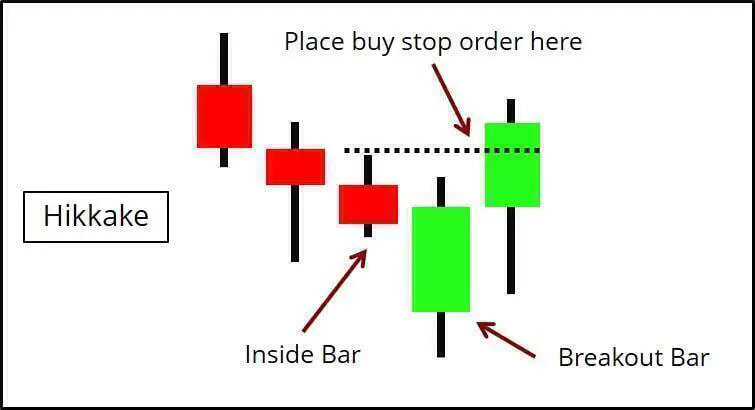
- In a bear trap scenario, the market breaks out below an inside bar to lure bearish traders in, before reversing upwards.
- As the market rises, the bearish traders are forced to exit their short positions. You can then exploit the market flow created by these exiting traders by going long.
The Hikkake is one of the many patterns that try to take advantage of traders trapped in pattern failures. In the next section, we’ll go through the approach to uncover more trading opportunities using the concept of trapped traders.
Guidelines for Finding Trapped Traders
How do you find trapped traders?
Trapped traders represent a trading concept that can manifest in various forms. It is not a rigidly defined price pattern.
Accordingly, there are no fixed rules for identifying them.
Instead, let’s rely on two general identification guidelines:
- Look for a rush towards support or resistance levels
- Wait for a sudden and swift rejection
The sections below elaborate on these two guidelines.
#1: A rush towards a support or resistance level
Look for a market rush towards a support or resistance level.
This rush should get traders excited. And it should make them feel hopeful that the market will break the support or resistance level. It should look solid and credible.
In practice, pay attention to:
- Consecutive Trend Bars
- Gaps
- Outside Bars
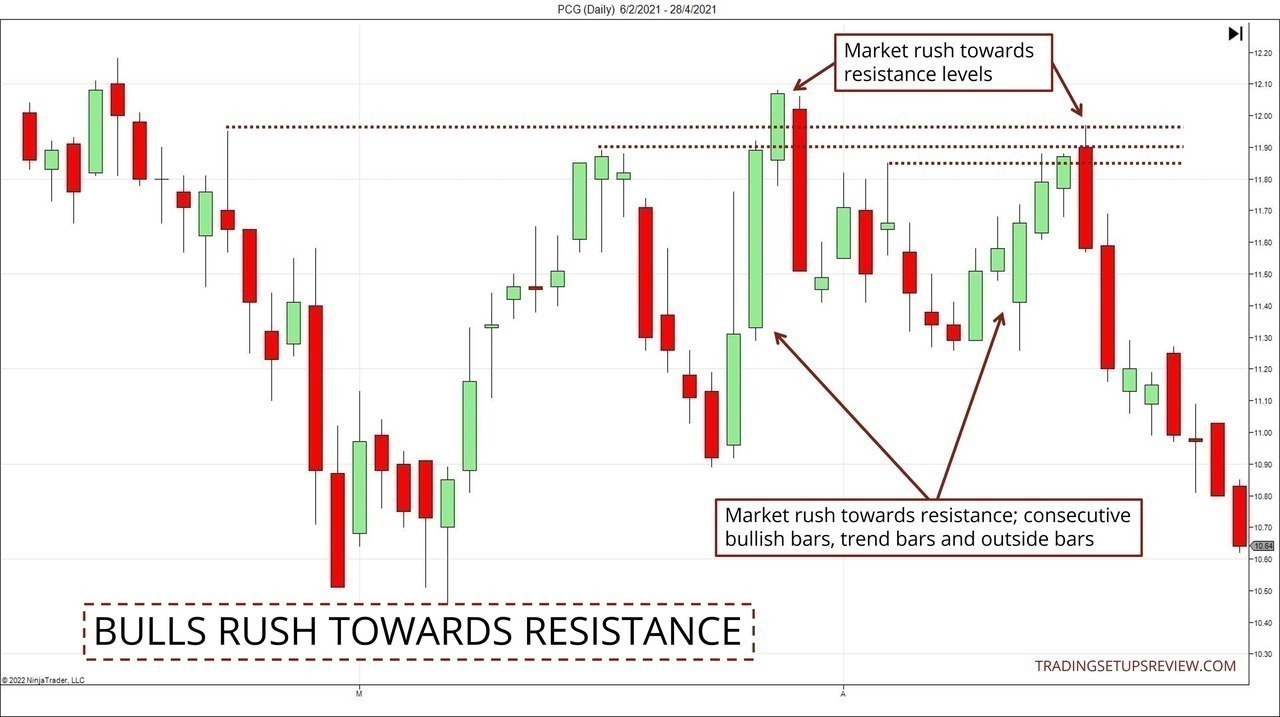
The chart above shows two instances of the market rushing towards an established resistance.
The bullish thrusts consist of consecutive bullish bars, including Trend Bars and Outside Bars.
#2: The support or resistance level quickly rejects the attempt to break it
Here, you want to see the hopes of the abovementioned traders crushed. Ideally, you want to have them trapped.
Look for swift, sudden, and possibly repeated rejections from the support or resistance level.
In practice, pay attention to:
- Pin Bars
- Two-Bar Reversals
- Failure to close beyond the support and resistance level
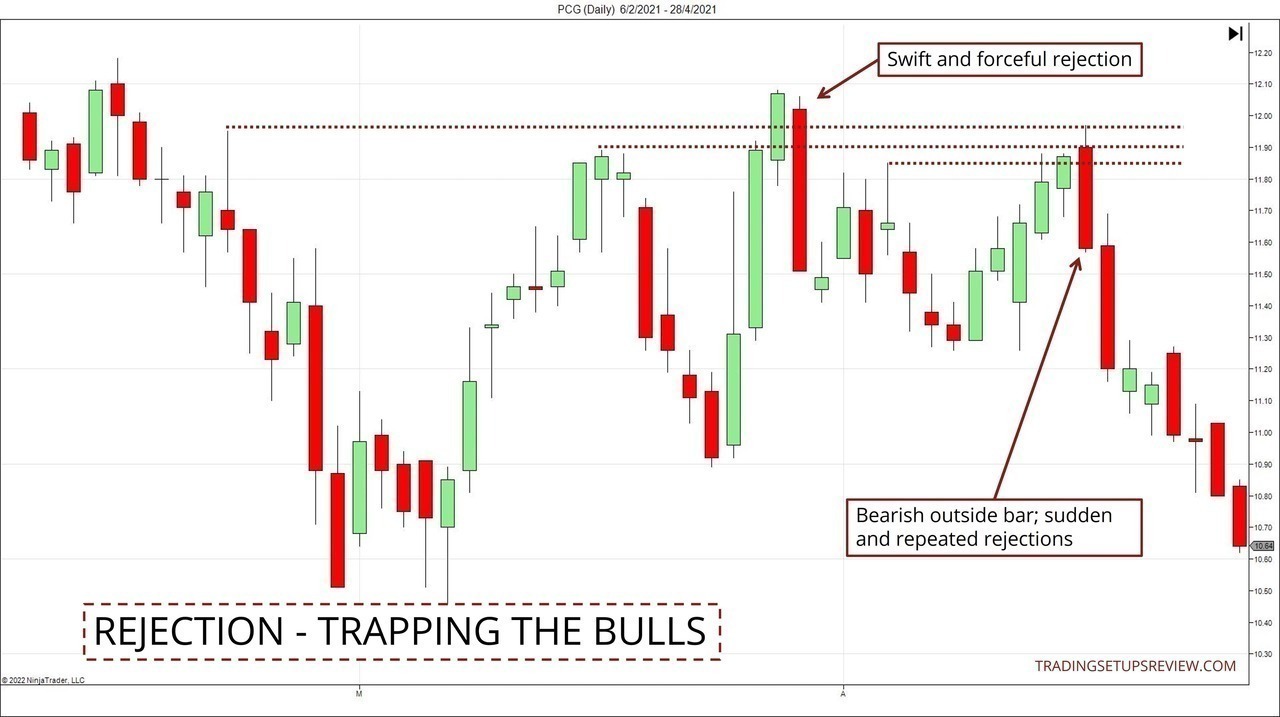
The chart above shows the swift and sharp rejection of the bullish thrusts around the level of the resistance zone.
Such price action implies that the earlier bullish traders were trapped.
Trading Traps Chart Examples
In this section, let’s look at three examples.
Using detailed candlestick charts, we will shed light on applying the guidelines above.
Our focus here is to highlight pockets of trapped traders, not the exact trading entries and exits.
The concept of trapped traders is useful in most markets. To demonstrate its versatility, we’ll look at examples from a variety of markets and time frames:
- Futures: FDAX 5-minute
- Forex: EURUSD 4-hour
- Stocks: BAC Daily
- Cryptocurrency: BTC/USD Hourly
Example #1: Bull Trap - FDAX 5-Minute
The 5-minute chart below shows a bull trap from the DAX futures market (FDAX on EUREX).
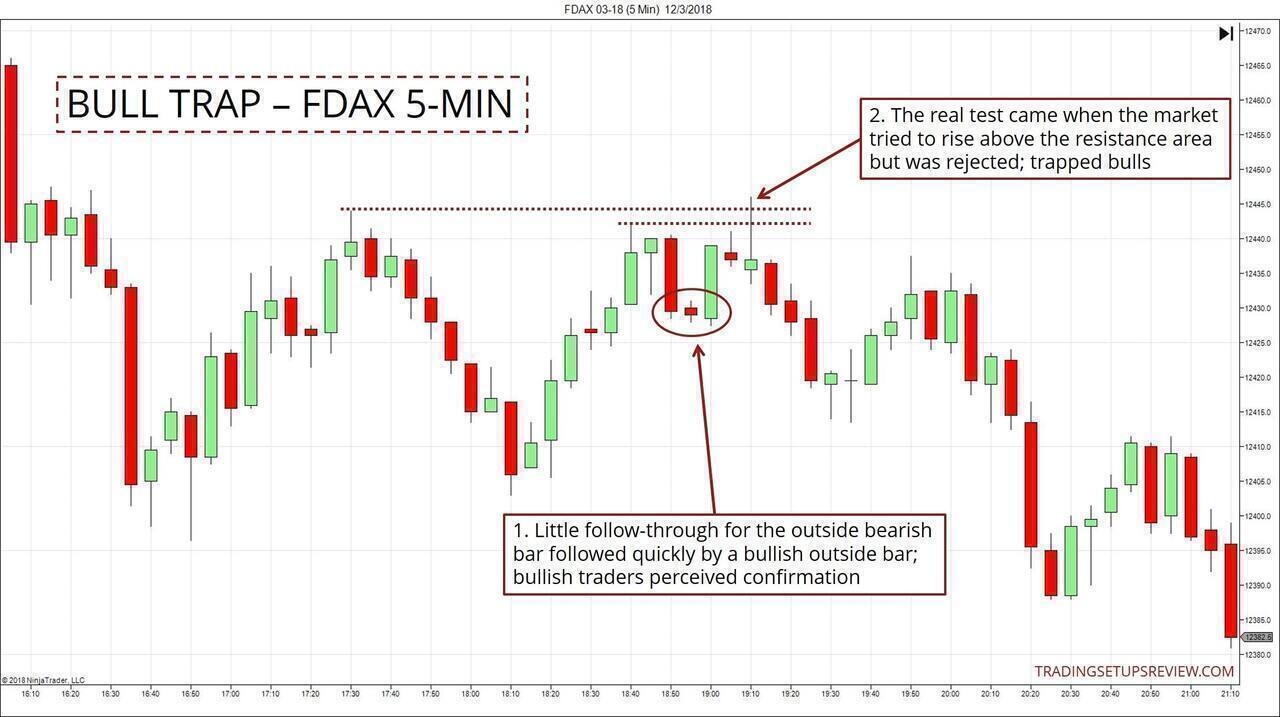
- The bearish outside bar had little follow-through. Not only that, a bullish outside bar took over quickly. Such price action emboldened the bullish traders, who were conceivably excited and hopeful for a further rise.
- However, the rising market did not pass the actual test. It was rejected when it tried to rise above the resistance zone (Double Top). You can observe this clearly from the Pin Bar, which formed a prominent long upper shadow. At that point, the bulls were trapped.
Trapped bulls offer the ideal context for entering a short trade.
Example #2: Bear Trap - EURUSD 4-Hour
This extended example discusses the price action at two support levels.
The 4-hour chart below shows the EURUSD currency pair from the forex spot market.
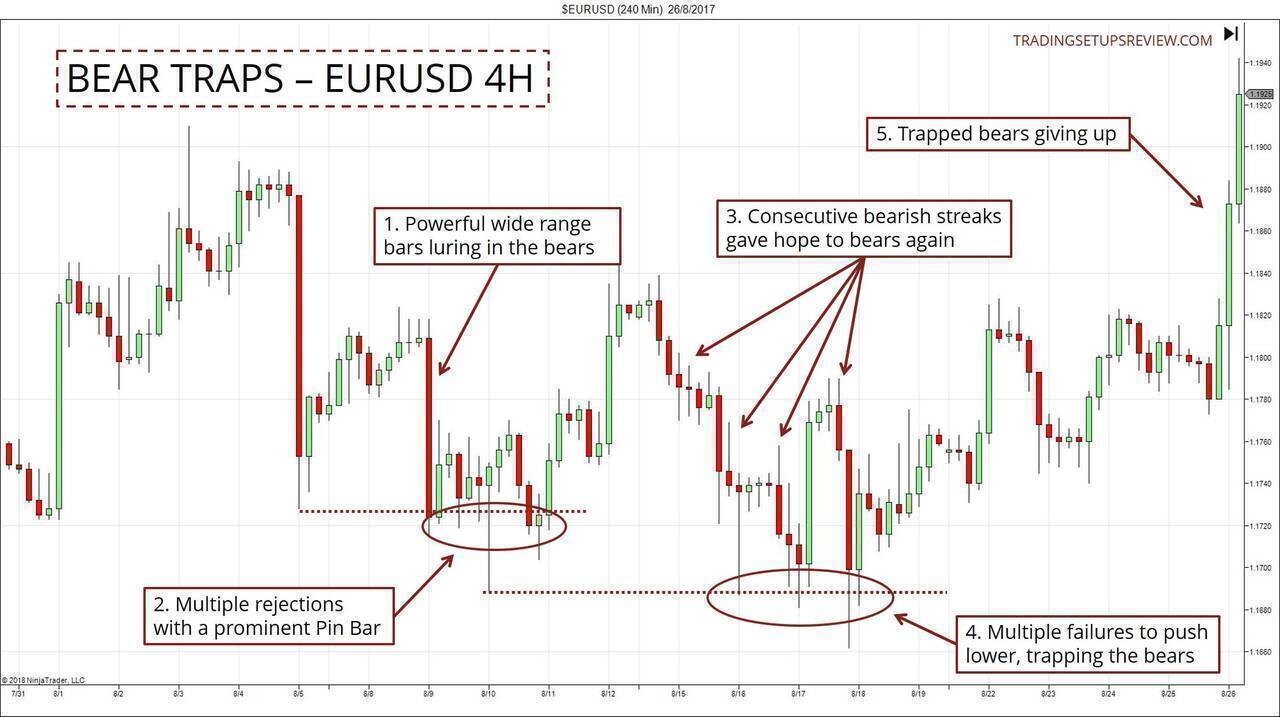
- This powerful bearish bar prompted fear of missing out among bearish traders. The bears were lured in.
- However, examine this area, and you’ll find that the bears had many reasons to feel jittery. Several bullish signs were: a bullish inside bar, failures to close below the support, a wide range bullish pin bar, and a bullish reversal bar.
- Yet, streaks of bearish bars gave hope to the bears again. The third arrow from this box pointed to a bearish outside bar that certainly drew in bearish traders. These were clear signs of hopeful bears.
- However, we saw from these long lower shadows that the market repelled attempts to go below the support level. These repeated quick failures suggested that a bear trap was underway.
At that point, the stage was ready for long trades.
Notice how the observations correspond to the guidelines we discussed earlier:
- Points 1 and 3 above pointed out the price action that made the bears hopeful and led them into the market.
- Points 2 and 4 pointed out the price action that disappointed the bears and revealed the trap.
Contrast this example with the first one. You’ll realize that you can spot trapped traders over a few candlesticks (like in Example #1) or dozens of candlesticks (like in Example #2).
This fluid nature makes this concept powerful but tricky to apply. Hence, practice is vital.
Example #3: Bull Trap - BAC Daily
This daily chart example from Bank of America (BAC on NYSE) highlights a bull trap surrounded by price gaps.
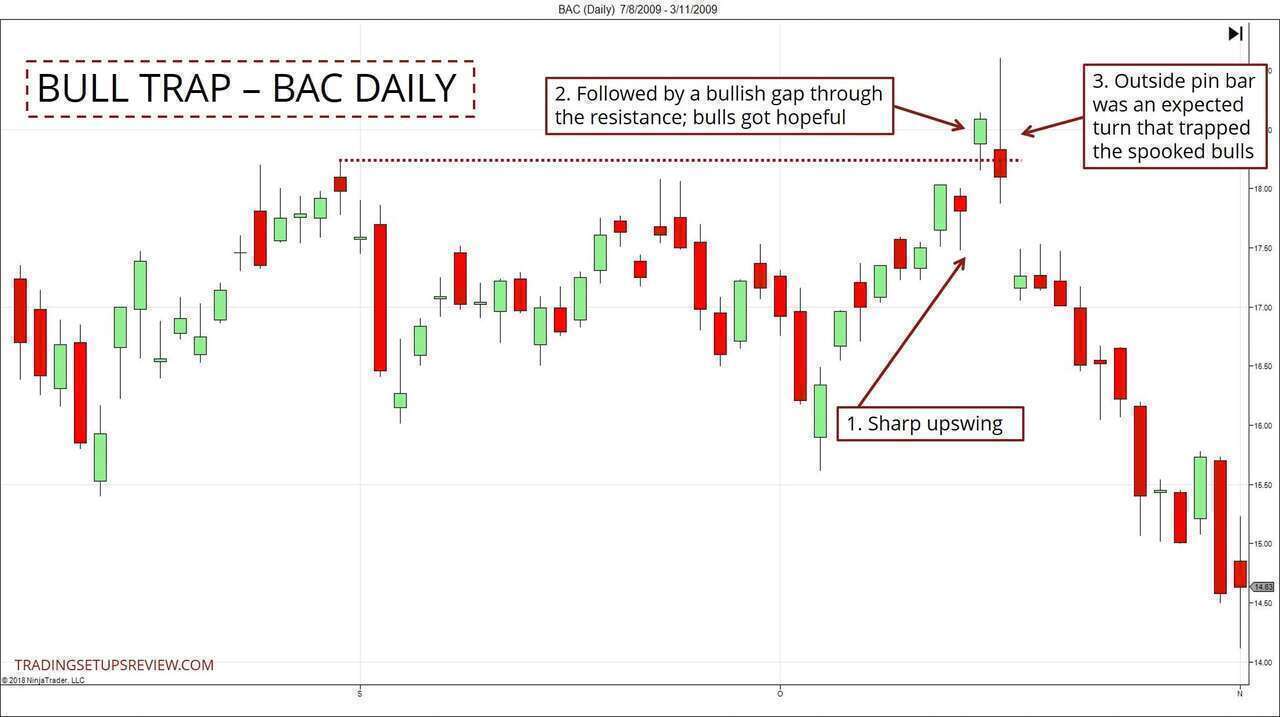
- This sharp upswing attracted the attention of the bulls.
- This bullish gap bar pushed through a resistance level and implied that the bulls had tipped their hands; the bulls were committed.
- However, the market immediately rejected this jump to a new high. This climactic bearish outside bar/pin bar clearly showed trapped bulls. It was time to consider a short trade.
Looking for trapped traders naturally factors in support and resistance into our analysis. This aspect allows us to sidestep the common mistake of focusing on a price pattern and neglecting the context.
Example #4: Bear Trap - BTC/USD Hourly
Our final example looks at a bear trap from the cryptocurrency market (BTC/USD hourly chart).
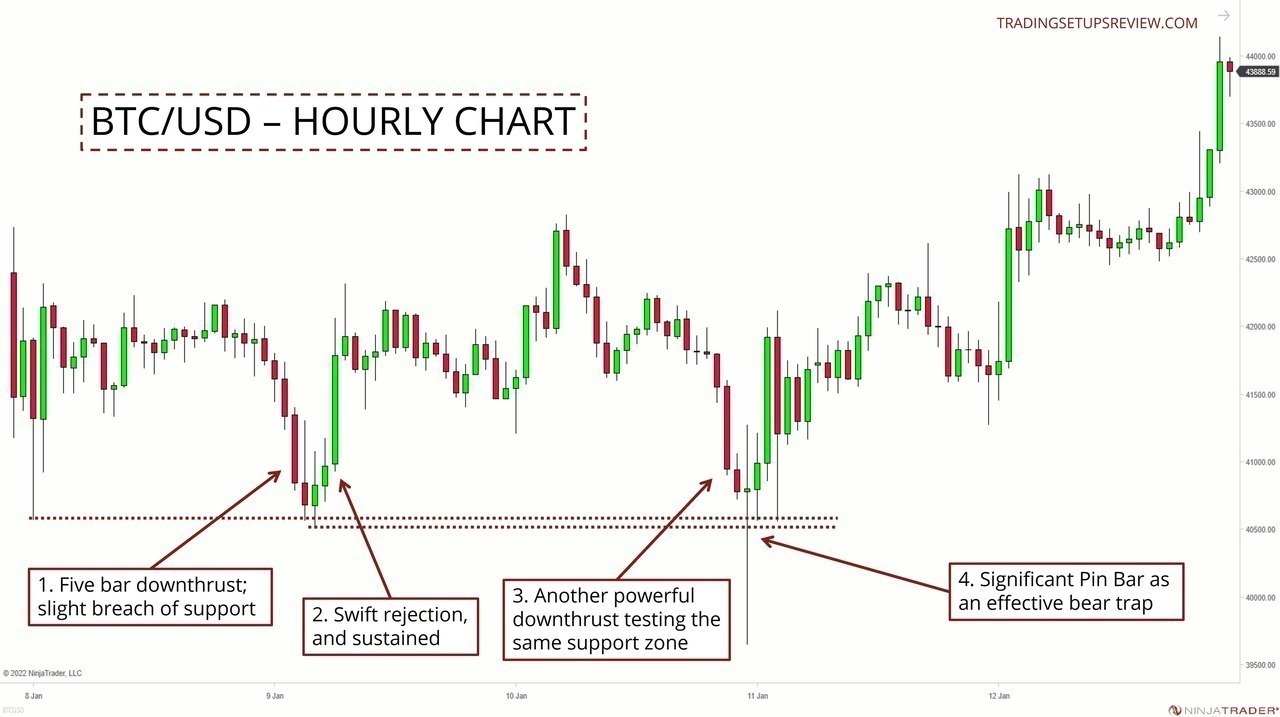
- This five-bar downthrust breached an earlier support level slightly.
- However, it was rejected quickly with a bullish thrust that was just as powerful. The bearish traders were trapped as the market reversed upwards.
- Soon, the market tested the same support zone with another sharp bearish thrust. To committed bearish traders, this plunge offered hope of a renewed bear market.
- But that hope was misplaced. This bullish pin bar penetrated significantly below the support but ultimately failed to make much bearish headway.
Given the context and the form of the Pin Bar, it was a reliable bear trap and a great time to consider long trades.
Conclusion - How To Find And Profit From Trapped Traders
In the examples above, we followed simple guidelines to find trapped traders, which led to trading opportunities.
Yet, you observed how varied the scenarios could be at the same time.
Hence, this method of reading the market requires much practice and patience. So take your time to explore it, and you’ll realize that many popular price patterns are based on similar ideas.
The approach in a nutshell:
- Do not think about when to enter the market. That will make you anxious and unprofitable.
- Instead, think about when other traders would enter. And think about when they would become anxious. (Try putting yourself in their shoes.)
- Then, enter the market as it moves against them.
This fundamental idea is that once you locate trapped traders, you have a sound premise for entering the market.
The article was first published on 16 March 2018 and updated on 3 February 2022.