Harami Candlestick Reversal Trading Strategy
By Galen Woods ‐ 4 min read
The Harami candlestick pattern works great for trend reversal setups. Learn how to combine it with trend channels and MACD divergences for best results.
The Harami candlestick pattern is highly recognizable on your charts. However, like all price patterns, trading the Harami alone is not a good idea. This is especially true when you’re looking for trend reversals.
This article shows you how to trade the Harami candlestick pattern with other tools. In the process, you’ll learn to build a more effective reversal trading strategy.
The Key Trading Concepts
This strategy is straightforward if you already understand the following trading concepts/tools:
If you’re not familiar with them, click on the links above to learn more about each trading concept.
#1: Harami Candlestick Pattern
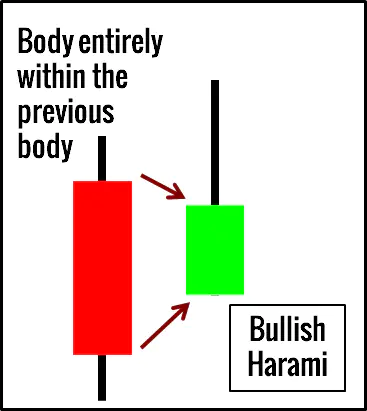
The first bar of the Harami candlestick pattern represents an exhaustive move. It is an unsustainable thrust in the direction of the trend.
The second bar is a quiet churning of the market that’s preparing to reverse. See it as a window of opportunity.
The best Harami patterns should be triggered quickly. There should not be much followthrough in the direction of the first candlestick. If the market pushes decisively beyond the first candlestick of the Harami, skip it.
#2: Trend Channel
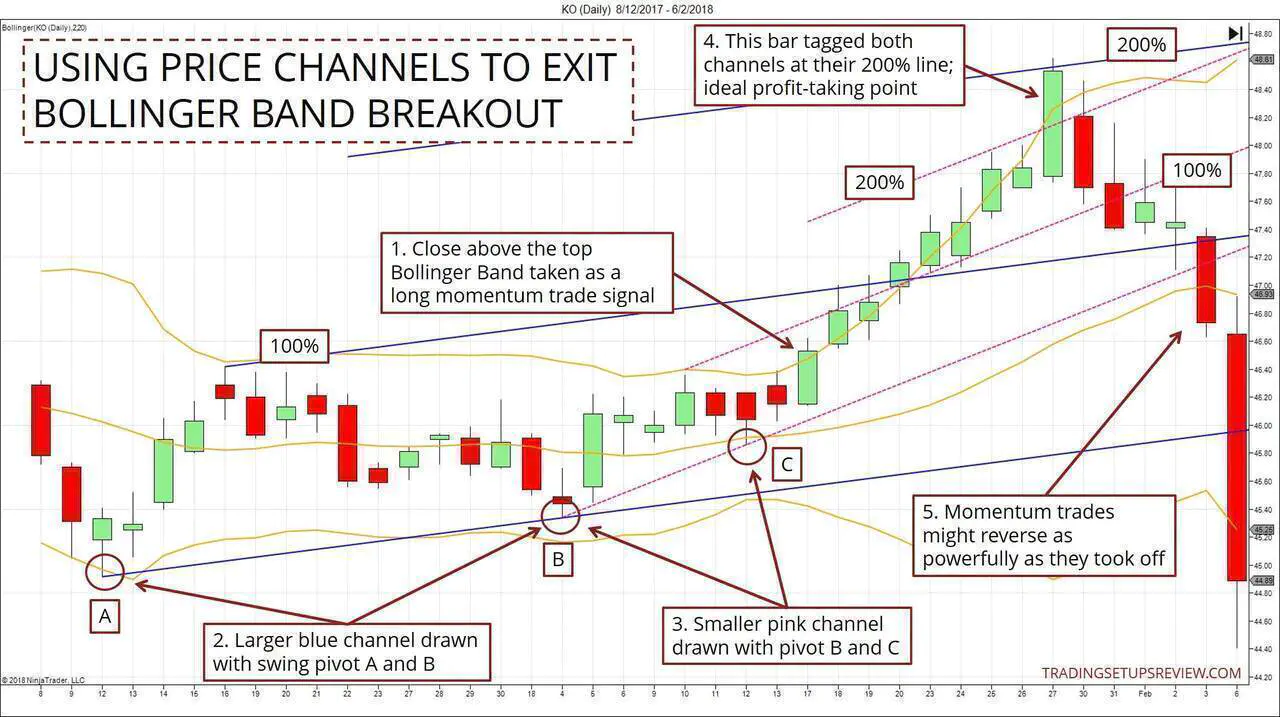
We are aiming for a trend reversal in this strategy.
A trend line helps to track and confirm a trend. After all, you cannot trade a trend reversal without a trend.
You can also expand the trend line into a trend channel.
The channel lines (e.g., 100%, 200%, 300%) then acts as the price action equivalent of overbought and oversold levels. Look for reversal opportunities when the market tests or exceeds the 200% line.
Note to course students: Valid pivots are used for drawing the trend channels.
#3: MACD Classic Divergence
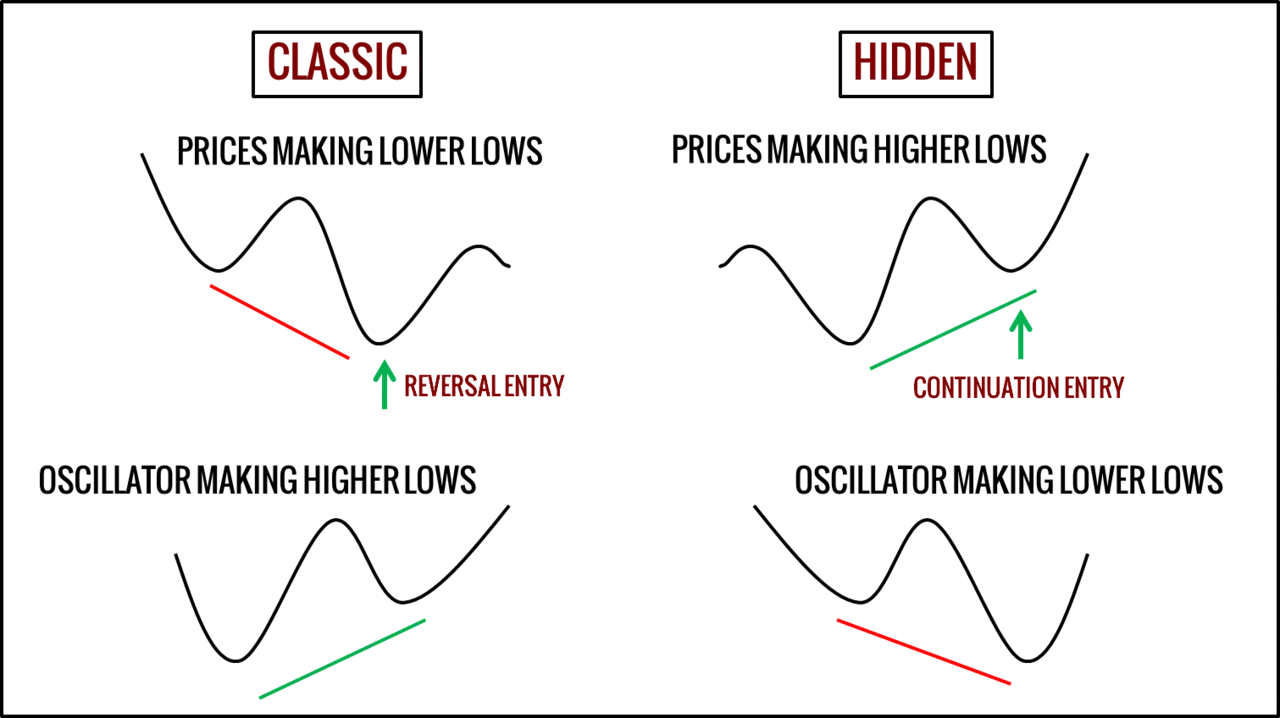
To be clear, we are interested in the classic divergence on the left of the diagram.
A price divergence is one of the best ways to use trading oscillators. It forces you to use your favorite indicator together with price action.
The best divergences are apparent. You shouldn’t need to strain your eyes to spot them.
You can look for divergences with the MACD line or its histogram. In this article, we will focus on price divergences with the MACD histogram.
Harami Reversal Trading Rules
Short Setup
- Bearish Harami at the bull trend extreme, preferably overlapping with a bullish channel line
- Bearish price divergence with the MACD histogram
- Sell as the market moves below the second bar of the Harami pattern
Long Setup
- Bullish Harami at the bear trend extreme, preferably overlapping with a bearish channel line
- Bullish price divergence with the MACD histogram
- Buy as the market moves above the second bar of the Harami pattern
Harami Reversal Trading Examples
Bullish Harami Example
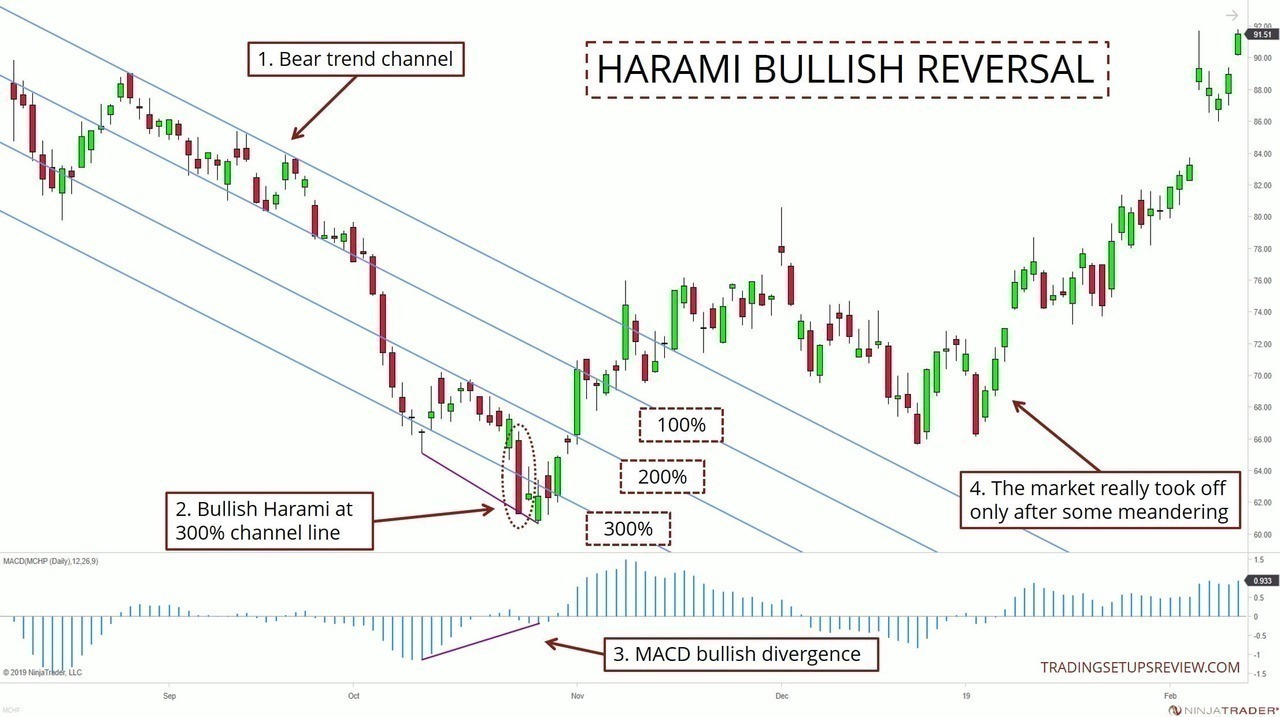
- The market was in a clear bear trend. It plummeted past the 200% line and seemed to have found support at the 300% line. A market that’s testing the 300% line has a high chance of being overextended. Hence, it was reasonable to consider a bullish reversal setup.
- This bullish Harami candlestick pattern overlapped with the 300% line. It offered an excellent opportunity to take on a bullish position with limited risk.
- The MACD divergence gave further support for a long setup.
- After breaking the bearish trend line, the market meandered for a period. Eventually, a bullish trend unfolded.
Bearish Harami Example
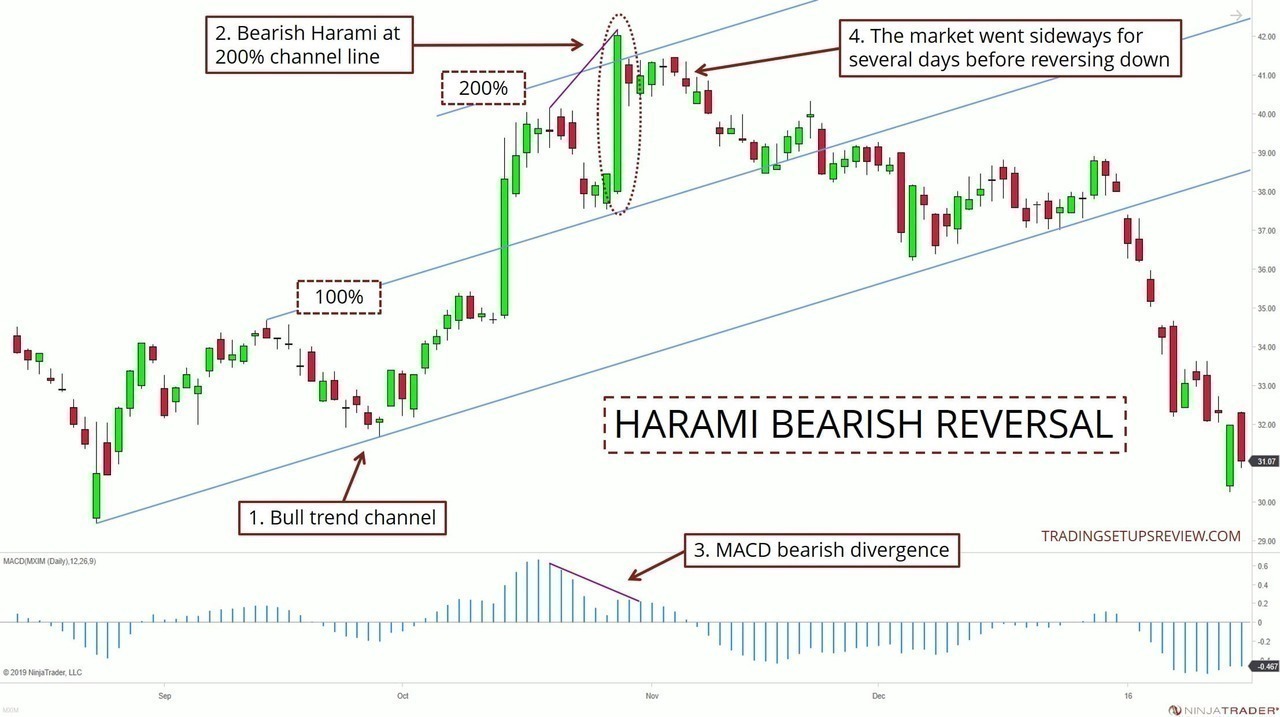
- The market was in a dominant bullish trend. Using the main swing pivots, you can draw a bullish trend channel.
- This bearish Harami overlapped with the 200% line, suggesting an overextended bull trend. On top of that, this Harami candlestick pattern had an excellent form. Its first bar was a wide-range bullish trend bar that was likely exhaustive.
- A bearish MACD divergence was easy to spot.
- The Harami setup was not triggered immediately. However, the market did not follow through with the bullish thrust as well. After several days of congestion, the market broke down and reversed into a bearish trend.
Conclusion
The Harami is a short term price trigger that includes an exhaustive thrust bar. The trend channel offers context from a price action angle. The MACD divergence relies on the concept of price momentum.
Having a variety of tools amplifies the effectiveness of a trading strategy.
But do not clobber every trading tool and pattern together to form your strategy. Instead, be selective of what you add to your charts.
And most importantly, master each individual tool before combining them.