This website or its third-party tools use cookies which are necessary to its functioning and required to improve your experience. By clicking the consent button, you agree to allow the site to use, collect and/or store cookies.
Please click the consent button to view this website.
I accept
Deny cookies Go Back
  • Price Action Trading Course – 50% Off Ends 29 June
  • Trading Setups
  • Topics ↓
    • Price Action Trading
    • Day Trading
    • Trader Development
    • Site Map
  • Trading Resources
    • TSR Trading Guides
    • Trading Journal Software
    • Our Partners
    • Support Us
  • Member Login

Trading Setups Review

Trading Strategies, Guides, and Articles for Active Technical Traders

Forex Tester 5 - Software for traders by traders
You are here: Home / Trading Setups / Gimmee Bar Trading Strategy

Gimmee Bar Trading Strategy

By Galen Woods in Trading Setups on December 10, 2013

The Gimmee bar is a classic entry pattern for a sideways market shared by Joe Ross – an experienced trader and educator. He is the author of several well-known trading books including Trading by the Book and Trading by the Minute.

This trading strategy looks for a reversal down from the top of a trading range, or a reversal up from the bottom of the trading range.

Trading Rules – Gimmee Bar

Long Trading Strategy

  1. Prices falling within a trading range
  2. Price must tag the lower Bollinger Band
  3. Wait for a bar that closes higher than open (This is the Gimmee bar.)
  4. Buy one tick above Gimmee Bar

Short Trading Strategy

  1. Prices rising within a trading range
  2. Price must tag the upper Bollinger Band
  3. Wait for a bar that closes lower than open (This is the Gimmee bar.)
  4. Sell one tick below Gimmee Bar

Important Trading Exceptions

Joe Ross warned against trading Gimmee bars with any of the following traits:

  • The Gimmee bar overlaps or is close to the moving average.
  • The Gimmee bar has a wide range compared to the previous bar.
  • The bar after the Gimmee bar gaps and opens beyond the range of the Gimmee bar.

Gimmee Bar Trade Examples

Winning Trade – Gimmee Bar

Gimmee Bar Winning Trade
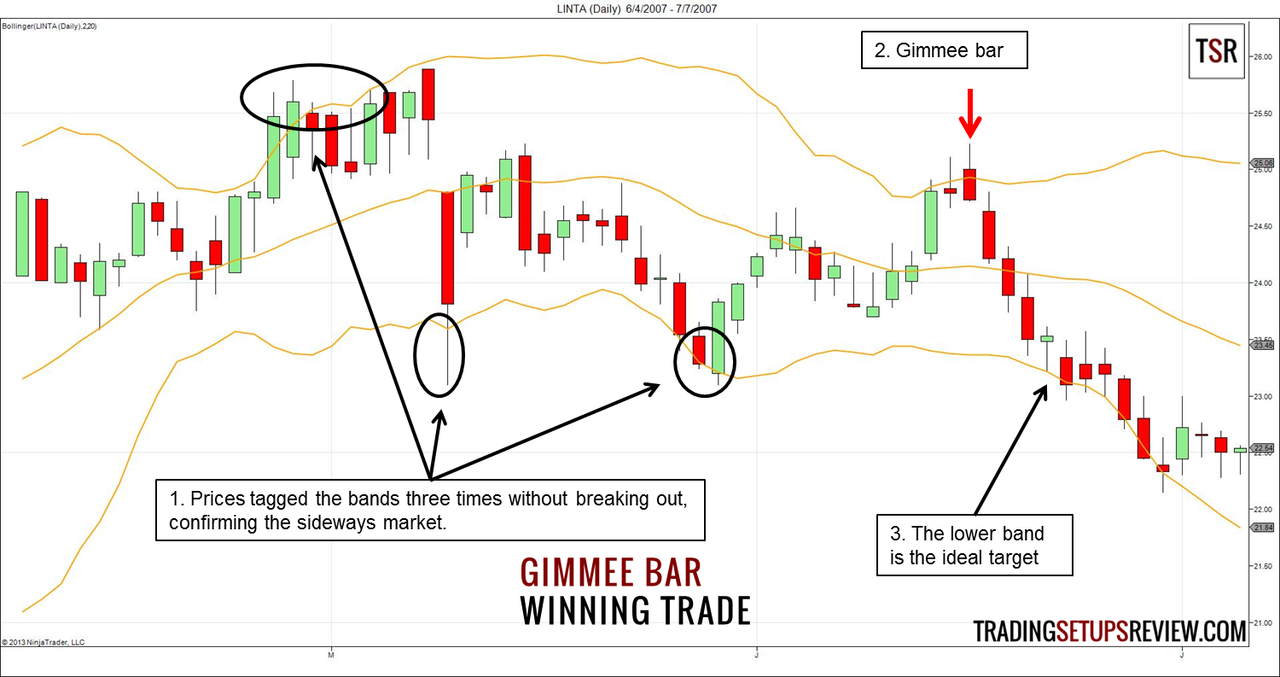
This chart shows the daily price bars of Liberty Interactive. This Gimmee bar achieved more than what we expected and started a whole new downtrend.

  1. Prices tagged the Bollinger Bands three times without breaking out, confirming a sideways market.
  2. Prices touched the upper Bollinger Band. Two bearish reversal bars emerged. Both were Gimmee Bars, but the market only triggered the second one.
  3. Prices moved quickly down to the lower Bollinger Band, which was the ideal target for bearish Gimmee bars.

Losing Trade – Gimmee Bar

Gimmee Bar Losing Trade
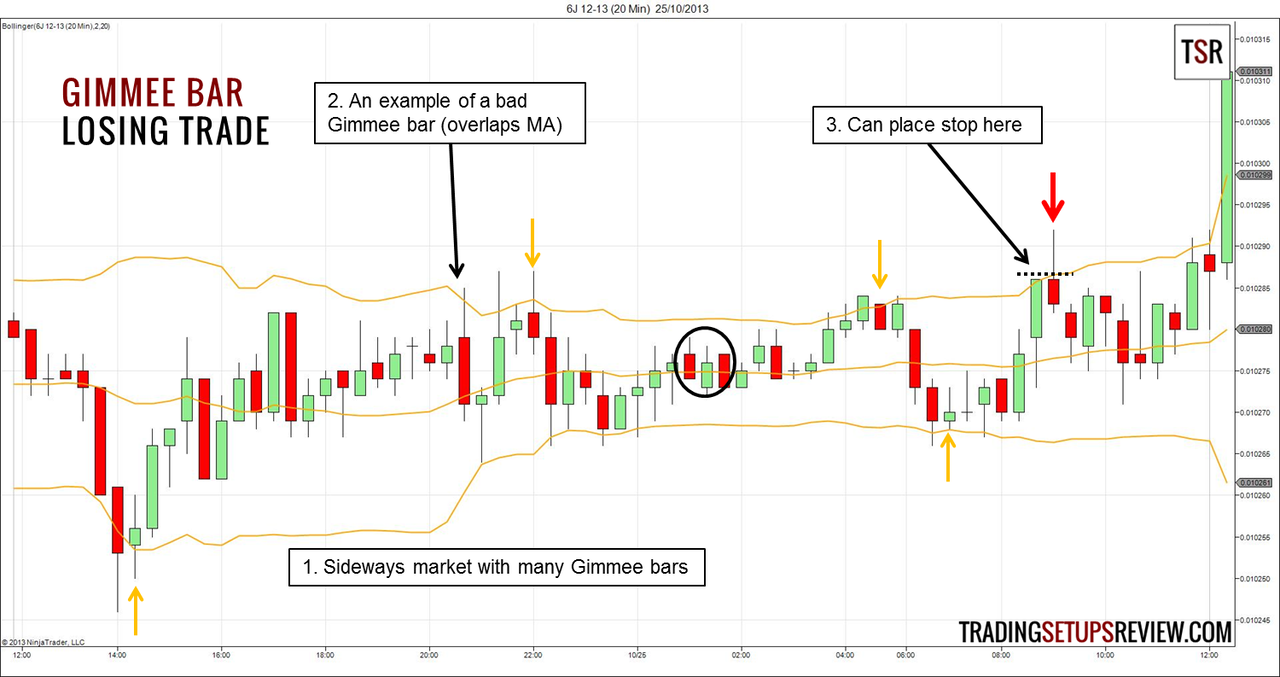
This is a 20-minute chart of 6J, the JPY/USD futures contract.

There are many profitable Gimmee bars here, but we are focusing on the failed instance.

  1. This sideways market had many Gimmee bars as marked out by the gold arrows.
  2. This Gimmee bar touched the moving average. According to the exceptions mentioned, we should not take this trade.
  3. The last Gimmee bar before the upside break-out failed after tangling with the moving average for a while. For Gimmee Bars that are also reversal bars, consider placing your stop-loss just above the high of the previous bar (dotted line). Doing so can improve your reward-to-risk ratio.

This failed trade reminds us that the longer a sideways market lasts, the more likely a break-out will succeed.

Moreover, it occurred shortly after the Tokyo opening when we expect greater volatility.

Review – Gimmee Bar Trading Strategy

This trading strategy combines Bollinger Bands with price action to take range-bound trades.

The trickiest part of this trading setup is to confirm a sideways market.

If the market is in a trading range, you can use a reversal bar pattern to aim for consistent small profits. Candlestick reversal patterns should work well too.

Range-bound trading aims for smaller but more consistent profits. However, you should still pay attention to your reward-to-risk ratio.

If prices are tightly congested (narrow Bollinger Bands), you have limited profit potential.

Nonetheless, in a sideways market, prices should bounce off the Bollinger Bands without pushing much beyond them. Hence, tighter stops are often possible and can improve the reward-to-risk ratio.

The three critical exceptions Joe Ross highlighted extends beyond this trading strategy. They describe price action that does not bode for trade entries. You will find those exceptions helpful for other trading strategies as well.

A last note for day traders. The time of the day is important. Avoid high-volatility periods during which range breakouts are more likely.

Read more about Bollinger Bands, Trading Range

If Trading Setups Review has helped you trade better, please support us on Ko-fi.

Support me on Ko-fi

Thank you for being awesome.

You can also check out other ways to support us here.

Or, please continue exploring what we have to offer…

How to Keep Trading Records as a Discretionary Price Action Trader

The Low Volume Hint to Explosive Moves

Your First Guide To Trading With The Volume-Weighted Average Price (VWAP)

Day Trading For Dummies Book Review

7 Zen Quotes for the Consistent Trader

Comments

  1. Cherry says

    September 4, 2018 at 2:05 PM

    Any advice for stop losses? I use a 2:1 risk ratio, so for narrow bands I find the market tends to hit my stop loss and if I didn’t implement a SL i would have made money. So if trading narrow bands should I change my ratio to 2:2?

    Reply
    • Galen Woods says

      September 7, 2018 at 9:20 AM

      You shouldn’t set your stop-loss based on a reward to risk ratio as that approach disregards price action. You can read this tutorial on setting stop-loss and this guide on volatility stop-losses.

      Reply
  2. SATISH says

    February 15, 2019 at 11:48 PM

    IN THE WINNING TRADE THAT IS SHOWN, THE BAR AFTER THE GIMMEE BAR MEETS THE 3RD CONDITION ABSOLUTELY I.E.THE FOLLOWING BAR OPENS WITH A GAP. DOES THAT MEAN THAT THE WINNING TRADE WAS MORE OF LUCK RATHER THAN A REAL WIN?

    ALSO THE GIMMEE BAR HAS A WIDE RANGE THAN THE PREVIOUS BAR…SO CAN YOU STILL LABEL IT AS A GIMMEE BAR?

    Reply
    • Galen Woods says

      February 20, 2019 at 10:06 AM

      The gap in the third condition (under trading exceptions) refers to a wide gap that goes outside the range of the previous bar. In this case, although there’s an opening gap, the Gimmee bar opened within the range of the previous bar.

      As for a Gimmee Bar with a wider range, you can still label it as a Gimmee bar, but you should recognize that they might be inferior and hence be more selective when you consider them.

      Reply
  3. SATISH says

    February 20, 2019 at 10:07 PM

    MANY THANKS. WITH DUE RESPECT GALEN, IT IS THE BAR AFTER THE GIMMEE BAR THAT I WAS REFERRING TO (AS WELL AS THAT MENTIONED IN THE EXCEPTIONS), IT HAS OPENED WITH A GAP DOWN & ONLY THE HIGH TICK IS WITHIN THE RANGE OF THE GIMMEE BAR. SINCE THAT FALLS IN THE EXCEPTIONS & SO DOES IT WARN OF AN INFERIOR TRADE WHICH SHOULD BE AVOIDED. IN THIS CASE I WISH TO KNOW & LEARN IF THIS WAS A WARNED TRADE & WINNING WAS A MATTER OF LUCK THAT THE MARKET WENT THAT WAY. I DO ACKNOWLEDGE THAT THIS IS A PERFECT SCIENCE & THAT MARKETS HAVE THEIR OWN MIND…

    Reply
    • Galen Woods says

      February 25, 2019 at 9:45 AM

      Hi Satish, I get what you mean now, and I apologize for misunderstanding your question earlier.

      The 3rd exception can only apply if you are using a limit order that can be canceled in the case of an opening gap. However, I’m used to entering with stop orders and have presumed the same in the examples above. This is why I’ve implicitly disregarded the 3rd exception in the examples.

      More importantly, you can only judge if it’s just a lucky trade within the context of your entire trading strategy. Mainly, we will want to know if this trade is consistent with other trades taken. The rules above are ultimately guidelines and you can decide how much weight to give to each exception. With a single trade, it’s not possible to judge the factor of luck.

      Nonetheless, within my price action framework, this trade was worth taking as it was also testing a resistance level projected by congestion zones to the left (first circle). Congestion zone is a pattern I covered in-depth in my .

      Reply
  4. Bilbo says

    March 27, 2020 at 6:55 PM

    Thank your your teaching and abundant contents of your website.

    How long should I hold stop orders? In My trading setups orders are canceled after not triggered next bars, and in Hikkake trade setup orders are canceled after not triggered three bars.

    Reply
    • Galen Woods says

      March 31, 2020 at 10:55 AM

      Thank you for your comment! I expect my orders to be triggered by the next bar, especially for failure setups like this one. If not, I cancel the order. But this is not a fixed rule and you can adapt it to the price action you observe.

      Reply

Leave a Reply Cancel reply

Your email address will not be published. Required fields are marked *

Trading Course Banner

Search Trading Setups Review

Recommended For You

10 Pullback Trading Strategies You Must Know

Get Rid of Overtrading Once and For All

How To Lay A Solid Foundation For Price Action Trading

A Simple Inside Bar Day Trading Strategy Using YM Futures

Looking For The Perfect Trading Strategy?

4 Trading Myths About The Moving Average

Double Inside Bar Pattern For Intraday Trading

Top Trading Books

Top 10 Volume Trading Books

7 Forex Trading Books To Get You Started

18 Trading Psychology Books To Help You Trade Better

Top 10 Price Action Trading Books

7 Trading Books For Your Library


If Trading Setups Review has helped you trade better, please consider supporting us on Ko-fi.

Support me on Ko-fi

Or, check out other ways to support us here.

Thank you for being awesome.


Get a Free Course Chapter from Galen Woods' Day Trading With Price Action Course [PDF]

Plus, our latest trading guides and tips in right your inbox.

Trading Setups Review

  • Support Us
  • Contact Us
  • About Us
  • Privacy Policy
  • Affiliate Disclaimer
  • Full Risk Disclosure

Learn More

  • Day Trading With Price Action Course
  • TSR Trading Guides
  • Trading Setups
  • Trading Articles
  • Trading Books
  • Site Map

Futures and forex trading contains substantial risk and is not for every investor. An investor could potentially lose all or more than the initial investment. Risk capital is money that can be lost without jeopardizing ones financial security or life style. Only risk capital should be used for trading and only those with sufficient risk capital should consider trading. Past performance is not necessarily indicative of future results.


The website contents are only for educational purposes. All trades are random examples selected to present the trading setups and are not real trades. All trademarks belong to their respective owners. We are not registered with any regulating body that allows us to give financial and investment advice.


Trading Setups Review © 2012–2022

Anti-Climax Pattern - Free Course Chapter

Learn a new powerful price pattern today!

Download for free now.