Hikkake Trade Setup
By Galen Woods ‐ 8 min read
Hikkake means trap, trick or ensnare. This trade setup seeks to profit from false breakouts of inside bar. It traps traders as their inside bar trades fail.
Hikkake means to trap, trick, or ensnare. Dan Chesler discussed this candlestick trading setup in the Active Trader Magazine in April 2004 (“Trading False Moves with the Hikkake pattern”). Primarily, this price pattern seeks to identify inside bar breakouts and profit from their failures.
An inside bar is a price bar that is entirely within the range of the preceding price bar. Inside bars are typical on price charts of most timeframes.
While you’ll often find inside bars in congested markets, they also offer a low-risk entry point for price action traders. The contracted range of an inside bar offers a natural tight stop-loss.
Hence, inside bar breakouts seem attractive. However, if you are patient and focus on identifying false breakouts, you might be able to find more reliable trading setups in the form of Hikkakes.
In a nutshell, the Hikkake pattern offers a systematic approach to trading false inside bar breakouts.
Hikkake Trading Rules
The diagram below shows the essential parts of a bullish Hikkake setup.
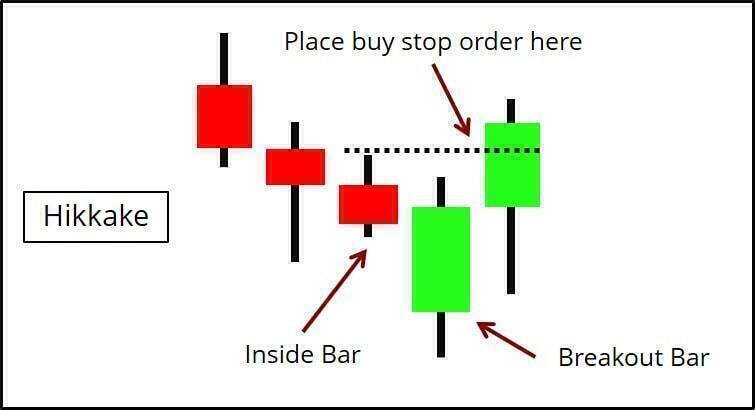
Rules For Long Setups
- An inside bar
- The next bar has a lower high and a lower low (This is the breakout bar signifying a bearish breakout of the inside bar.)
- Place a buy stop order at the high of the inside bar
- Cancel the order if not triggered after three bars
Rules For Short Setups
- An inside bar
- The next bar has a higher high and a higher low (This is the breakout bar signifying a bullish breakout of the inside bar.)
- Place a sell stop order at the low of the inside bar
- Cancel the order if not triggered after three bars
Hikkake Trading Examples
Here, you will find a variety of Hikkake trading examples, including an intraday session. I’ve also included a losing trade for a balanced discussion.
In Example #1 and #3, we applied the Price Action Pattern Indicator to mark out Hikkake patterns. Check it out if you want a convenient way to highlight different price patterns with a trend filter.
Example #1: Multiple Bullish Hikkake Patterns
The chart below shows the daily candlestick of the SPY ETF.
In this example, we’ll take a look at how the bullish Hikkake performs as a pullback entry mechanism in a rising market. There were three Hikkakes, and each took on a different form.
Chart Legend
- Below each breakout bar, you’ll find a green arrow. (Breakout bar refers to the bar after the inside bar.)
- The dotted line is the level of the buy stop order for each setup.
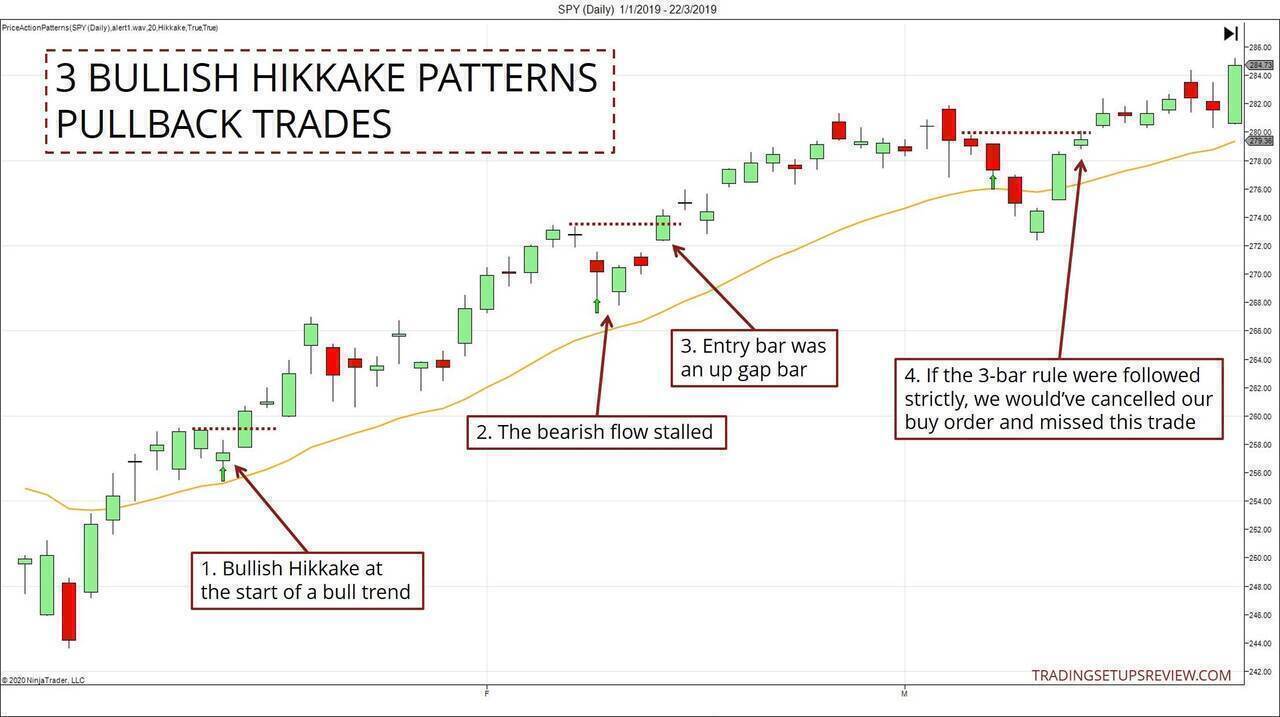
- This was the first bullish Hikkake. The bullish sentiment was apparent from the consecutive bullish candlesticks. Each time a bar opened lower, it managed to close higher.
- This second pattern fitted better with the underlying premise of the Hikkake pattern. Recall that Hikkake means ensnared. The bearish gap that accompanied the breakout bar implied that there were bearish traders trapped into a short trade.
- Moreover, the entry bar that triggered our buy stop order showed significant momentum in the form of an up gap.
- The market triggered the entry of this final Hikkake setup after four bars. However, technically, we would’ve already canceled the buy stop order after waiting for three bars. Hence, this setup did not conform to our trading rules above. But does it mean that it’s a wrong setup?
Very often, our goal is not to follow a set of trading rules strictly. Instead, we aim to use our trading rules as a starting point and have good reasons for overriding them.
In this case, acceptable reasons to overlook the three-bar waiting period include:
- The strong bull trend
- The support from the gaps formed during the development of the previous bullish Hikakke pattern.
Example #2: Winning Bearish Trade
This is a daily candlestick chart of Cairn Energy listed on the London Stock Exchange (LSE).
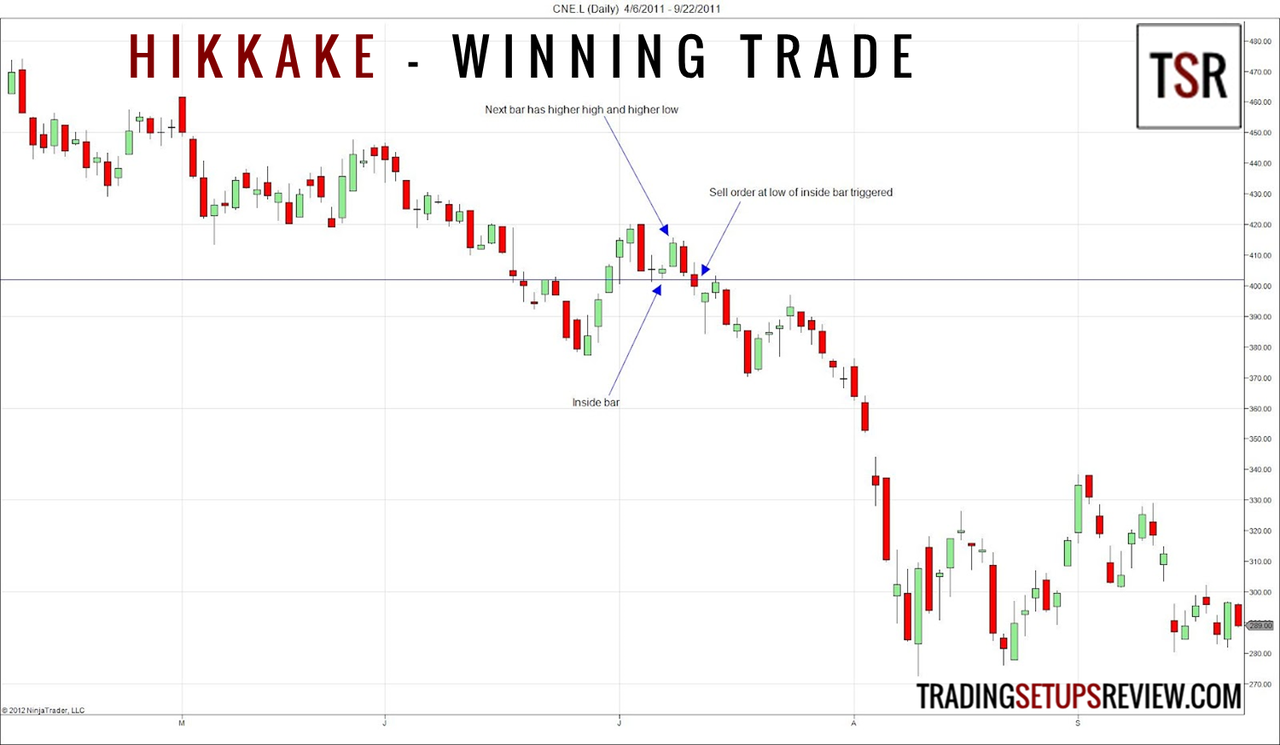
- This was an inside bar with a small price range. (A bullish Doji.)
- It was followed by a bar with a higher high and higher low. This breakout bar set the stage for a short Hikakke setup.
- We placed a sell order at the low of the inside bar. The market triggered the sell stop order two days later, and the stock plummeted.
This was an excellent trade.
- There was a downward trend followed by a series of five bullish bars, which gave reasonable hope to the bulls.
- Hence, bullish traders saw the inside bar as a low-risk entry for a possible trend reversal.
- While the inside bar had excellent follow-through (i.e., the breakout bar was substantial), it did not even test the bearish trend bar from three bars before.
When the market fell and triggered our Hikkake setup, the price went south and pushed the trapped bullish traders out of the market.
The hope for a bullish reversal was strong. You could tell by observing how prices rose momentarily to test our entry price level two days later. When that test failed too, the market resumed its downward trend.
Example #3: Intraday Hikkake Pattern
In Example #1, we filtered the Hikkake pattern signals with a moving average. That helps us to focus on entries that are aligned with the trend.
However, even counter-trend Hikkake patterns are valuable for the price action analyst. This intraday trading example shows how to make use of inside bar breakouts as an analytical tool.
A reminder - the arrows point at the breakout bar of each Hikkake pattern.
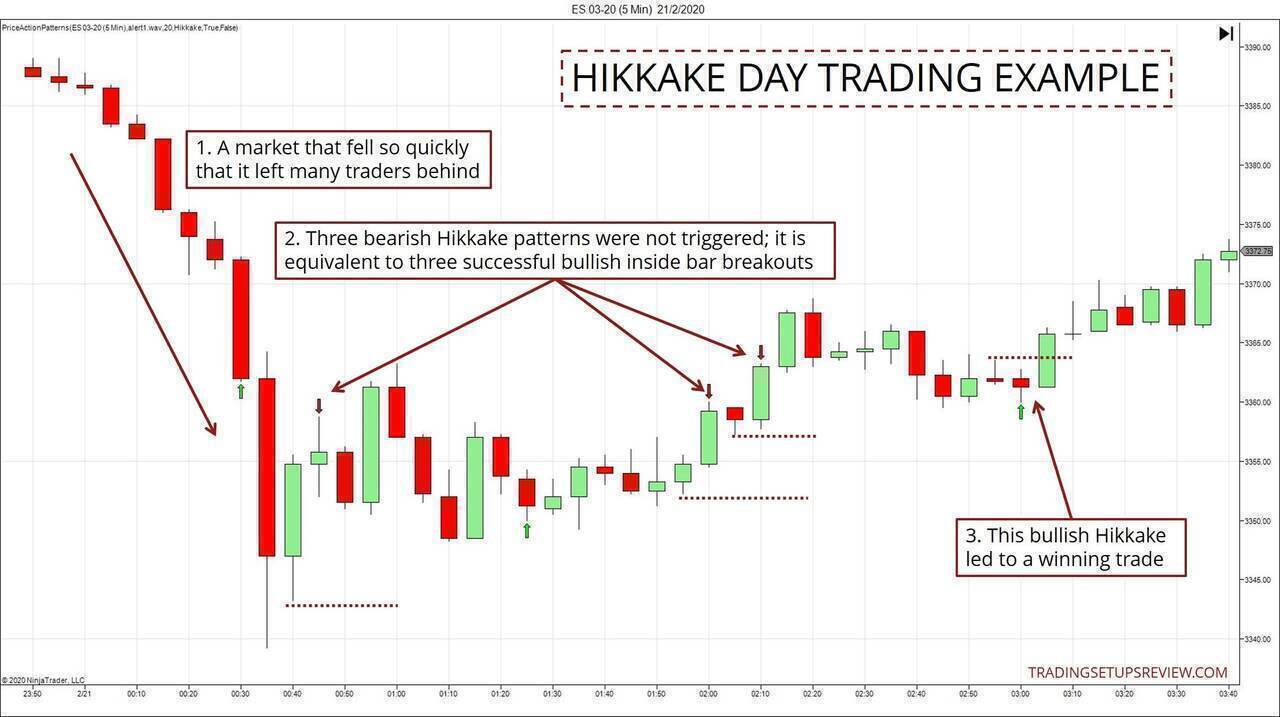
- In this 5-minute ES futures session, the market fell swiftly, offering no pullbacks for traders join in. This sense of missing out on this dramatic bearish action was critical in setting the context for our Hikkake setup later.
- The market stalled and drifted sideways. Within this congestion area, there were three bullish inside bar breakouts. However, none of them offered a short Hikkake entry as each breakout was successful. These consecutive successful breakouts boded well for subsequent bullish setups.
- Finally, a bullish Hikakke presented itself. Although the profit potential was not fantastic, the reward-to-risk ratio was excellent. Also, there was little adverse excursion.
The context was ideal for a bullish Hikkake setup.
The earlier market drop created a sense of missing out among traders. They were eager to find a short setup to profit from the bearish market they had missed out on. This context enhances a bullish Hikkake setup that aims to trap bearish traders.
Example #4: Losing Bullish Trade
This example contains a daily candlestick chart of International Power PLC.
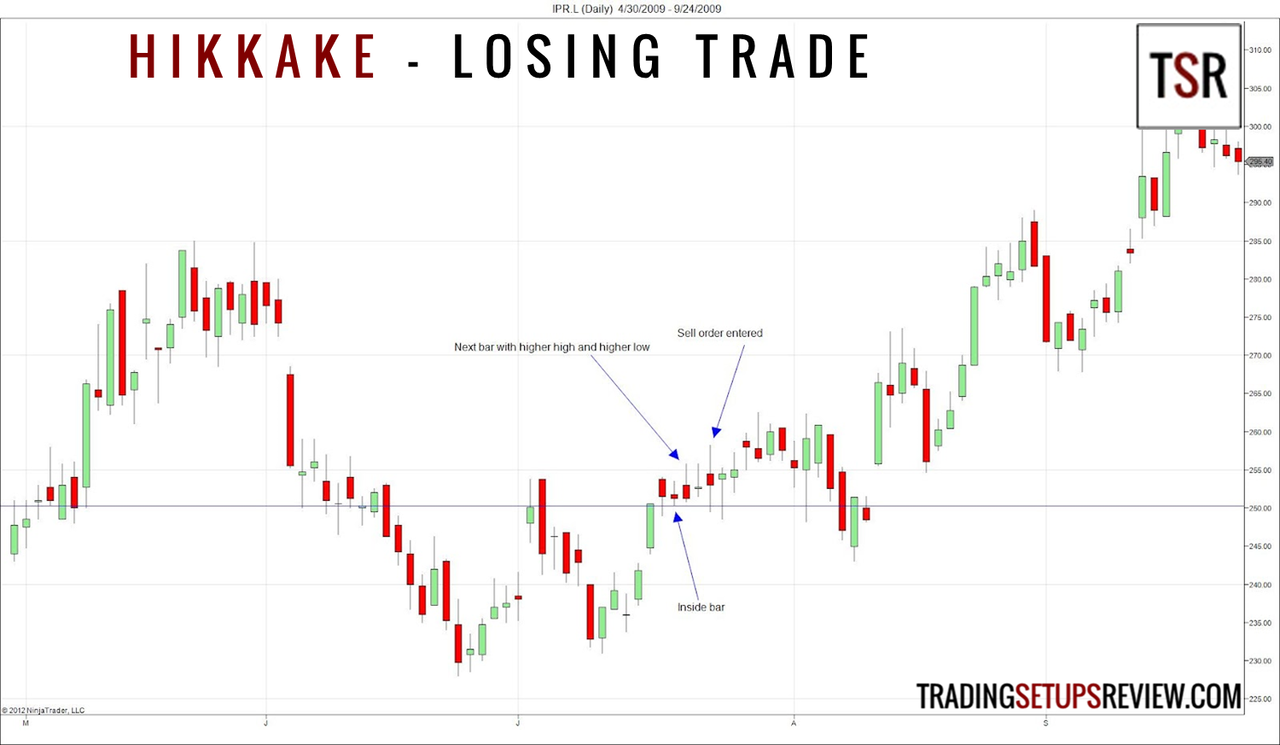
- This was a bearish inside bar.
- It was followed by a breakout bar with a higher high and higher low. However, this breakout bar was disappointing, and it ended up as a bearish reversal bar.
- We placed a sell order at the bottom of the inside bar.
An outside bar triggered the sell order. But the market drifted upwards after that, and we lost the trade.
There were two main reasons to avoid this trade.
First, the market broke a bear trend line (not drawn) before forming a higher low (six bars before the inside bar). This formation hinted at a bullish context, which was not ideal for short setups.
Next, for a short Hikkake to succeed, we need sufficient traders betting on a bullish breakout of the inside bar. However, both the inside bar and the bar before it was bearish. Hence, traders were unlikely to bet strongly on a bullish breakout.
Moreover, the market looked like it was forming a double top at that point. This was another factor that could have deterred bullish traders from entering.
Without the commitment of bullish traders, this short Hikkake setup was not optimal.
Review - Hikkake Trade Setup
This trade setup highlights the concept of trapped traders.
Where do our profits come from? We always profit at other traders’ expense. This is a fact of the market; a zero-sum game.
The inside bar has a smaller range and hence entailed a lower risk. To many traders, an inside bar represents a tempting low-risk opportunity.
The Hikkake pattern then sets up to enter only when an inside bar breakout fails. Only when these traders have to exit with a loss.
Understanding the concept of trapped traders will help you find the best Hikkake trading setups, which occurs when the market has trapped many breakout hopefuls.
(Read: 4 Ways to Profit from Trapped Traders)
However, an inside bar is also the result of a contraction in range. Hence, inside bars may lead to a tight trading range where price action becomes unpredictable.
This explains why this setup often fails with an outside bar, which shows strength in both directions. Remember, the context gives the edge.
Finally, review the three critical aspects of this strategy:
- Wait for a breakout.
- Wait for its failure (as signaled by price action) to trigger a trade.
- But don’t wait for too long; the best failure trades come soon after the breakout.
This is a useful template you can apply to find false breakouts of any price pattern, and not just inside bars.
For instance, you can wait for a breakout of a support and resistance level and look for trading opportunities if there are any sudden failures.
Learn More
- Trading Reversals With The Modified Hikkake Pattern - a slightly different Hikkake for trading reversals
- Trading Candlestick Patterns with a Moving Average - a simple trading strategy that uses candlestick patterns
- Trading False Moves With The Hikkake Pattern - Dan Chesler’s original article
Need help identifying the patterns? Check out our NinjaTrader indicator that marks out five price action patterns, including Hikkake.
The article was first published on 23 February 2012 and updated on 27 February 2020.