This website or its third-party tools use cookies which are necessary to its functioning and required to improve your experience. By clicking the consent button, you agree to allow the site to use, collect and/or store cookies.
Please click the consent button to view this website.
I accept
Deny cookies Go Back
  • Price Action Trading Course – 50% Off Ends 29 June
  • Trading Setups
  • Topics ↓
    • Price Action Trading
    • Day Trading
    • Trader Development
    • Site Map
  • Trading Resources
    • TSR Trading Guides
    • Trading Journal Software
    • Our Partners
    • Support Us
  • Member Login

Trading Setups Review

Trading Strategies, Guides, and Articles for Active Technical Traders

Forex Tester 5 - Software for traders by traders
You are here: Home / Trading Setups / Two-legged Pullback to Moving Average (M2B, M2S)

Two-legged Pullback to Moving Average (M2B, M2S)

By Galen Woods in Trading Setups on December 14, 2013

Many price action traders claim that two-legged pullbacks are the most reliable trade setups. The variant we are reviewing today is from Al Brooks, who wrote three tomes on price action trading. These three books are not an easy read, but are extremely informative for price action traders.

In his books, he identified a two-legged pullback to the moving average as one of the best trade setups when there is a strong trend.

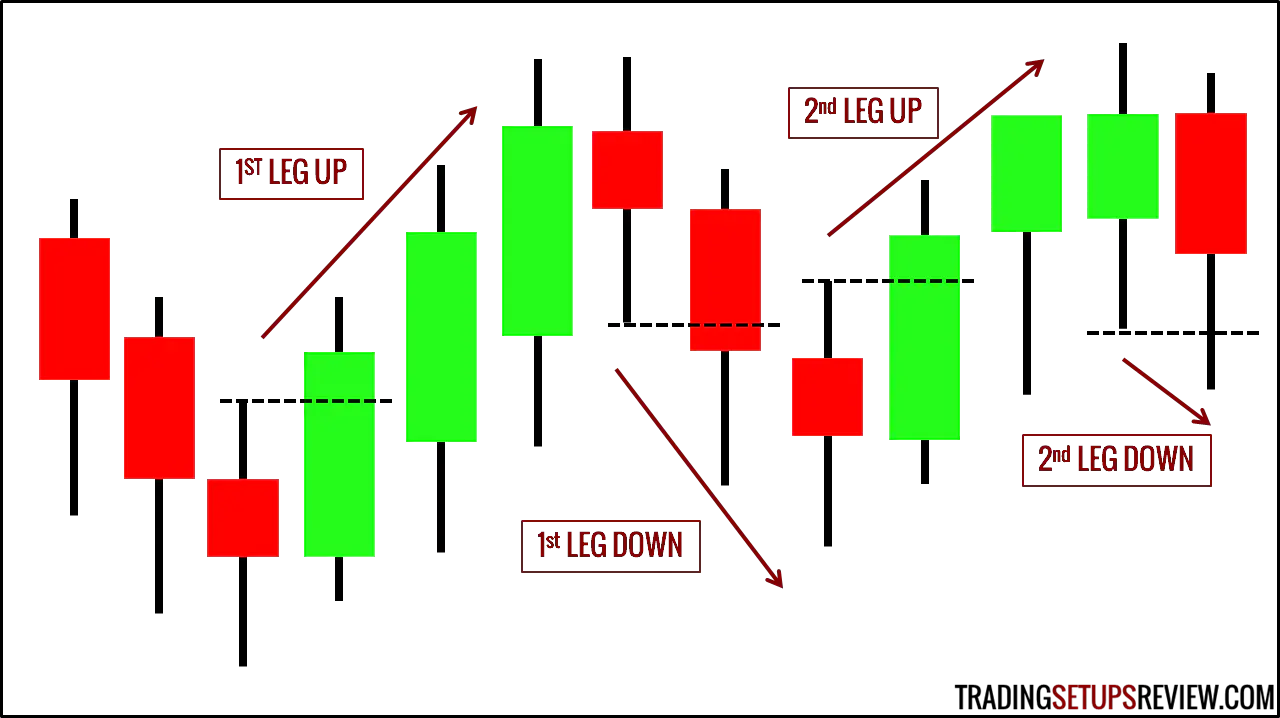
Before we start, let’s have a basic explanation of counting legs. Any bar that goes higher than the previous bar starts a new leg up. Any bar that goes lower than the previous bar starts a new leg down.

Counting Legs Example

Trading Rules – Two-legged Pullback to MA

Long Trading Setup – M2B

  1. Strong up trend
  2. Two-legged pullback down to 20-period EMA
  3. Enter a tick above the bar that tested the 20-period EMA

Short Trading Setup – M2S

  1. Strong down trend
  2. Two-legged pullback up to 20-period EMA
  3. Enter a tick below the bar that tested the 20-period EMA

Two-legged Pullback to MA Trade Examples

Winning Trade – M2S

Two-Legged Pullback Moving Average Winning Trade
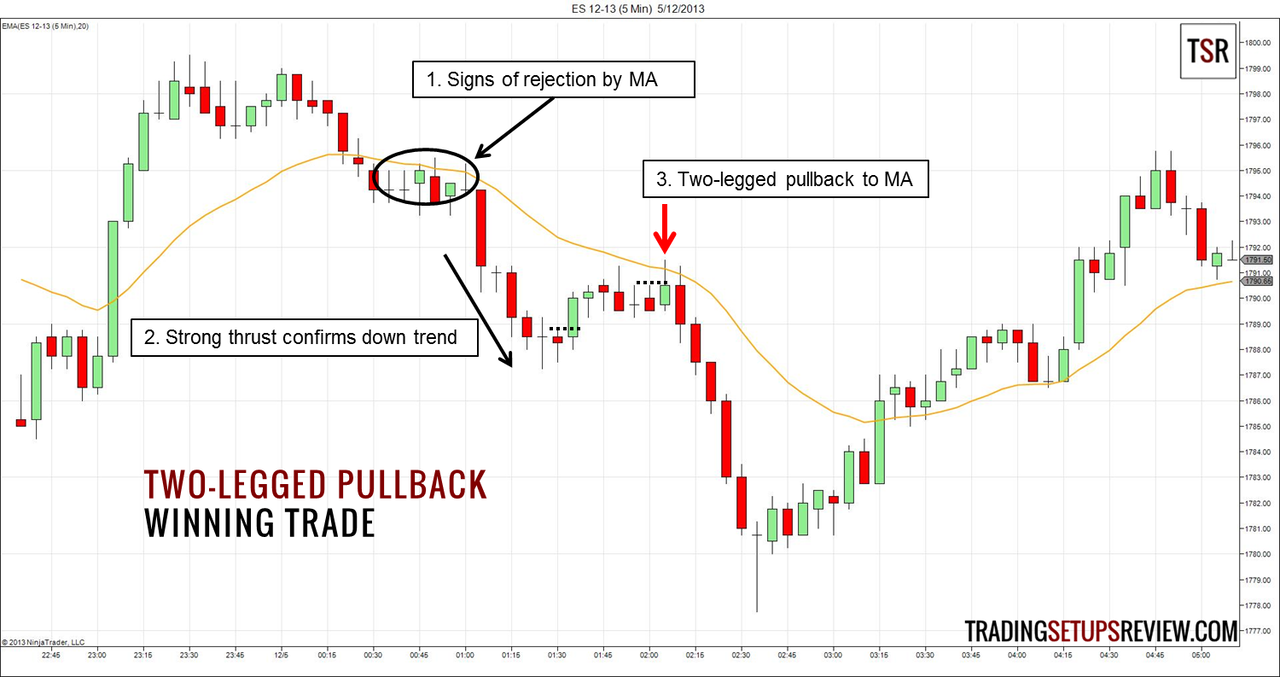
This is 5-minute chart of ES futures contract, which is the main instrument Al Brooks trades. This trade is a beautiful example of a two-legged pullback trade.

  1. After prices crossed below the EMA, it tried to crossed back but was clearly rejected.
  2. The strong downwards thrust confirmed the down trend, which was what we needed before looking for continuation trades.
  3. The two short dotted lines highlight the beginning of each leg up. This two-legged pullback looked good with the long top tails that showed as prices approached the EMA. The long top tails implied selling pressure.

Losing Trade – M2B

Two-Legged Pullback Moving Average Losing Trade
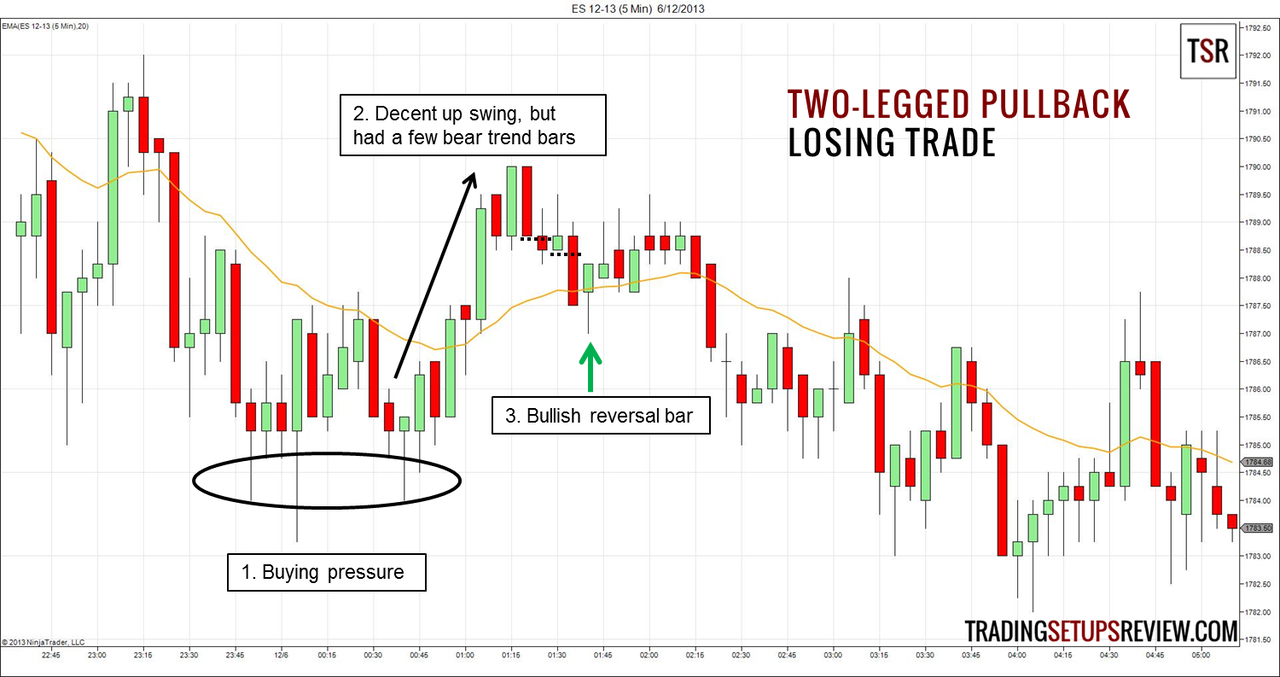
Another session of S&P E-mini futures showing 5-minute bars, which is Al Brook’s recommendation as the sweet spot for day traders.

  1. The day started with swings up and down without a clear direction. However, as prices made new lows, bottom tails emerged, showing buying pressure.
  2. The up swing above the EMA seemed strong as there were eight consecutive bars with higher lows. However, there were three bear trend bars within the swing, which hinted at persistent bears.
  3. Following a two-legged pullback to the EMA, we had a bullish reversal bar as our signal bar. We entered a tick above it but got stopped out after some sideways movement.

A key difference between the losing trade and the winning trade is how certain we were that the market was trending. In the winning trade example, we saw clear rejection from the EMA, which we did not see in the losing example.

Review – Two-legged Pullback to MA

Continuation trades work because the trend traps counter-trend traders. Two-legged pullbacks are more enticing to counter-trend traders and works better as a mousetrap for them.

Hence, in a trending market, the two-legged pullback to the moving average is a simple and high probability trading setup.

The key lies in finding trending markets. Pay attention to signs of a trending market and trade opportunities will present themselves. Very often, you can pay attention to the space between prices and the moving average for a sense of momentum. Two-legged pullbacks that follow strong momentum are better quality setups.

However, very strong trends tend to have single leg pullbacks. If you insist on waiting for two-legged pullbacks, then you must be ready to miss some trades in strong trends.

Also, with regards to counting legs of price movement, there are many nuances that we did not cover. Refer to Al Brooks’ Trading Price Action Trends: Technical Analysis of Price Charts Bar by Bar for the Serious Trader (Wiley Trading) to learn more.


Read more about Moving Average, Price Action Trading, Trading Trend

If Trading Setups Review has helped you trade better, please support us on Ko-fi.

Support me on Ko-fi

Thank you for being awesome.

You can also check out other ways to support us here.

Or, please continue exploring what we have to offer…

10 Trading Rules From Seasoned Traders

2-Period ADX Trend Trading Strategy

3 Moving Average Fake-Out Trade Setups On Weeklies

How I Trade With Only The 2-Period RSI

Day Trading Setup Evaluation Cycle

Comments

  1. Sam says

    May 14, 2015 at 9:21 AM

    Hi Galen,

    First off, congrats on creating a site with such great value. I also highly admire your no-hype, humble exposure.

    If I may add/alter to your commentary on the first chart (and please do feel free to express what your eyes see as mine can fail me at the best of times on occasion).

    In trading everything comes down to context. From the first chart, I can’t see the previous bars and so do not know if this early spike (6 trend bars) on a longer time frame is a climatic move or a break out. Having excess to what pursues through the day, I may have to lean towards the fact that this was a climax.

    Under most circumstances, a spike (esp. as strong as this) tend to retrace for only one leg and fails to reach the MA. It is followed by a channel of some sort which tends to head towards the second target in a measured move. This did not happen over here.

    Now, since we are talking about a two-legged pullback after a strong move, the initial move (spike) was one that fulfilled that criteria. If a good buying point is after two legs down to the MA, at which point here would one decided OR not decide to take a trade on the long side?

    Reply
    • Galen Woods says

      May 19, 2015 at 12:08 PM

      Hi Sam,

      Thanks a lot for your additional commentary on the chart. You have pointed out useful observations.

      To answer your question, I usually focus on the strength of the pullback down. The strength of the pullback down is of course judged with respect to the previous spike (for e.g. retracement %), and other factors like number of bear trend bars and number of consecutive bearish bars. The weaker the pullback, the more likely I will go long.

      Another key is to observe if the intended long entry enjoys price support. (for e.g. an earlier pivot point or the moving average itself.)

      Reply
  2. Sam says

    May 21, 2015 at 10:57 PM

    Hi Galen,

    It makes perfect sense.

    When a move is strong, do you try and make use of the indexes for gauging relative strength or do you play them independently? Whichever you do, what is your reasoning behind it.

    Regards,

    Sam

    Reply
    • Galen Woods says

      May 22, 2015 at 9:54 AM

      I trade them independently as I want to keep things simple. Since focusing on one chart works for me, I prefer not to complicate matters. (I don’t mean that using indices to gauge near-term price action is useless. I know traders who are successful with that approach. It’s a matter of one’s trading style.)

      Reply

Leave a Reply Cancel reply

Your email address will not be published. Required fields are marked *

Trading Course Banner

Search Trading Setups Review

Recommended For You

Trading The Alligator by Bill Williams

John Hill’s Trend Line Theory – Using Trend Lines for Trading Pullbacks

Two-Bar Reversal Pattern Trading Guide

The Golden Cross Moving Average Strategy For Price Action Traders

Bull Flag Price Action Trading Guide

How To Analyze Price Action With Keltner Channel

Hikkake Trade Setup

Top Trading Books

Top 10 Volume Trading Books

7 Forex Trading Books To Get You Started

18 Trading Psychology Books To Help You Trade Better

Top 10 Price Action Trading Books

7 Trading Books For Your Library


If Trading Setups Review has helped you trade better, please consider supporting us on Ko-fi.

Support me on Ko-fi

Or, check out other ways to support us here.

Thank you for being awesome.


Get a Free Course Chapter from Galen Woods' Day Trading With Price Action Course [PDF]

Plus, our latest trading guides and tips in right your inbox.

Trading Setups Review

  • Support Us
  • Contact Us
  • About Us
  • Privacy Policy
  • Affiliate Disclaimer
  • Full Risk Disclosure

Learn More

  • Day Trading With Price Action Course
  • TSR Trading Guides
  • Trading Setups
  • Trading Articles
  • Trading Books
  • Site Map

Futures and forex trading contains substantial risk and is not for every investor. An investor could potentially lose all or more than the initial investment. Risk capital is money that can be lost without jeopardizing ones financial security or life style. Only risk capital should be used for trading and only those with sufficient risk capital should consider trading. Past performance is not necessarily indicative of future results.


The website contents are only for educational purposes. All trades are random examples selected to present the trading setups and are not real trades. All trademarks belong to their respective owners. We are not registered with any regulating body that allows us to give financial and investment advice.


Trading Setups Review © 2012–2022

Anti-Climax Pattern - Free Course Chapter

Learn a new powerful price pattern today!

Download for free now.