A Plain and Simple Trend Line Channel Trading Strategy
By Galen Woods ‐ 9 min read
A simple but useful tool that serves as a jackknife for price action traders. Learn how to use a trend line channel in a complete trading strategy.
Trend line channel - it is a simple tool based on plain ol’ price action. However, with some practice, you can boost your market analysis with this elegant and powerful tool - a pair of lines that highlights the market trend, trade entry, and exit.
What more can a minimalist trader ask for? Or what less can a simple trader seek?
Before you can trade with a trend line channel, you need to know what it is and how to draw it from scratch.
And this is what we will cover in the first section below.
Trend Line Channel - What is it?
The chart below shows a bearish trend line channel in action.
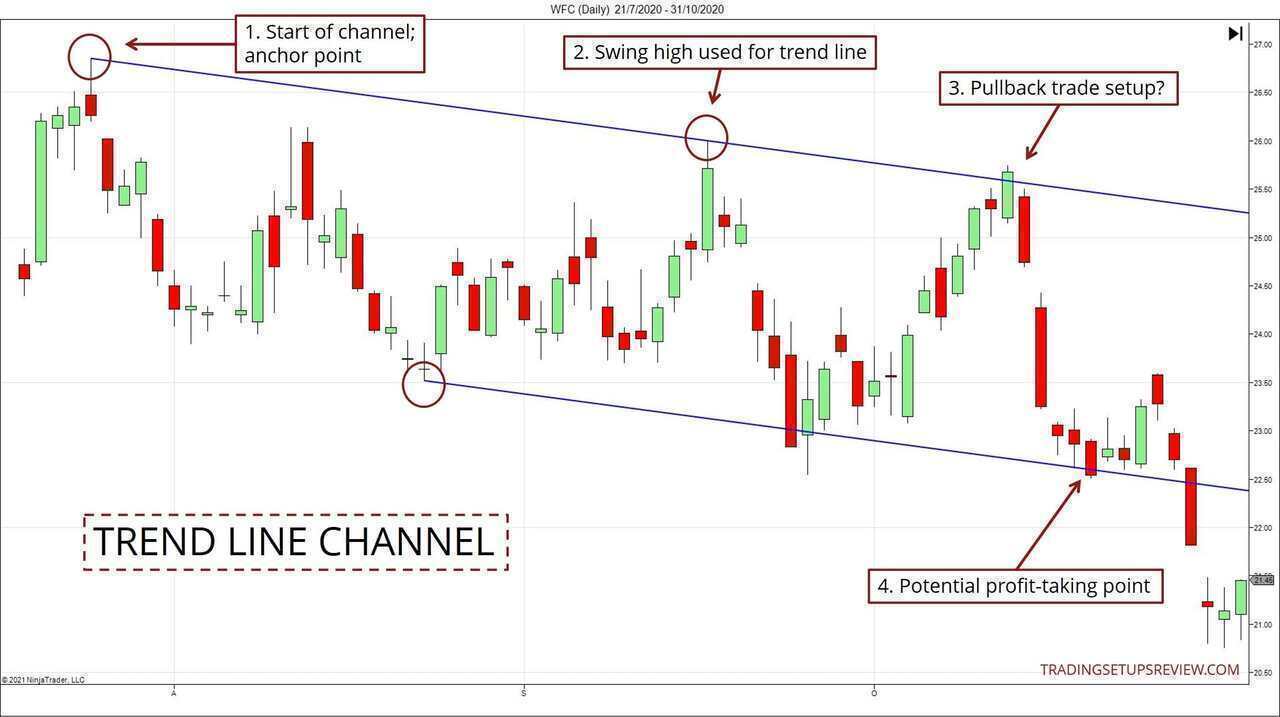
You might not understand this chart example yet, but you will by the end of this tutorial.
Essentially, a trend line channel is a tool with two essential functions:
- Tracks the current trend
- Sets up expectations of the extent of future price movement and volatility as the trend progresses
In a nutshell, a trend line channel offers a comprehensive view of the market price action.
Yet, many traders do not trust trend lines and channels. Why?
Because they see other traders posting trades with perfect trend line channels, but they do not experience the same results themselves.
The problem is this. With hindsight, anyone can draw a trend line channel that always works. Perfect, every time.
However, in actual trading, traders struggle to meet such perfection. Hence frustration ensues.
Bear in mind that a serious trader does not need perfect trend line channels in hindsight.
What we need is a channel that is:
- Consistent with predefined rules (systematic)
- Reliable (but not perfect)
- Drawn and adjusted in real-time as price action forms
As we run through the steps for drawing a trend line channel, you will better understand how it relates to price action.
There are many approaches to drawing price swings, trend lines, and channels. The key is to stay consistent.
Trend Line Channel - How to draw it?
In this tutorial, I’m using the channel drawing and adjusting method described in my trading course.
While the course is aimed at day traders, most of the course, including price action tools like swings, trend lines, and channels, are applicable on all time frames.
This is how we will proceed:
- Mark swings
- Connect swings to form a trend line
- Project the trend line to create a channel
Step #1: Marking Price Swings
Observing market swings is the first step for anyone looking to understand price action.
Price swings allow you to follow what is happening in the market and relate them to the recent past.
This chart below marks out the market swings using only price action. You can see how the price action moves like waves.
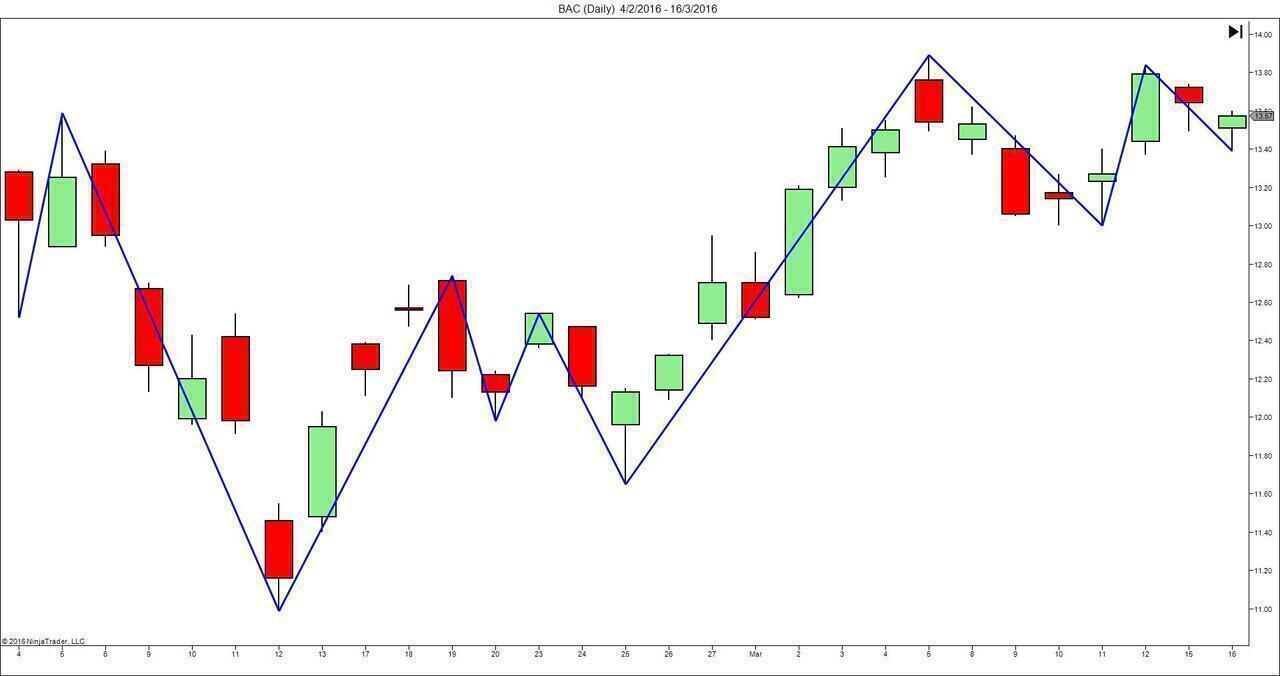
Once you are comfortable with marking out the price swings, you can move on to the next step - drawing trend lines.
Step #2: Drawing Trend Lines
How do you draw a trend line?
Connect the swings to get a trend line. A trend line helps you to make sense of the past (trend).
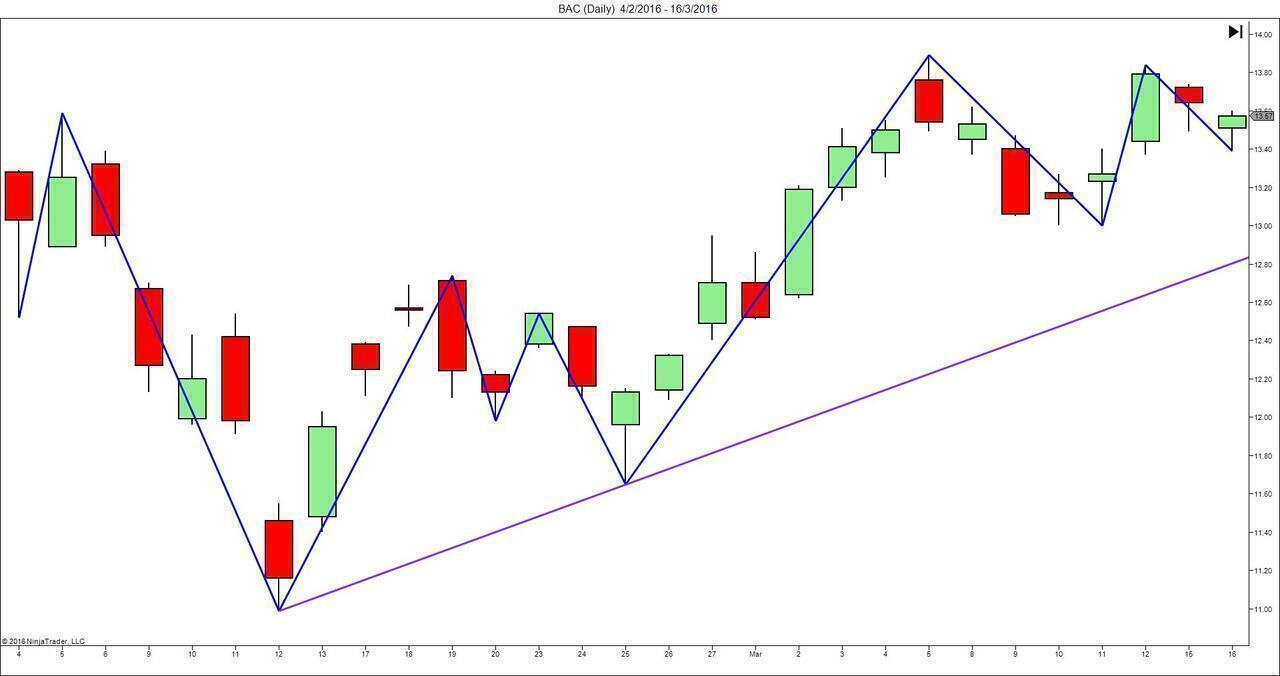
- In the chart above, we connected two swing lows to project an upwards-sloping bull trend line. Note that the second swing low must be higher than the first one.
- If we connected two swing highs, we would have ended up with a downward-sloping bear trend line. In this case, a similar criterion applies, and the second swing high must be lower than the first one.
Step #3: Projecting Channels
Finally, we project a line that is parallel to the trend line. With this step, we will get a price channel.
The main thing to note here is the anchor point of the parallel line (also called the channel line).
Anchor the parallel line to the highest point between the two swing lows you used to draw the trend line.
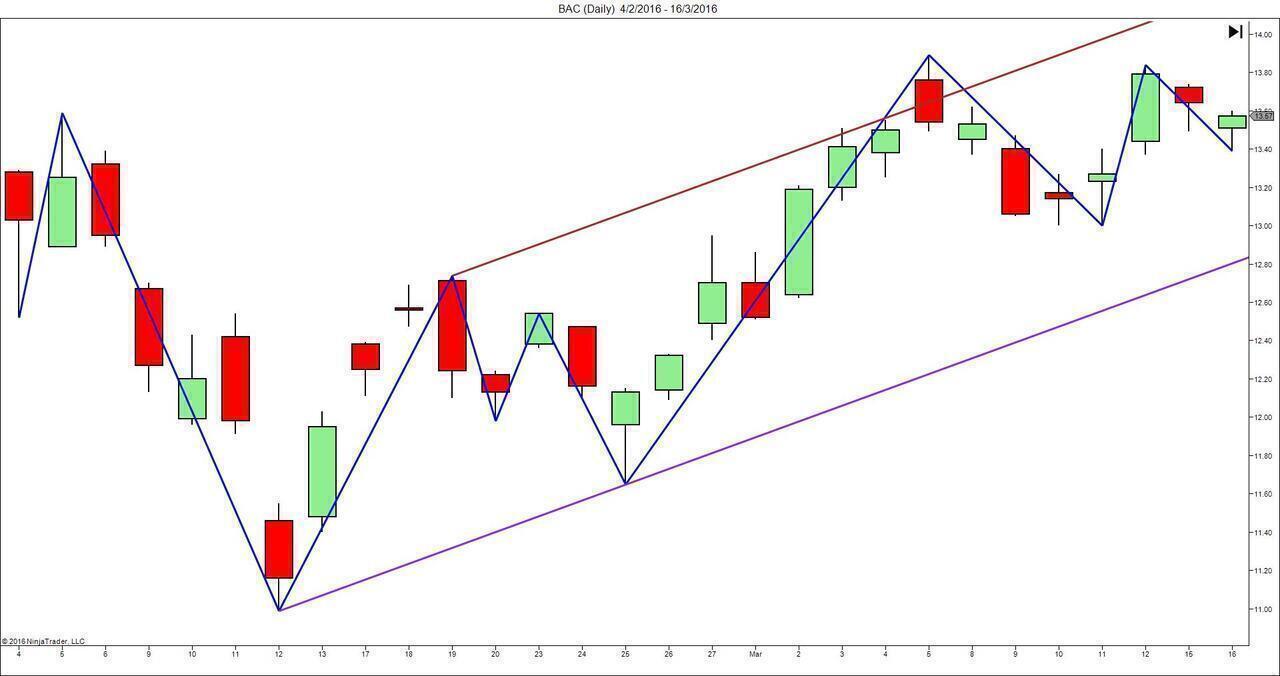
The channel line predicts the extent of future price action. Thus, you can immediately see how it is helpful for profit-taking.
Most charting platforms offer the ability to project parallel lines. If you are still looking for a charting program, check out NinjaTrader here. Or, if you prefer an online charting platform, TradingView is one of the best I’ve seen.
Trend Line Channel Trading Rules
After mastering how to draw trend line channels, you can test-drive the trading rules below.
Long Channel Pullback Setup
- Channel must be sloping upwards.
- Price pulls back down to test the bull trend line.
- Go long with any bullish price formation. (Aggressive entry: buy with a limit order placed just above the trend line)
- Place a target order at the channel trend line. (Adjust as necessary)
Short Channel Pullback Setup
- Channel must be sloping downwards.
- Price pulls back up to test the bear trend line.
- Go short with any bearish price formation. (Aggressive entry: sell with a limit order placed just below the trend line)
- Place a target order at the channel trend line. (Adjust as necessary)
Trend Line Channel Trading Examples
Each of the examples below includes:
- An initial channel that tracked the trend and triggered a pullback trade entry.
- An adjusted channel that offered a superior exit option for taking profits.
If you are not sure how to adjust channels, take it one step at a time and focus on the initial channel first.
Example #1: MCD Daily Price Chart
This chart shows the daily price action of McDonald’s Corp (MCD on NYSE).
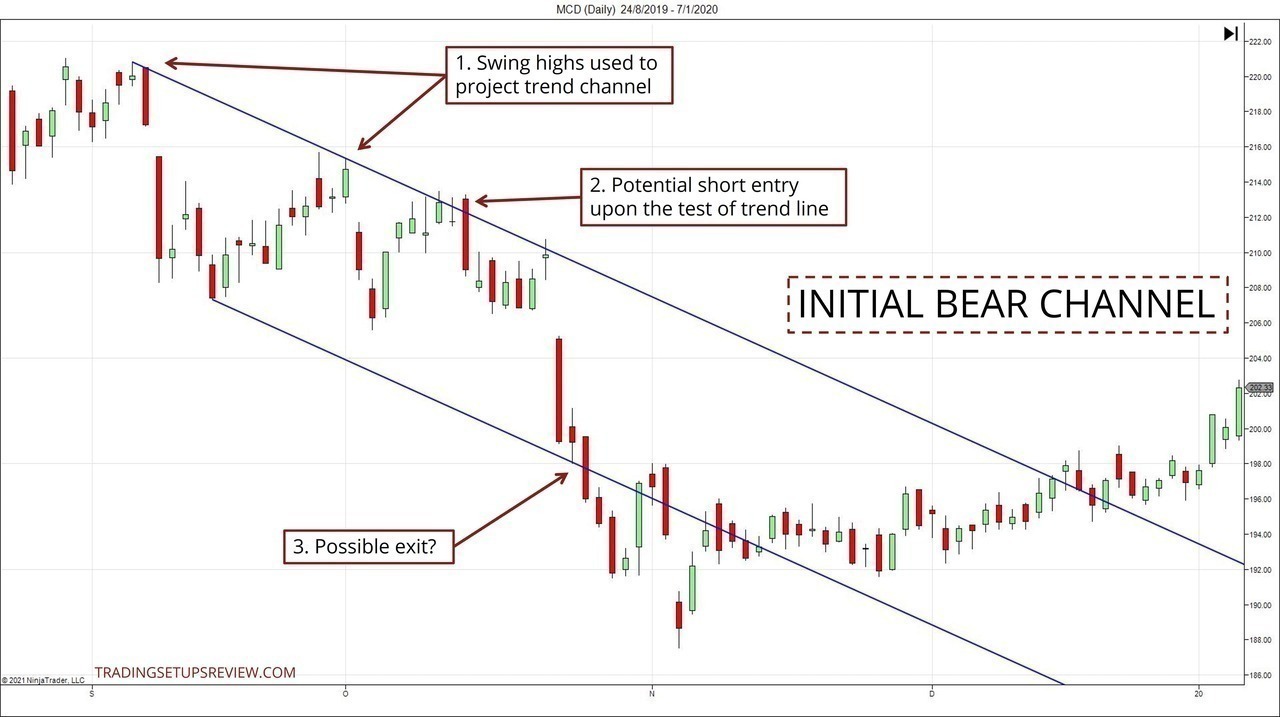
- These are the swing highs used for projecting the bear channel. The parallel channel line was anchored to the lowest point between the two swing highs.
- This test of the bear trend line presented a potential short entry.
- The channel line was a potential profit-taking level. But is it the only choice?
If you know how to adjust the channel as the market progresses, the answer is no. There are other options.
The chart below shows the same price action, with the channel that was adjusted after our entry. From it, we get two alternative profit targets.
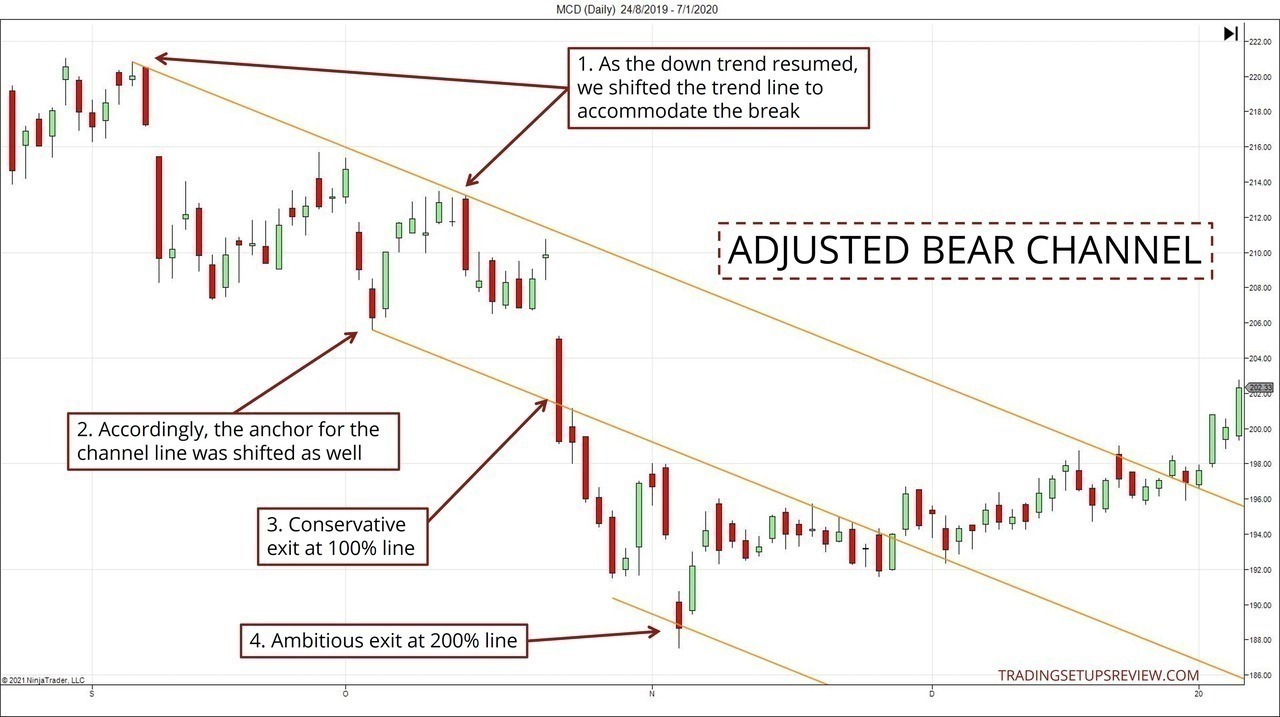
- One way to ensure that a trend line is relevant to ongoing price action is to adjust it to accommodate all price action. Hence, as the market pushed down, we pivoted the trend line anti-clockwise to do so.
- Accordingly, the anchor for the projected channel line shifted to the new extreme low as well.
- The channel line (100% line) served as a conservative target.
- For a more ambitious target, the 200% line was perfect in this case. Unless you have strong reasons to believe that the trend will accelerate, it’s usually a good idea to take profits with the 200% line.
To clarify, we obtain the 200% line by projecting a parallel line downwards such that the 100% line is equidistant from the other two lines. Hence, unlike the 100% line, the 200% line does not use a swing pivot as its anchor.
Example #2: WMT Daily Price Chart
This is a daily chart of Walmart Inc. (WMT on NYSE) in a bear trend.
We marked both the initial and adjusted channels in the same chart instead of splitting them into separate charts.
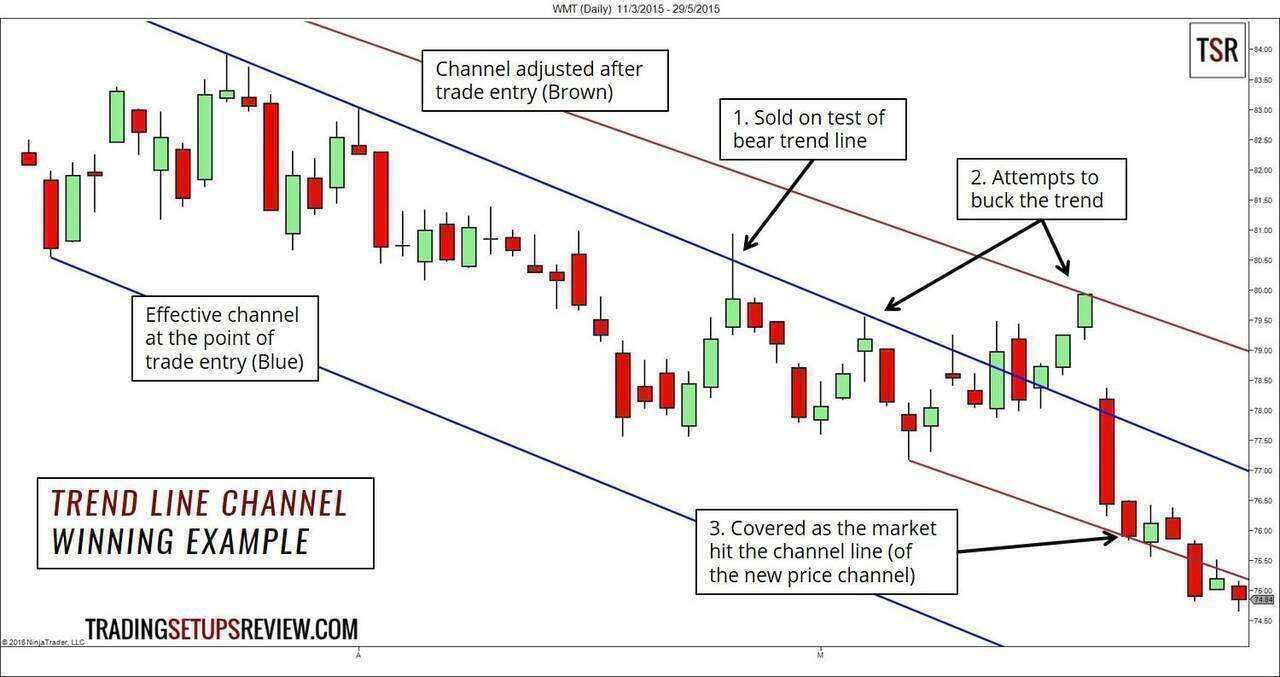
- We used the aggressive entry method here. A sell limit order led us into a short position as the market rose to test the bear trend line.
- This is not a textbook trade with a smooth trip to our target. As you can see, the market struggled to push down and made several attempts to push higher.
- Eventually, the market resumed its downwards drift. As it did so, we adjusted the trend line channel (to the one in brown). And we took profits using this new bear channel as a guide.
Example #3: IBM Losing Trade
This is a daily chart of IBM (IBM on NYSE), again in a bearish context.
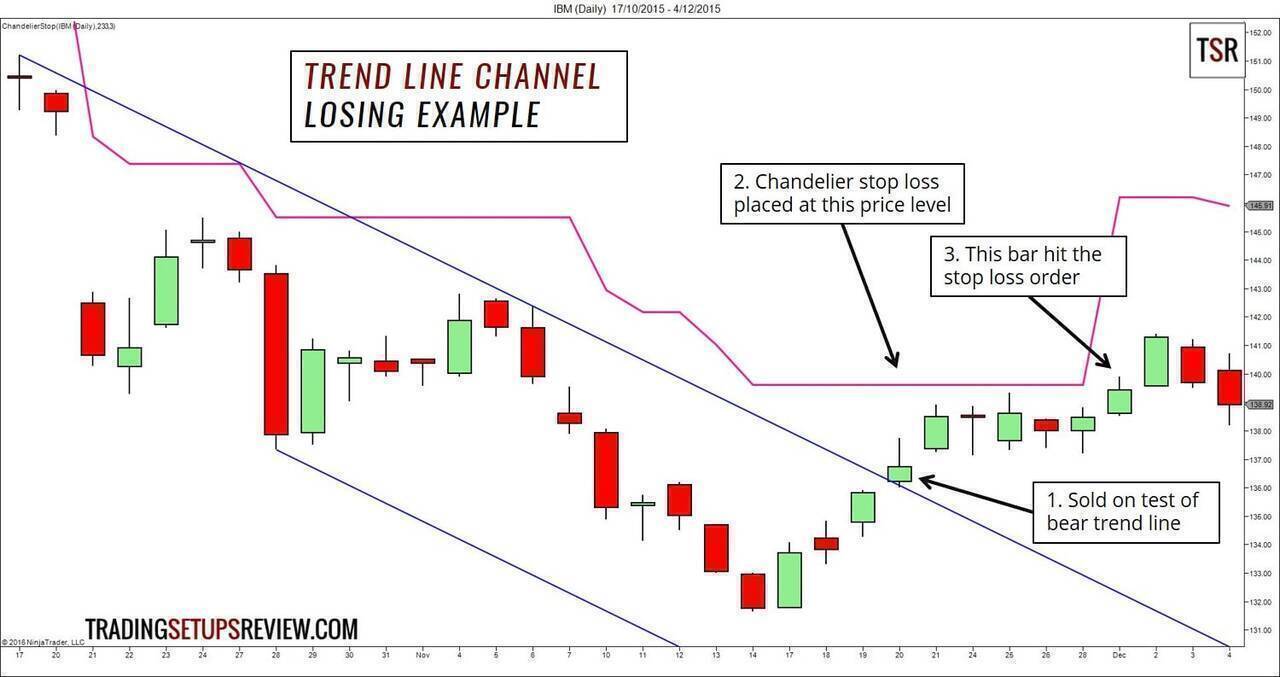
- Again, we entered aggressively with a sell limit order at the bear trend line in this example. We could have avoided this losing trade with a conservative entry. (i.e., wait for a bearish formation and enter with a stop order)
- We used a Chandelier stop-loss, as pointed out in the chart. Volatility stop-losses like the Chandelier stop are helpful when we do not have a pattern stop to rely on.
- The market hit the stop-loss order as it surged up.
This entry was badly timed and resulted in a loss. Let’s accept it.
But there’s something we can learn from the price action that followed.
The chart below shows the subsequent price action with the bear channel adjusted accordingly. It highlights the utility of trend line channels for profit-taking.
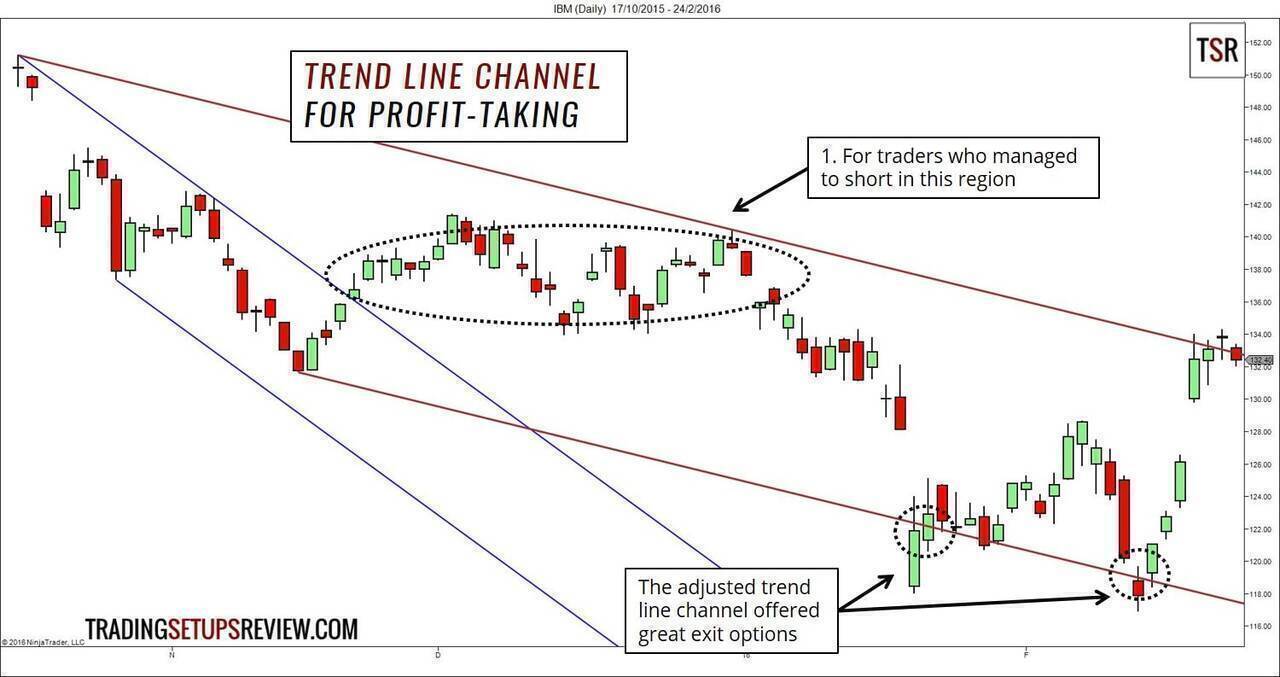
- Every price action trader has different methods for entering the market. So it’s conceivable that some traders went short within this area. One example is the decision to re-enter after being stopped out.
- Even if you did not use the bear channel for entering a trade, as long as you were in a short position, the adjusted trend line channel (brown) offered solid options for profit-taking.
Review - Trend Line Channel Trading
Look for channel trading setups that enjoy confluence from essential support and resistance levels. For a price action trader, this is a simple approach that works.
Or, if you like the synergy between price action and indicators, use an oscillator (e.g., Stochastic, CCI) to confirm the channel setups. E.g., An oversold signal with a bullish price pattern on a positive trend line.
The best trend line channels have moderate slope and width. In other words, think twice before trading:
- Extremely steep and shallow channels
- Extremely narrow and wide channels
For judging the steepness, you can use a 45-degree line as a benchmark.
Markets with steep channels are more likely to experience a deep pullback before the trend resumes. As for shallow channels, they can be relevant if you are looking for a trading range setup.
As for evaluating the channel width, compare the channel width to the average price bar range.
If the channel width is smaller than a couple of wide range bars, consider it narrow. It’s critical to pay attention to the channel width as it indicates the potential trade reward.

Make no mistake. This basic strategy will not channel you to guaranteed success.
But with it, you get a price action jackknife that helps you with:
- Trend analysis
- Entry timing
- Disciplined exit
This channel strategy works on the premise that a trend line channel would contain the price action. Other variants try to capture the break-out from a channel.
For more channel trading strategies, check out:
- 4 Ways to Trade a Channel
- Moving Average Channel
- Linear Regression Channel
- Channel Surfing: Riding the Waves of Channels to Profitable Trading [BOOK]
The article was first published on 20 May 2016 and updated on 7 September 2021.