Marubozu Candlestick Pattern Trading Guide
By Galen Woods ‐ 8 min read
The Marubozu candlestick pattern is a fascinating formation you can use to improve your market analysis. Learn how to do it with four in-depth examples.
Candlestick traders have heard of the Marubozu pattern. However, they don’t recognize that this unique candlestick is worth much more attention. Most traders learn it as the opposite of the Doji but fail to dive deeper into its application.
This gap is our focus in this Marubozu discussion.
What is a Marubozu Candlestick?
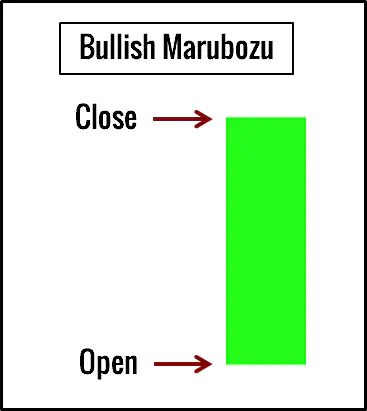
Marubozu means shaved or bald, implying that it displays no or minimal wicks (or shadows) on the candlestick.
The picture below shows a bullish Marubozu.
What does a Marubozu mean?
You can recognize a Marubozu easily. But beyond its visual form, what does this candlestick tell us?
Urgency.
The Marubozu exhibits the urgency of market players. It opens at one end and closes at the opposite end. It represents constant trading by ever more eager traders in one direction.
The key here is that when the market shows urgency in a direction, it prompts strong expectations.
For instance, when we see a bullish Marubozu, we expect prices to continue rising in the short-term.
But what if the market does not follow through?
This is the crucial question we will answer throughout this guide.
Our Trading Approach To Marubozus
Rather than memorizing dozens of complicated patterns, let’s focus on one candlestick pattern. Here, you will learn to interpret the Marubozu candlestick in various market contexts.
In this tutorial, you won’t get a quick template for trading Marubozus. But you will learn how to analyze the market systematically using Marubozus.
Hence, we are outlining an approach here, instead of rigid rules for trading Marubozus.
These are the steps:
- Analyze the market context
- Identify Marubozus
- Integrate the Marubozus to enhance our market analysis
- Find suitable setups
Step #1: Analyze the market context
Analyzing the market context involves figuring out if a trend is in place, and if so, its direction and strength.
It is an essential first step regardless of your trading strategy.
As a Marubozu is a single bar candlestick pattern, it forms in isolation. Hence, getting a firm grasp of the context becomes much more critical.
Step #2: Identifying Marubozus
A strict Marubozu does not have any wicks (or shadows or tails).
If you adopt this strict approach, you will find that Marubozus are generally rare, except in fast intraday timeframes.
However, remember that we are not merely interested in a visual pattern. We are interested in the market sentiment it implies.
Hence, it makes sense to relax the criteria to accept candlesticks with minimal wicks.
To accommodate this approach, the charts below use a custom indicator. It highlights candlesticks as long as the wicks form no more than 5% of the entire candlestick range.
If you’re familiar with the concept of Trend Bar, you can think of a Marubozu as a powerful Trend Bar. For a Trend Bar, we look for a candle body that takes up more than 50% of the candlestick. For a Marubozu, we want the candle body to take up at least 95% of the candlestick.
Step #3: Integrate the Marubozus to enhance our market analysis
Instead of trying to trade each Marubozu, it’s more productive to use them to augment our analysis.
How do we do that?
The key is to focus on the market’s reaction to each Marubozu.
For instance, in a bull trend, we expect bullish Marubozus to enjoy followthrough and bearish ones to fail. In a bear trend, the reverse should occur.
When the reaction to a Marubozu fails to meet our expectations, we use that failure to update our outlook.
Look for these signs of rejection:
- Powerful Marubozus with no followthrough
- Multiple Marubozus around the same price level without followthrough
- Marubozus that were rejected swiftly by the market
Step #4: Find suitable setups
Once we consolidate our market analysis from observing the Marubozus, we look for the exact setup.
We can be flexible at this stage.
Here are some common entry tactics:
- Bounces off support/resistance.
- Anticipating the failure of a Marubozu and fading it. (Fading means taking a position contrary to the direction of the price pattern.)
- Trend line breakout.
You will see these tactics in action in the examples that follow.
Marubozu Trading Examples
As mentioned, as long as you allow for minimal wicks, you can find Marubozus on all timeframes. Hence, our examples cover a variety of timeframes from 5-minute to 1-day.
- The charts below highlight the Marubozus with a cyan background.
- We also include a 20-period simple moving average (SMA) on the charts to give a snapshot of the market context.
Example #1: Bullish Marubozu Without Followthrough (Daily Chart)
In this example, first, we observe the market’s reaction to each Marubozu. Then, we use that information to update our market bias.
I have also applied the congestion zone indicator from my course to highlight pertinent S/R levels (blue shaded areas).
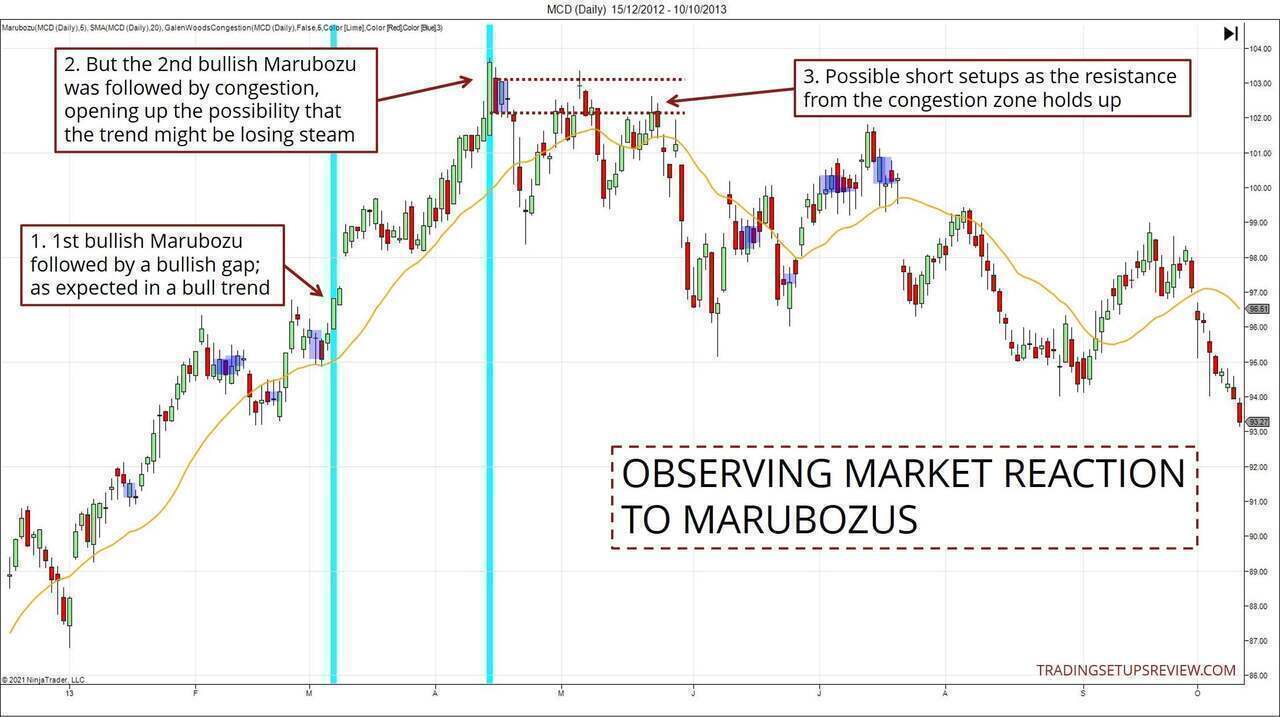
- The bull trend was evident, and this bullish Marubozu tried to push the market to a new high. A bull gap followed this show of urgency, and the market continued to rise.
- Now, examine this second Marubozu. Despite having a longer range than the first one, the market did not offer any followthrough. Instead, a congestion area emerged. This lack of followthrough hinted at the possibility of a reversal.
- We used the congestion zone to project a resistance, which blocked the market from rising. These rejections offered possible short setups.
Example #2: Failed Bearish Marubozus (4-Hour Chart)
This example shows a 4-hourly chart from the USDJPY spot market.
The 4-hour timeframe is popular among forex traders.
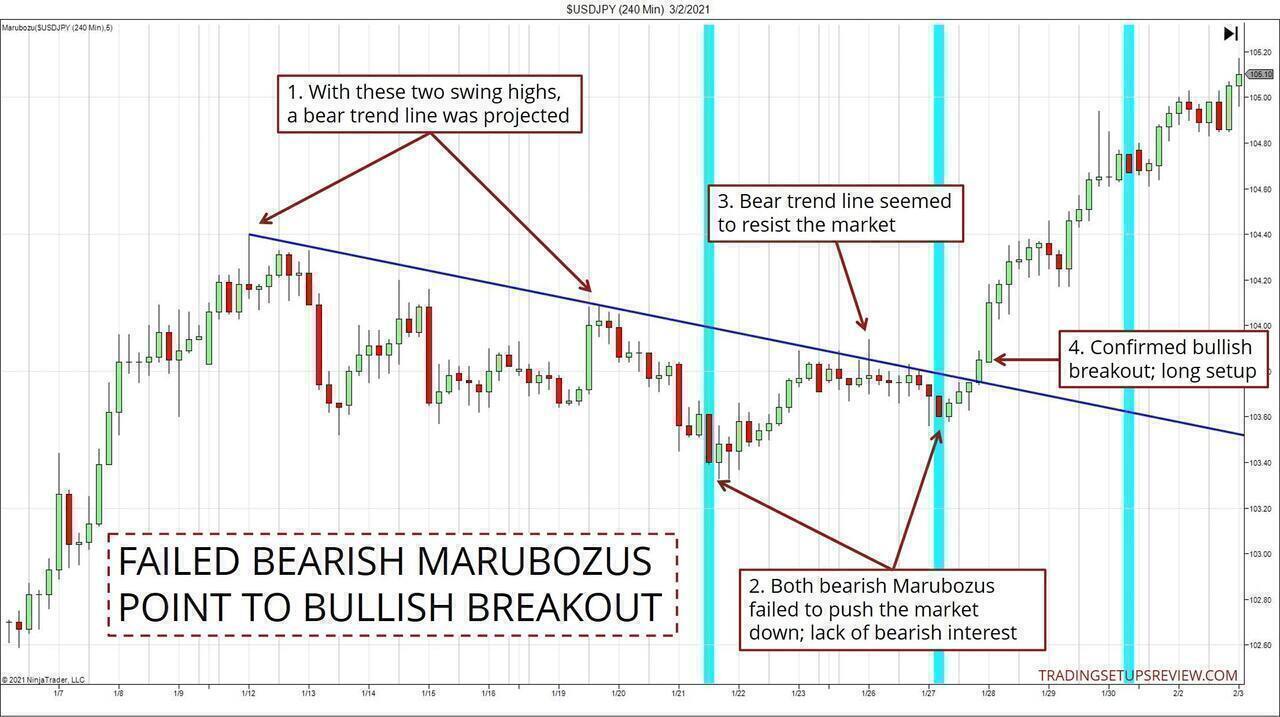
- We were able to connect these two swing highs to project a bear trend line.
- Despite the nascent bearish structure, these bearish Marubozus failed to muster momentum downwards. Instead, they were quickly rejected by eager buyers.
- The market congested just below the bear trend line. Together with the short-lived poke above it, the trend line seemed to be resisting the market decently.
- Hence, at this point, when the market broke above the trend line, some traders might hesitate to go long. However, remember that the bearish Marubozus did not enjoy any followthrough. This observation gave us the confidence to join the ensuing rally.
A last note: fading the third Marubozu (not pointed at in the chart) offered an aggressive entry for bulls.
Example #3: Fading a Bullish Marubozu (5-minute)
In the first two examples, we used the Marubozu candlestick to analyze the market. But we did not use it to trigger our entries.
Under the right circumstances, it’s possible to use the Marubozu to guide our entry. However, it’s more effective to fade the Marubozu rather than to trade its breakout.
This intraday example (drawn from an FDAX futures session) shows how, as an entry tactic, we can fade Marubozus that fail to generate momentum.
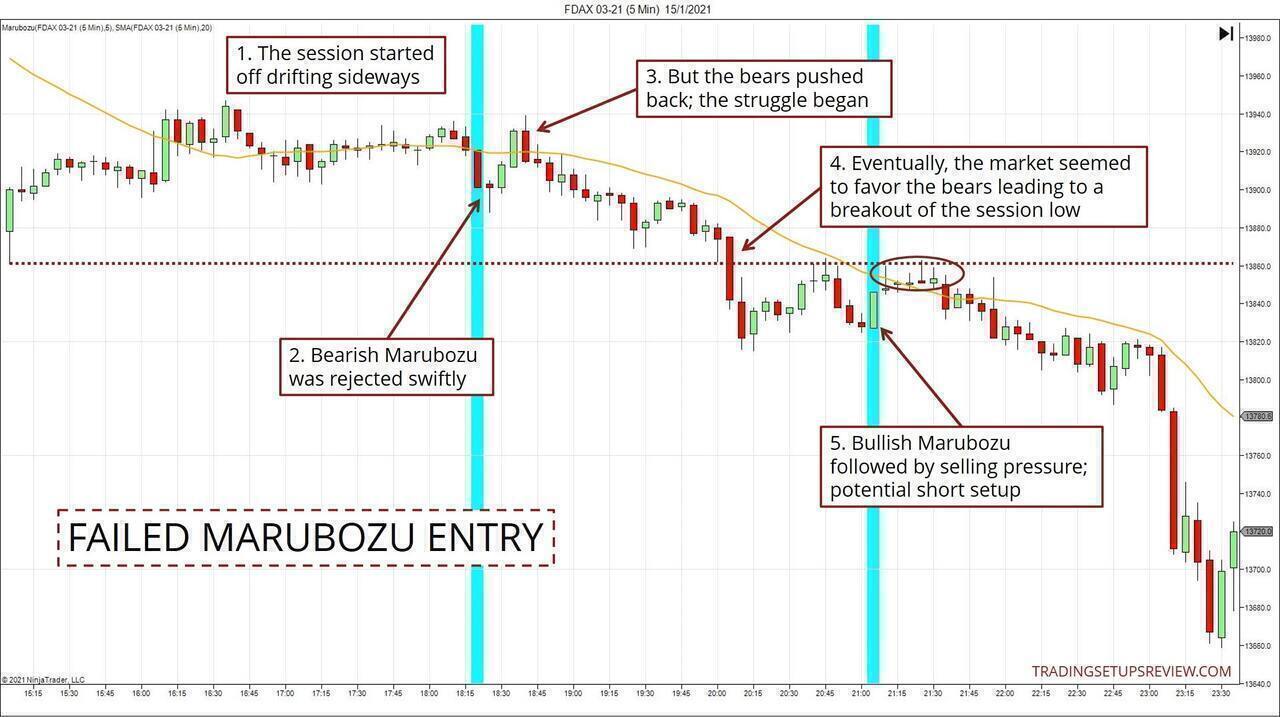
- This session started with a sideways drift.
- This bearish Marubozu was interesting as the market’s reaction to it could be telling. As it turned out, the market rejected it swiftly. Bullish?
- However, this bearish two-bar reversal marked the start of a struggle to resolve the sideways tension.
- From the price action that followed, it was clear that the bears were gaining control. Each candlestick pushed lower, and the entire series stayed below the SMA. Finally, the market broke below the support established at the beginning of the session.
- Since we confirmed the bearish bias, fading a bullish Marubozu was a viable setup. Look at the price action following this Marubozu. We found selling pressure near a resistance zone, which offered an ideal short setup.
Example #4: Trading Breakouts (Daily)
Getting a good read on the market gets tricky when it goes sideways.
In this example, we will see how paying attention to the Marubozus can help.
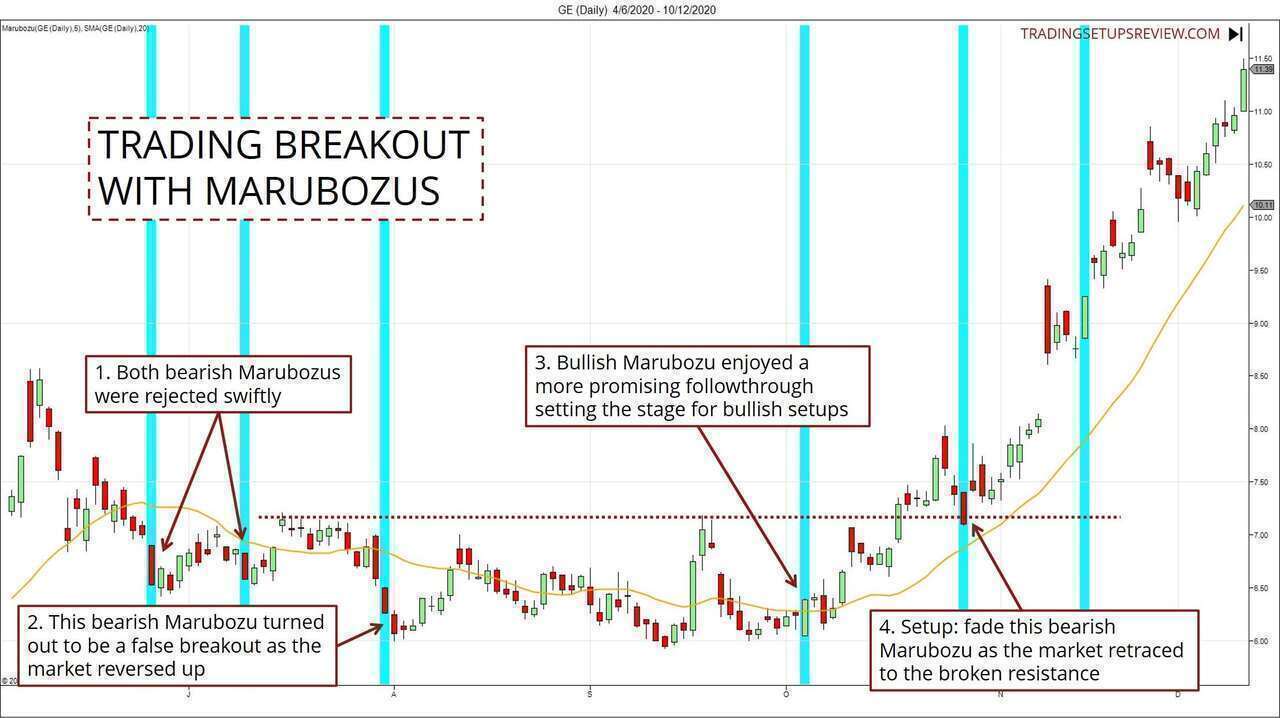
- The market formed two bearish Marubozus as it moved below the SMA. However, both candlestick patterns were rejected swiftly.
- The third Marubozu pushed to a new low, and it seemed like a solid bearish breakout. However, after just one bearish candle, the market reversed upwards and started meandering.
- On the other hand, this bullish Marubozu had great followthrough, despite a bearish outside bar along the way. The bulls seemed to be in control based on the market’s reactions to the Marubozu candlesticks so far.
- Hence, we could trade the bullish breakout above the resistance line. Or, we could fade this bearish Marubozu for a long entry.
Conclusion - How To Trade Marubozus
With any candlestick pattern, bearing the context within which it forms is crucial. As shown in the examples, we interpret each Marubozu according to the market context.
When we first pick up a price pattern, it’s easy to fixate on using it to enter trades. Doing that means focusing on simplistic entry and exit rules. And these rules might not consider the broad picture.
While this approach is common, it is more illuminating to take a step back. Then, we can consider the candlestick pattern in the larger context.
This is the fundamental idea behind the four examples above.
Marubozus are incredible candlestick patterns that attract market interest. Hence, observing how the market reacts to them offers tremendous analytical value.
This approach does take practice, but it brings you closer to price action. Not only that, the price action reading skills you pick up will be useful when you move on to study other patterns.