Trading The Engulfing Candlestick Pattern With Market Structure
By Galen Woods ‐ 8 min read
Learn how to use a series of swing highs/lows to find the best context for trading an engulfing candlestick pattern in this simple price action strategy.
If you are familiar with candlestick trading, you must know the Engulfing candlestick pattern. Its unique visual and dramatic name makes it one of the most popular price patterns. In this tutorial, let’s examine how to form a strategy by looking for this pattern within an ideal market structure.
What is the Engulfing Candlestick Pattern?
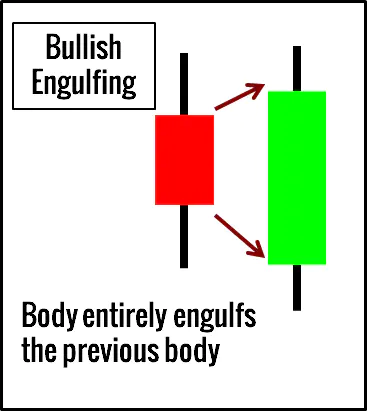
First, a few key points about the Engulfing candlestick pattern:
- It consists of two candlesticks.
- The body of the second candlestick completely engulfs the body of the first candlestick.
- The second candlestick determines if the pattern is bullish or bearish.
- It represents a total change of market sentiment.
This is how a bullish instance looks like.
What is an excellent Engulfing pattern?
The Engulfing candlestick pattern’s technical definition requires that the body of the second candlestick engulfs the first one.
But the best Engulfing patterns tend to exhibit the following traits:
- The second candlestick also engulfs the entire first candlestick, not just its body.
- The shadows of the second candlestick are negligible, showing urgency in the reversal.
- The second candlestick is not an inside bar. (This unusual form is possible because Engulfing pattern focuses on the candle bodies.)
How should we trade an Engulfing pattern?
An Engulfing candlestick in the proper context offers a solid trading setup. Standard methods of analyzing the market context include using moving averages or oscillators.
But in this tutorial, we will look at a method that stays close to the price action world of ebbs and flows. We will observe swing highs and lows to decipher the market structure and use that to point us in the right direction.
Market structure refers to the relationship between swing pivots (both highs and lows) that help us to identify market trends and ranges.
Trading Guidelines - Engulfing Candlestick
These guidelines aim for a retracement entry using the Engulfing candlestick pattern after determining our trading bias with an analysis of swing pivots.
Bullish Engulfing
- Higher swing high and higher swing low
- Buy with bullish Engulfing candlestick pattern
- High of the pattern must stay below the previous swing high (to ensure that the market is still in the pullback phase)
Bearish Engulfing
- Lower swing high and lower swing low
- Sell with bearish Engulfing candlestick pattern
- Low of the pattern must stay above the previous swing low
Entry Point & Stop-Loss Placement
Let’s elaborate on the options for the exact entry and stop-loss points. The diagrams below illustrate them for a bullish pattern.
First, let’s take a look at our entry options.
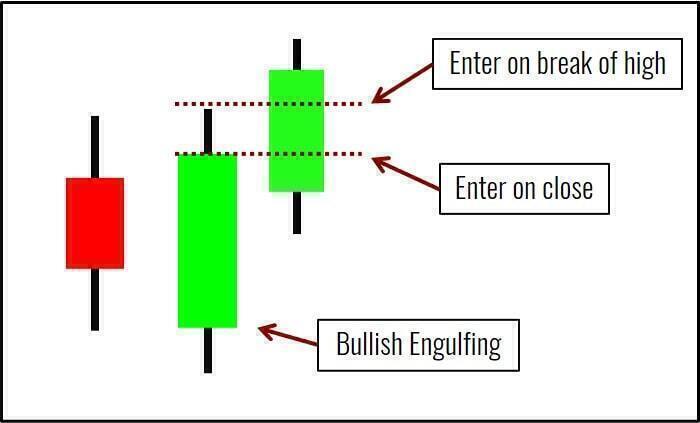
There are two options for entry:
- Enter once the Engulfing candlestick closes, using a market order - more aggressive.
- Enter whenever the market breaks the high of the Engulfing candlestick, using a buy stop order - more conservative.
For Option #2, we may avoid entering a losing trade altogether if the market falls enough to negate the bullish setup before triggering our buy stop order. Naturally, the cost is a reduced reward-to-risk ratio assuming the same trade risk.
The diagram below shows the pattern stop for a bullish Engulfing candlestick pattern.
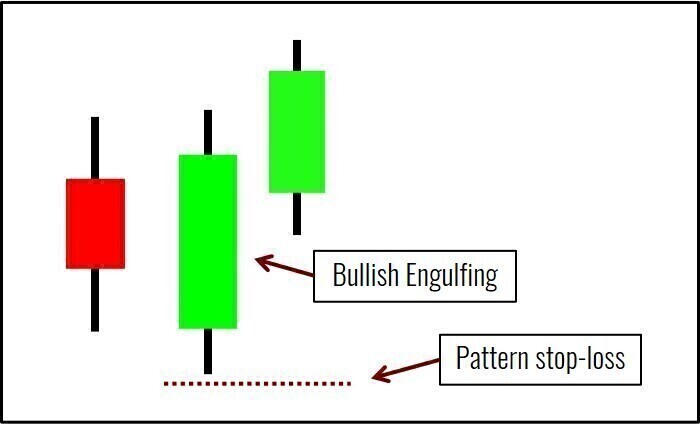
The default pattern stop is the low of the Engulfing candlestick.
Of course, you can also utilize volatility stop-loss techniques as a sensible option.
While we can relate the entry and stop-loss to the candlestick pattern, the target relies more on the broad market context. Crucially, it depends on the surrounding support and resistance levels and any chart formation suitable for target projection.
For more ideas, check out our guide on taking profits.
Engulfing Candlestick Trading Examples
For a balanced discussion, this section contains random examples from a variety of timeframes and markets, including both winning and losing setups.
Example #1: Winning Trade
This is a daily chart of Allergan (AGN on NYSE). It shows a market plunge that erased months of gains.
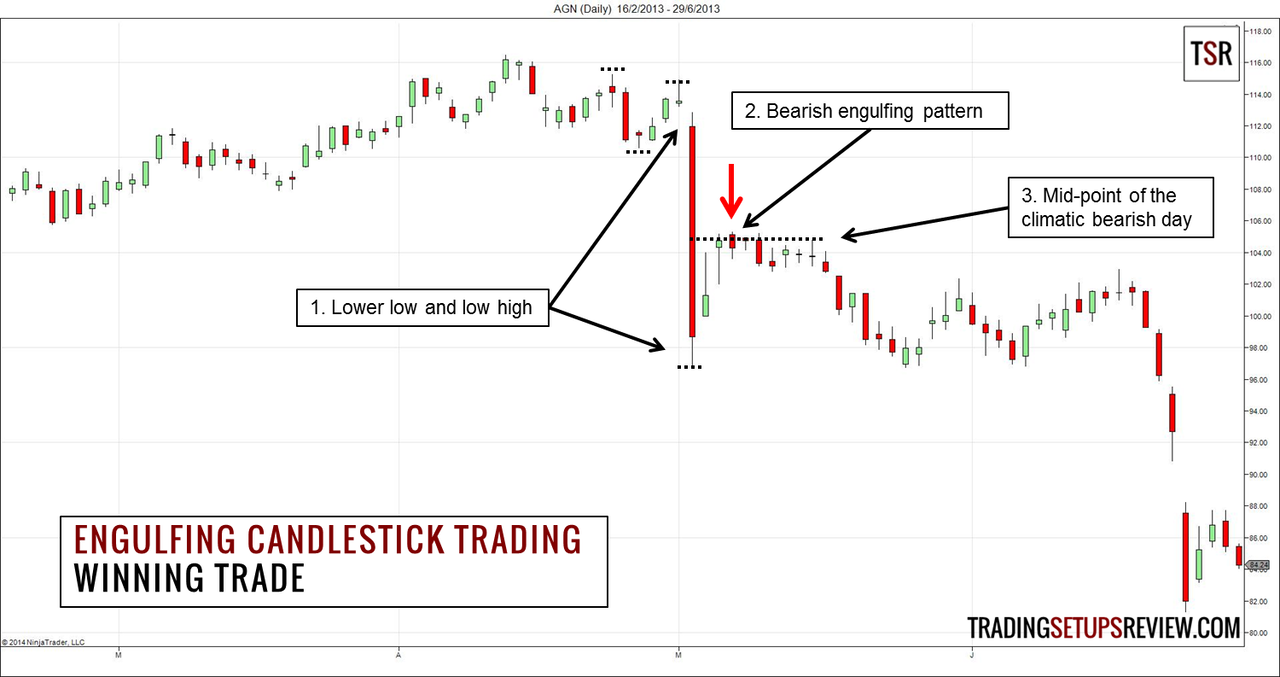
- The lower swing high and low hinted at the beginning of a downwards trend. The climatic bearish bar confirmed the change of direction.
- Prices retraced up immediately after the drastic fall. But the bull move halted as a bearish Engulfing pattern emerged.
- Here, the mid-point (50% retracement) of the powerful bear trend bar acted as a resistance zone. The bearish Engulfing candlestick pattern forming at that level offered confluence for a short setup.
The climactic bearish bar was an Anchor Bar, a price bar of exceptional range and volume. Consequently, such bars tend to exert influence over subsequent price action.
For instance, the Anchor Bar’s high and low might act as support and resistance. In the chart above, notice how the market bounced off the low of this Anchor Bar twice before continuing to push lower.
Example #2: Intraday Engulfing Pattern
You can spot and trade Engulfing patterns within intraday timeframes as well.
This example comes from the 3-minute chart of the DAX futures listed on EUREX. The first bar in the chart below corresponds to the first three minutes of the session.
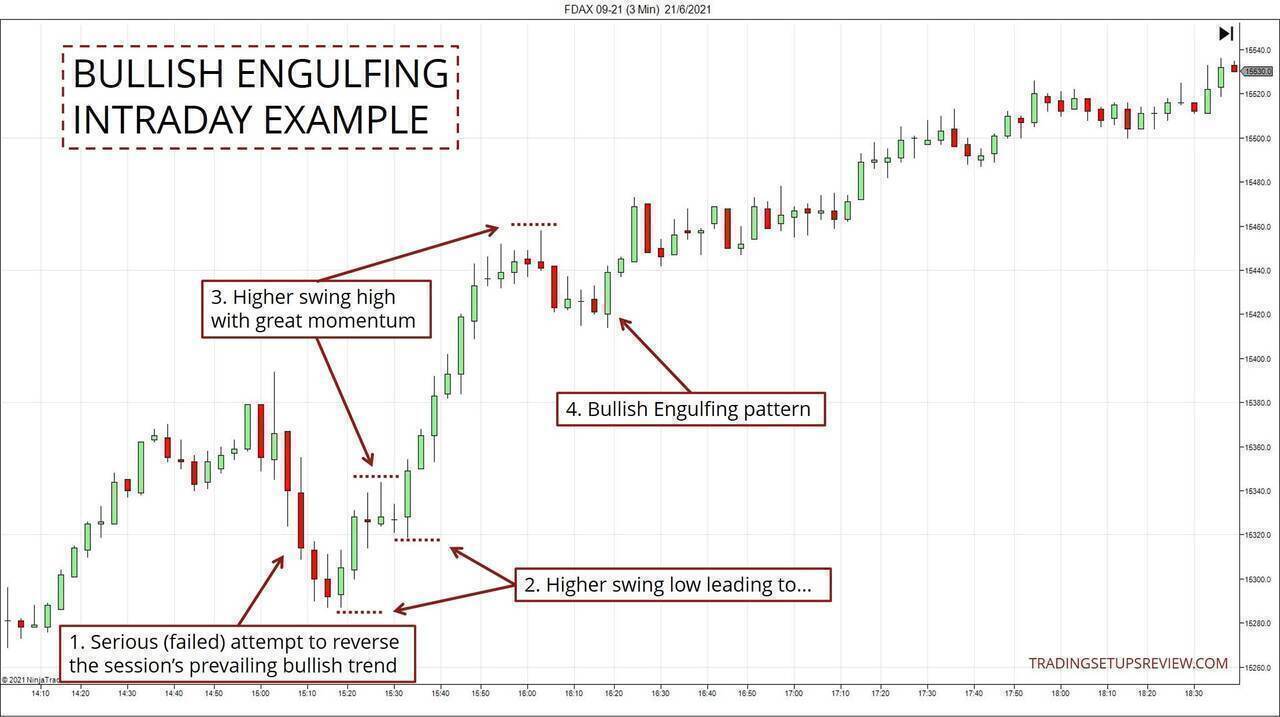
- This downthrust was a serious attempt to reverse the session’s upwards bias. Hence, its failure was significant and was an encouraging sign to the bulls.
- This set of higher swing lows followed.
- This push above the first swing high contained a series of six bullish candlesticks, each closing above the high of the previous candlestick. The bullish momentum here was impressive and affirmed the upwards trend.
- This bullish Engulfing candlestick pattern worked out great. Although the bearish Pin Bar a few bars prior looked intimidating, we must not neglect the apparent bullish solid momentum.
Example #3: Losing Trade
This daily chart of Cardinal Health (CAH on NYSE) shows a bearish Engulfing pattern that didn’t follow through.
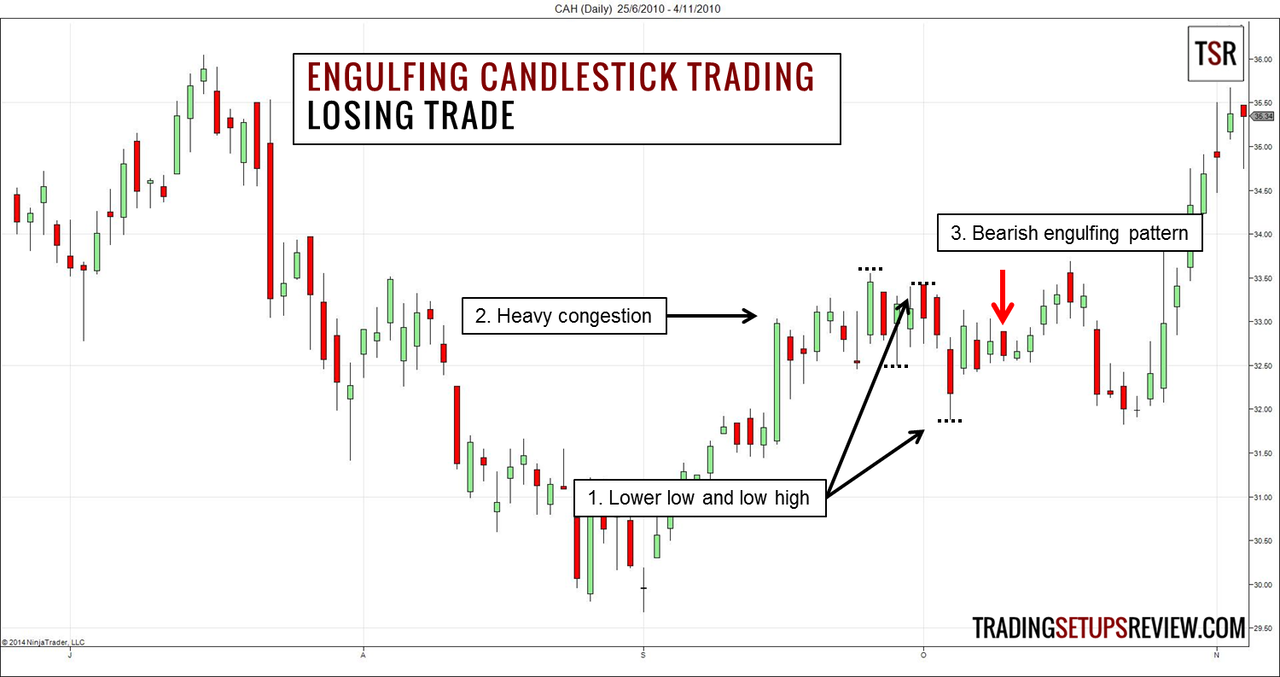
- Technically, there was a set of lower swing high and low. However, unlike Example #1, we did not observe powerful bearish momentum to confirm a downtrend.
- Moreover, in this case, the market was in congestion before the down-thrusts that formed the swing lows. Crucially, the downswings did not push the market much beyond that congestion area. Hence, the lower swing high and low we observed was a less reliable indicator of a downwards trend.
- Eventually, a bearish Engulfing candlestick pattern formed. But it led to a losing trade.
If you look closer, the pattern had a deficient form.
- The Engulfing candlestick barely engulfed the preceding candlestick and was a weak form of the pattern.
- The Engulfing candlestick was within the range of each of the three bars before it. Hence, although it fits the technical definition of a bearish Engulfing pattern, it was closer in substance to being part of a tight congestion pattern.
Example #4: Momentum Matters
To determine bear trends, we look for lower swing highs and lower swing lows. For bull trends, we look for higher swing highs and higher swing lows.
However, these guidelines assemble a snapshot of the market condition. Therefore, examining how it got there is also immensely helpful.
In this example from the Altria Group (MO on NYSE) daily prices, we will not only focus on what the market structure is but also pay attention to how got there.
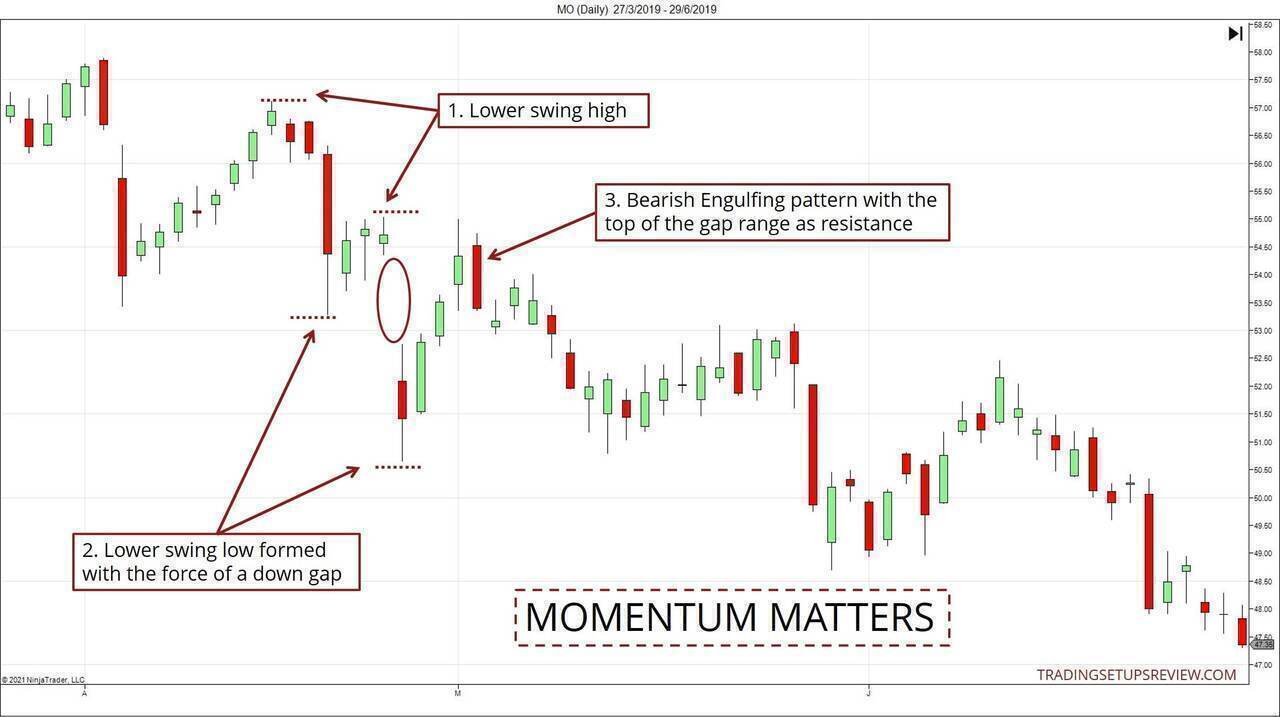
- As usual, we looked for a set of lower swing highs to begin our stalking.
- This lower swing low fulfilled our trading guideline for establishing a bearish bias. Note that this lower swing low formed as a result of a forceful down gap. This show of bearish momentum strengthened our bearish expectations.
- The top of the down gap acted as a possible resistance level. This improved the quality of the bearish Engulfing candlestick pattern as a short setup.
Momentum matters. It is one of the keys to selecting the best trades.
Refer to the examples above. Other than the appropriate market structure, the successful trades had clear, strong momentum on their side.
Review - Trading Engulfing Candlesticks with Market Structure
Many trading strategies use Engulfing candlestick patterns as a signal for significant trend reversals. However, reversal trading typically involves a lower probability with a higher reward. While some traders are comfortable with that risk profile, others might feel safer going with the trend.
Using Engulfing patterns for continuation trades, as discussed above, you can limit your risk and enjoy better odds.
In candlestick trading, confirmation is a familiar concept. Here, it means waiting for one more candlestick to complete after the Engulfing pattern. (A bullish candlestick would confirm a bullish pattern and vice versa.)
However, doing so worsens our reward-to-risk ratio. Also, if you wait for confirmation, the trading setup would likely become invalid due to the third guideline above. That guideline keeps us away from taking trades that have a poor reward-to-risk ratio.
A good compromise is to use a stop order for your entry, as we discussed earlier. For instance, place a sell stop order below the bearish Engulfing candlestick. It offers a degree of confirmation from the falling market without skewing our reward-to-risk ratio too much.
Observing swing highs and lows is the simplest way to track the market structure. While you can do this without any trading indicator, new price action traders might want to use moving averages to help with establishing consistency.
This approach does produce confusing signals during deeper multi-legged pullbacks, but its simplicity is still attractive. Regardless of your trading strategy, paying attention to the market structure will help you filter bad trades.
Hone your skills in analyzing the market structure, and you’ll find that it is invaluable in any trading method.
Finally, congested markets might contain many Engulfing candlestick patterns with no follow-through. Be careful and avoid signals in a sideways market. Look for clear swings to prevent trading within a congestion zone.
The article was first published on 31 January 2014 and updated on 2 July 2021.