How To Trade Candlestick Patterns With Trend Lines
By Galen Woods ‐ 8 min read
Trading candlestick patterns with trend lines offer an elegant trading approach that is flexible and effective. Learn through four detailed examples.
Combining candlestick patterns with trend lines is a classic price action trading strategy. This approach bears great appeal for minimalists. Armed with the skills to draw reliable trend lines and spot candlestick patterns, you are ready to go.
Candlestick traders often use indicators like Stochastics or moving averages to upgrade their trading. But with trend lines, we can go one step closer to price action. If you’re looking to move towards trading without indicators, this approach is ideal.
This tutorial will teach how to trade candlestick patterns with trend lines through four in-depth chart examples.
But before that, let’s introduce the tools of the trade.
- Candlestick Patterns
- Trend Lines
Candlestick Patterns
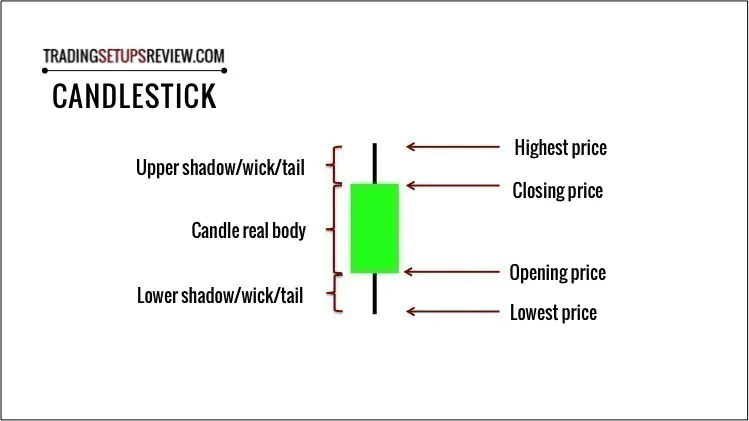
There are dozens of candlestick patterns, including obscure ones like the Takuri line. The good news is that you don’t need to learn all of them to trade effectively.
On the contrary, it makes more sense to focus on understanding a few patterns at the start. It will help you learn each one’s nuances and avoid being overwhelmed by the “candlelight.”
In this guide, we will use several standard candlestick patterns:
- Engulfing Candlestick Pattern
- Harami Candlestick Pattern
- Morning (Evening) Star
- (Inverted) Hammer
If you need a recap of the common candlestick patterns, check out this list before continuing.
Trend Lines
Trend lines serve to point out trends. But that’s not their only function. They are also practical tools that highlight setups consistent with the market bias.
There is no one correct way to draw trend lines. But it would be best if you had a systematic way to draw them to ensure consistent trading outcomes.
(For the trend lines in the examples below, I follow the drawing framework in my course.)
Two points form a line. Regardless of how you draw trend lines, they are always the result of connecting two price points. Hence, for clarity, in the examples below, we will point out the two points used to project each trend line.
The best thing about price action tools like trend lines is that they are universal. Once you have a framework for implementing them, you can apply them in any market and timeframe.
Trading Approach
Our approach is simple.
We assume that trend lines work as support and resistance. Then, we search for candlestick patterns that bounce off trend lines.
Although the examples below show mainly pullback trades, this approach also highlights reversal and breakout trades in different contexts.
Once you’re familiar with identifying candlestick patterns and drawing trend lines, you are set. You do not need any indicators.
However, when examining many charts, it helps to use the software to mark the price patterns. Hence, in the charts below, we will use NinjaTrader’s in-built candlestick pattern tool.
(Note that each charting platform codes the candlestick patterns with slight differences. Thus, the patterns they mark out might not be consistent. Nonetheless, as long as you are not trading mechanically, this should not pose an issue.)
Trading Examples
The four examples below cover a variety of situations, focusing on a different candlestick pattern each time.
Example #1: Bullish Engulfing With Trend Line Support
In this daily chart of Carnival Corp., we will focus on identifying the Engulfing pattern.
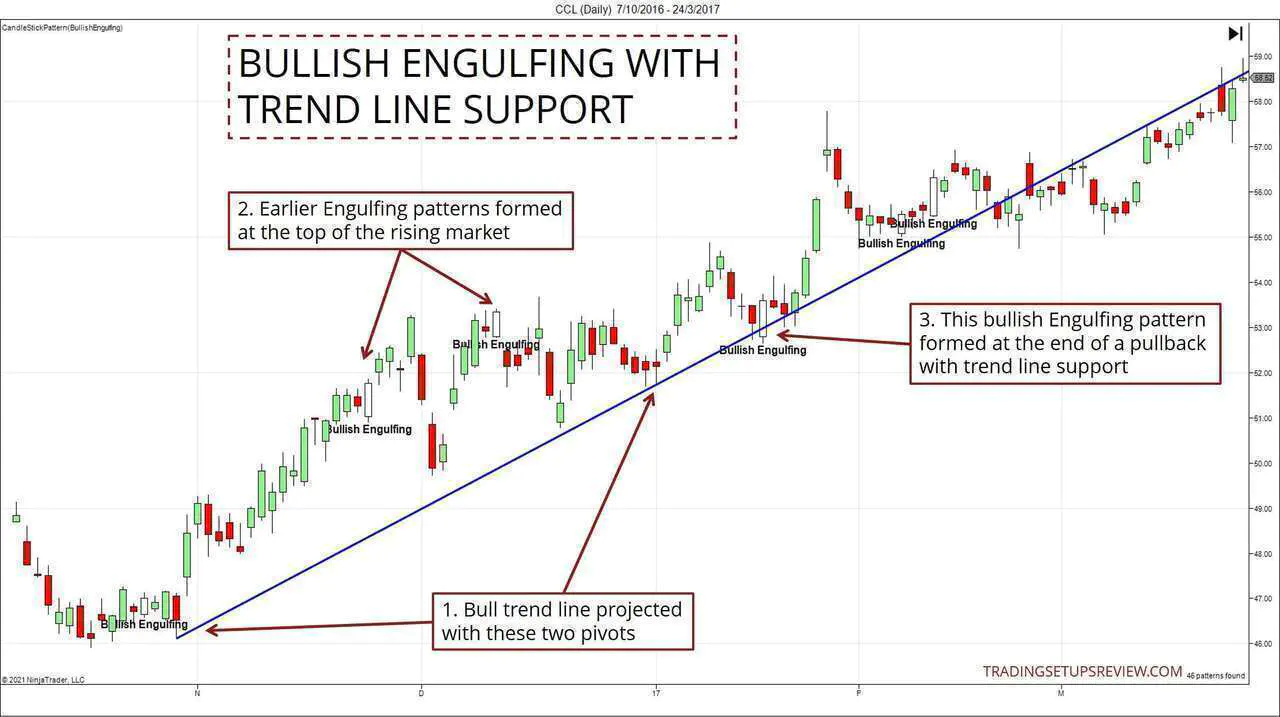
- These two swing lows form the basis for projecting the bull trend line.
- These two bullish Engulfing patterns formed as the market pushed to a new high. While aggressive traders might trade those instances, many traders would prefer a pullback to improve the potential reward-to-risk ratio.
- This Engulfing pattern fitted the bill. It formed at the end of a pullback with support from the trend line. This support boosted our confidence in taking a pullback trade. (Stop-loss placed just below the Engulfing pattern.)
Let’s extend this example. By doing so, we can highlight the value of adjusting a trend line with incoming price action.
Below, we draw out the chart to show more price action on the right. As we do so, we will also adjust the trend lines to encompass more price action.
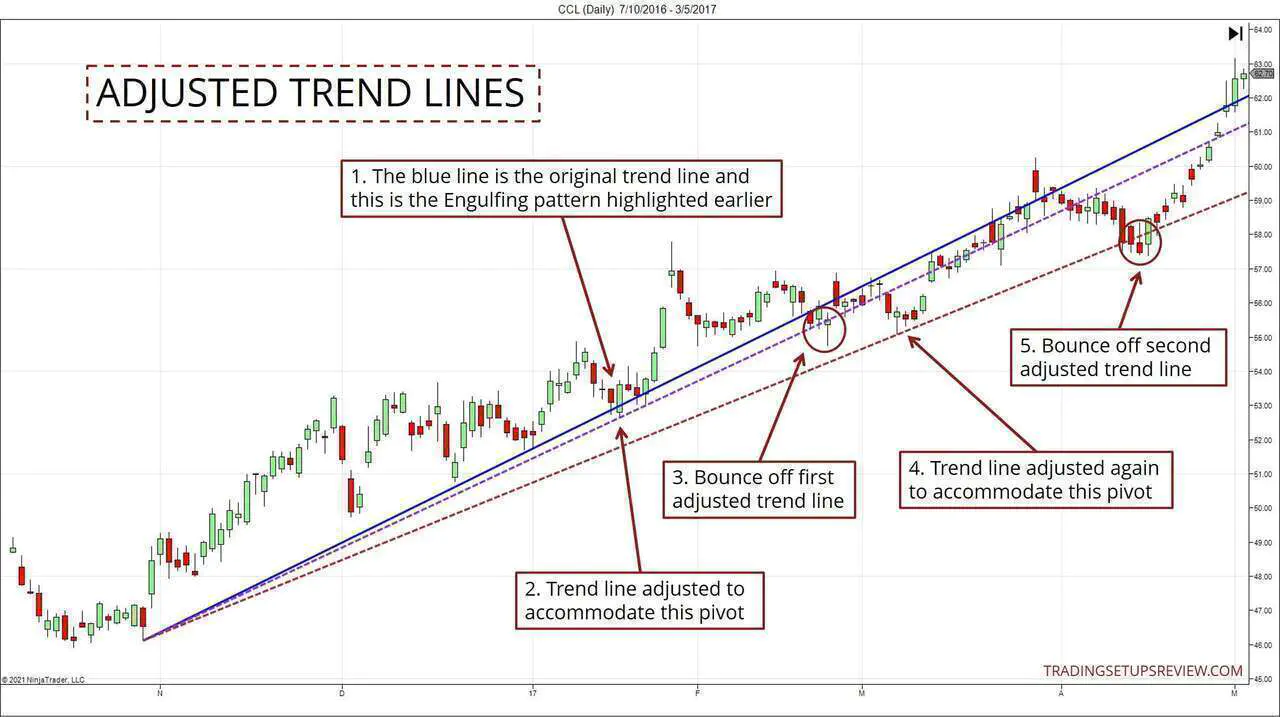
- The blue line is the trend line shown in the chart above, as we discussed.
- As the trend resumed, we adjusted the trend line to accommodate the recent price action. This resulted in the shallower purple trend line.
- As you can see, this first adjusted trend line acted as a support. On top of that, it helped to pinpoint another pullback trade.
- Again, as the market rose, we adjust the trend line a second time to obtain the brown dotted instance.
- Similarly, it acted as a support for another pullback in this healthy bull trend.
By adjusting the trend line to keep up with the latest price action, we made full use of this simple tool.
Example #2: Bullish Harami Candlestick
In this daily chart, we are focusing on the Harami candlestick pattern.
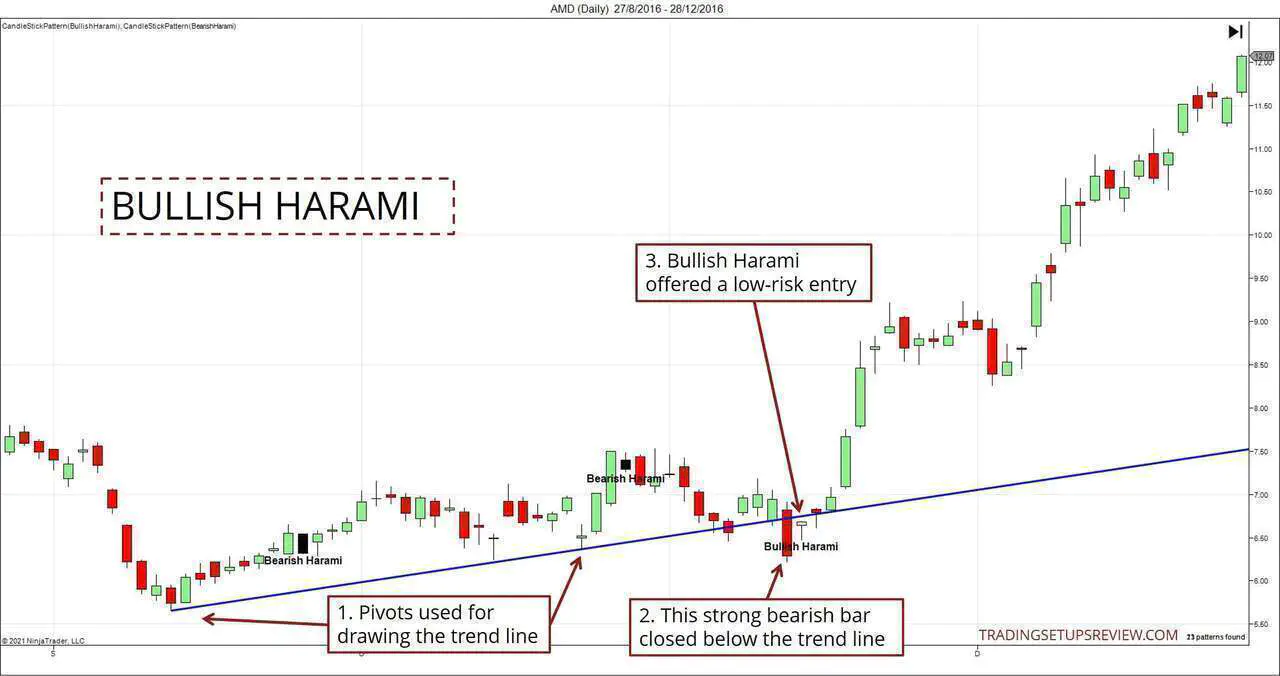
- We used these two pivots to project the bull trend line.
- Note the four consecutive bearish bars. Following that, the market continued to push down with this powerful bearish bar. It created the expectation that the bull trend line would not hold up.
- However, this bullish Harami candlestick suggested otherwise. Furthermore, with its small range, it offered a low-risk entry into a budding bull run.
Example #3: Hammer Candlestick
When drawing trend lines, there is one crucial question to answer. Which point should you start your trend line from?
- Go too far back in time, and you’ll be drawing outdated trend lines that are not relevant to the current price action.
- But the other extreme would cause you to miss capturing the broad market trend that we value in our analysis.
This is one area where the trader needs to exercise his or her discretion. But there is one tip that you can apply. When you see a clear price gap (or window), it’s a good idea to restart your trend line drawing. And this is what we are doing in this example.
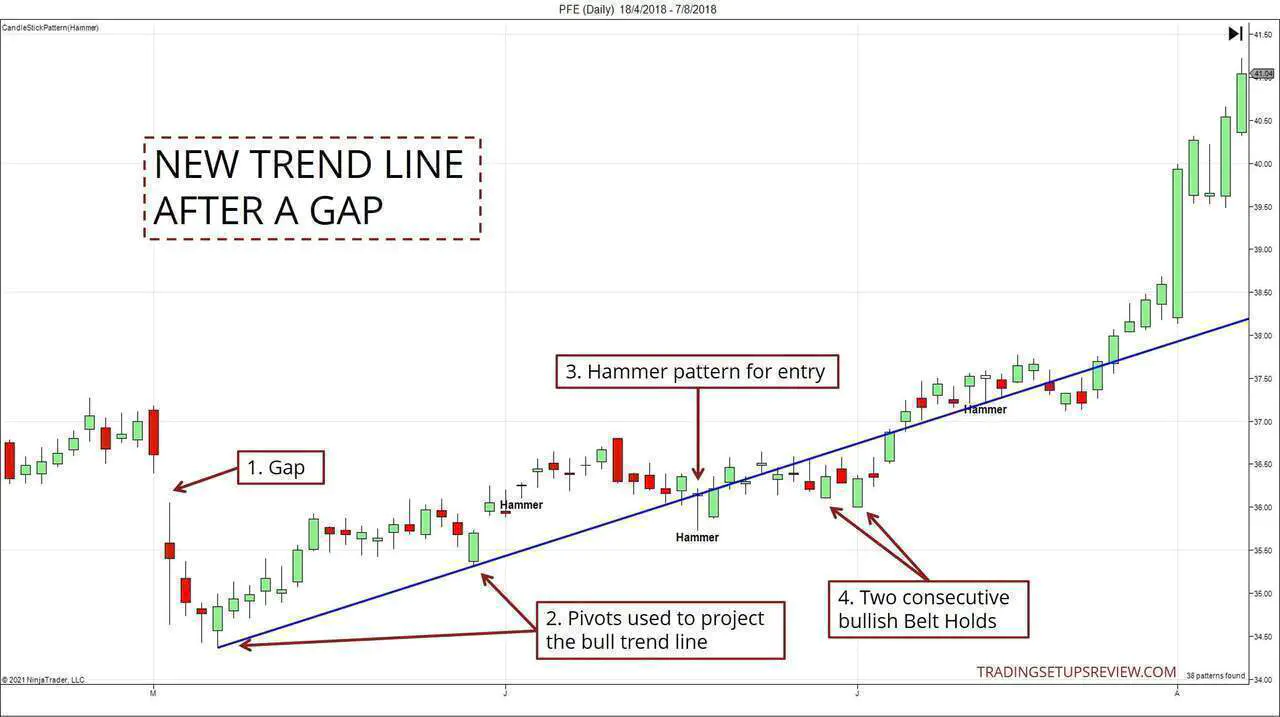
- This down gap went unfilled for weeks.
- After the gap, we waited for two appropriate pivots for drawing a new trend line. These were the swing lows that emerged.
- Right after filling the gap, the market retraced down and tested the bull trend line. The test also formed a Hammer candlestick. (If you look closer, the Hammer also tested a smaller gap zone acting as support.)
- We might hesitate to take the Hammer setup. This is because the gap (mentioned in Point #1) might be holding sway as a resistance zone. A good compromise would be to wait for more bullish signals before committing to a trade—signals like these two bullish Belt Hold patterns.
Example #4: Opposing Trend Lines
This chart shows an exciting formation.
At times, we get two trend lines that oppose each other. In such scenarios, you can often decipher a chart pattern like a Triangle.
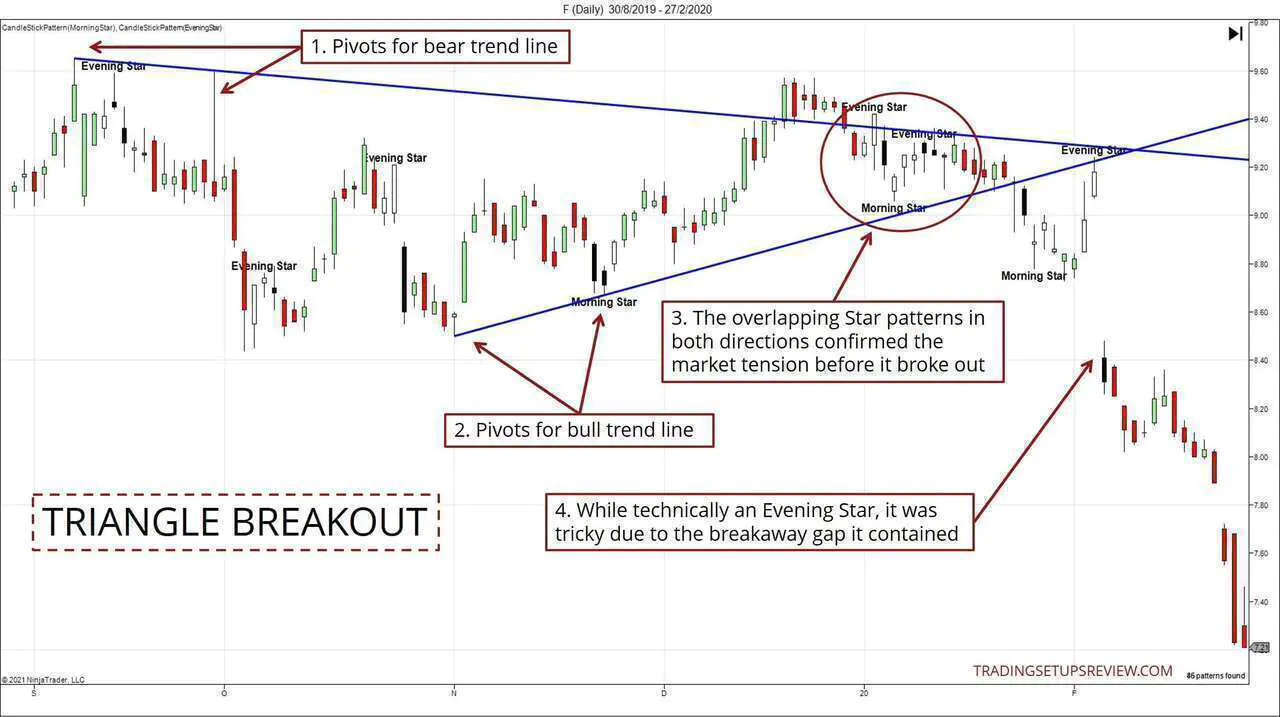
- We used these two swing highs for the downwards sloping bear trend line.
- These two swing lows were used for the bull trend line.
- The clustering of two Evening Stars and one Morning Star was notable. It highlighted the market tension just before the Triangle breakout.
- The market broke out of the Triangle soon. After that, the market retested the Triangle pattern’s apex before gapping down into a bear trend.
Technically, the retest formed an Evening Star pattern. But it was tricky to trade as the pattern contained a breakaway gap. In practice, there are two ways to approach this scenario.
The more aggressive method is to set a limit order at the broken bull trend line. The aim was to sell short upon the retest of the apex. You could place a volatility stop-loss at a distance above the Triangle. This approach turned out to be ideal.
The more conservative way was to go short only after the Evening Star pattern was completed. However, due to the breakaway gap, our reward-to-risk ratio would be unexpectedly skewed. In that case, instead of entering straight away, we might wait for the first pullback before going short.
Both approaches are valid. But remember that the breakaway gap was unexpected. Hence, ex-ante, it was impossible to state which method was superior.
Conclusion - How To Trade Candlestick Patterns With Trend Lines
This approach is simple but takes practice.
You could quickly learn the major candlestick patterns. But setting up a system to draw trend lines confidently takes time. On top of that, learning to use these tools will take even more exercise.
As you might have glimpsed from the examples, there is nothing magical about candlestick patterns. They merely provide a well-defined entry trigger and assist with our stop-loss placement. Bar patterns can play the same role as well.
Beyond that, more aggressively, you can simply enter a trading position with a limit order upon a test of the trend line. In those cases, you can employ a stop-loss based on price volatility (instead of the price pattern).
In this trading method, we have two objective trading concepts:
- Candlestick patterns
- Trend lines
These tools are objective because we have a rigid way to identify and draw them. However, we exercise our subjective judgment to find and evaluate trades.
In this minimalist framework, we use objective tools and interpret them subjectively. This description sums up my idea of a sound discretionary trading approach.
And this is the trading style taught in my trading course. So if you want to learn how to build a discretionary trading plan systematically, check out the course details here.