5 Ways To Find Support and Resistance With Price Action and Volume
By Galen Woods ‐ 9 min read
Want to find reliable support and resistance? Price action and volume offers a logical and practical way to identify market demand and supply.
Want to improve your trading performance? Reliable trading tactics start with finding reliable support and resistance. These critical zones map out the areas where supply overwhelm demand and vice versa. Hence, they are valuable for spotting new trades and for taking profits.
Finding reliable support and resistance is a crucial ability of a professional trader. Support and resistance are market supply and demand manifested as price action.
Focus on finding the support and resistance zones that matter for your trading plan. Doing so will help you to ignore the market noise on your charts.
There are many ways to find support and resistance. But for the best results, I recommend that you concentrate on analyzing price action and volume.
Overview
In this guide, you’ll learn five methods that focus on price action and volume to identify support and resistance.
- Swing Highs and Lows
- Congestion Areas
- Extremely High Volume
- Price Gaps
- Psychological Levels
#1: Swing Highs and Lows
When you are tracking market swings, you are following the turning points of price action. (These turning points are also known as swing pivots.)
Each turning point is significant as it results from price action being supported or resisted by market forces.
- When the market encounters adequate support, it shows up as a swing low.
- When the market meets resistance, the result is a swing high.
Hence, observing market swings is fundamental to identifying support and resistance levels.
The chart below shows how the swing pivots (highs and lows) acted as support before flipping into a resistance level.
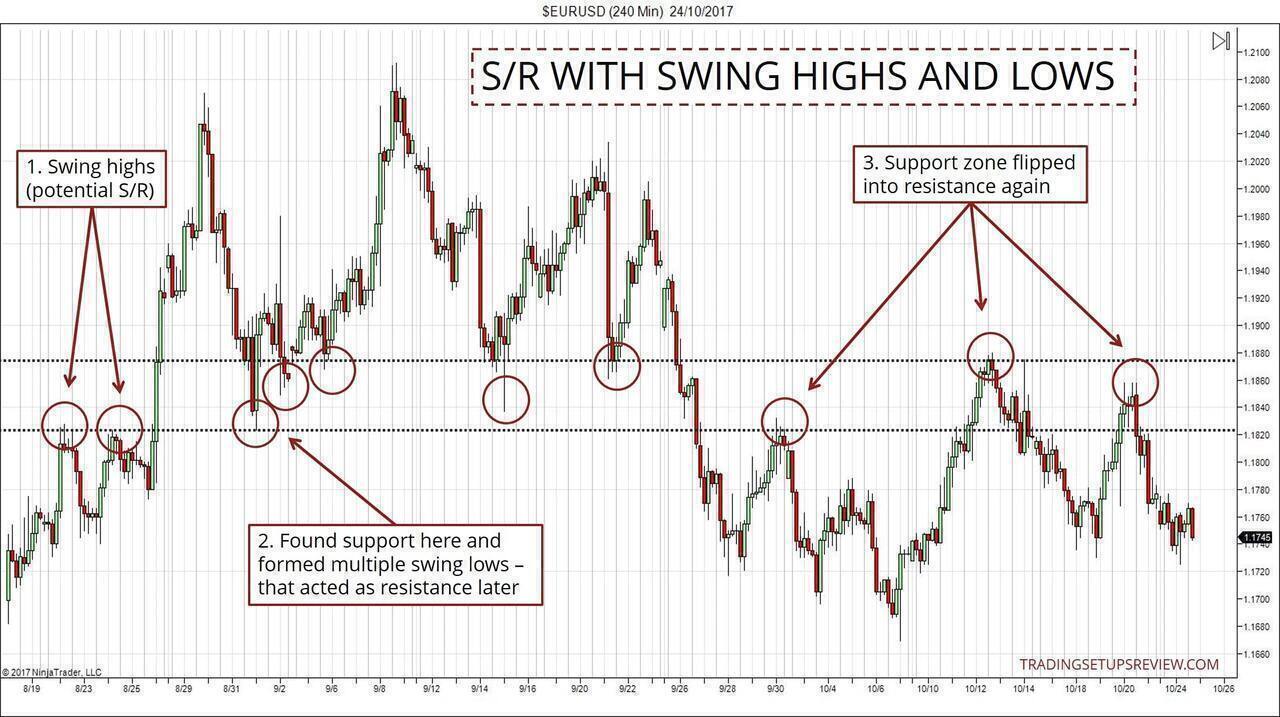
- These are the first two swing highs of the chart. Their proximity in both time and price implied that a resistance zone loomed above.
- Flipping from a resistance zone to a support zone and vice versa is common. Here, after the market broke above the double top, the resistance flipped and offered support to the market. Specifically, look at the multiple bounces off the price zone.
- The S/R zone here held sway for a substantial period, as it flipped again from a support level into a resistance level.
Many novice traders have only a vague introduction to drawing swing highs and lows. As a result, they lack precise rules for marking out swing highs and lows.
This subjectivity is a huge problem. On historical charts, you can easily mark out swing pivots that perform well as support and resistance. However, you will find it tough to replicate the same results with real-time price action.
To ensure consistency, you must have an objective system for marking market swings. E.g., the percentage method is a standard method for marking out swings. You can also use moving averages for this purpose.
(In my price action course, I used a swing analysis method based purely on candlestick highs and lows.)
#2: Congestion Areas
Congestion areas are one of my favorite ways to find support and resistance zones.
When the market congests within a price range, it is showing interest in that price range.
And that market interest is often not quickly forgotten. Thus, past congestion areas develop into significant support and resistance.
In the chart below, the blue zones are Congestion Zones as defined in Day Trading With Price Action.
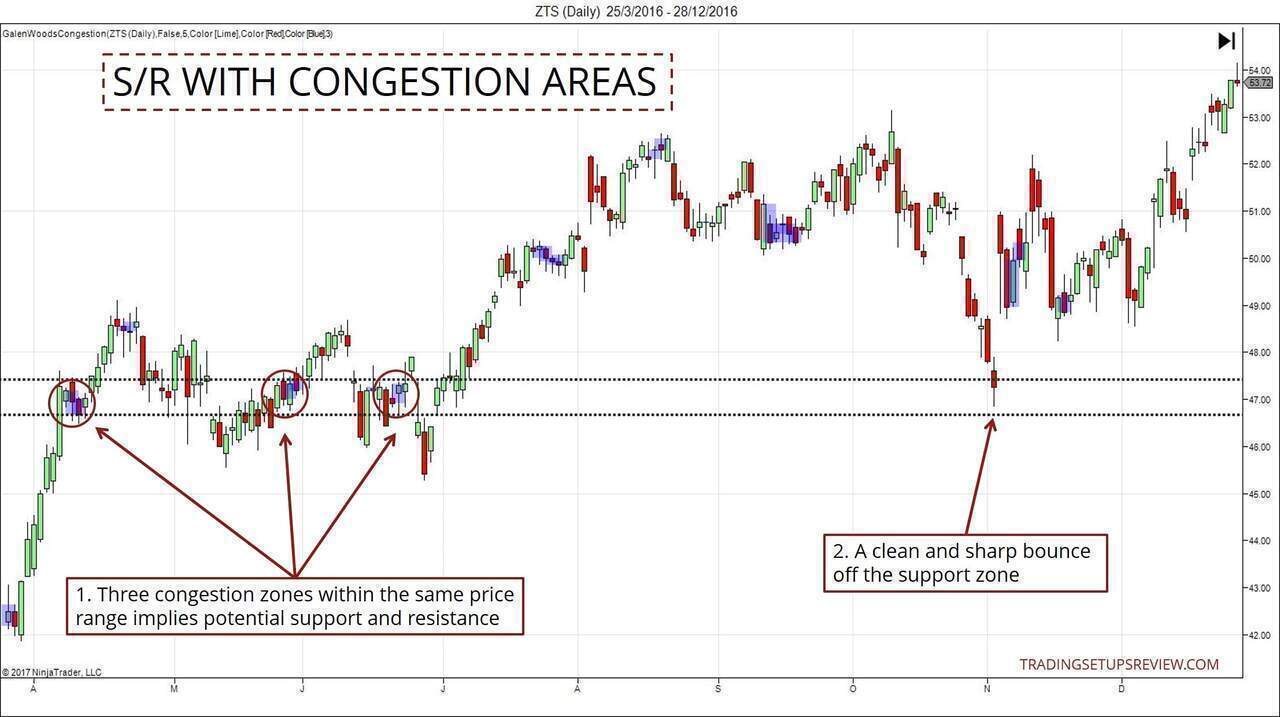
- Note the three Congestion Zones within a tight price range. This observation implied the potential of this range as a support (or resistance) area. With this, we could project a support zone to the right of the chart.
- Here, we saw its effectiveness as the market made a clean and sharp bounce off the projected zone.
Overlapping Congestion Zones form powerful support and resistance areas, but you might find it tough to take advantage of it when the market is still in congestion.
Be patient and let the congestion clear up. It is often less frustrating to wait for the market to move away from the meandering price action before projecting the S/R zone.
Learn more about trading with congestion areas with this article.
#3: Extremely High Volume
Think of support and resistance as market interest manifested as price action.
In essence, we are looking for signs that show the interest of the market. Naturally, we must not overlook trading volume.
If you are interested in the market, you trade it, contributing to its trading volume. And, of course, the same goes for everyone else. Hence, trading volume is a powerful indicator of market interest.
To put this idea into practice, look for price bars (candlesticks) with extremely high trading volumes. Then, make use of them to project support and resistance.
What is exceptionally high volume?
The definition I use:
Volume that exceeds the long-term average volume by at least three standard deviations
This idea translates to identifying these extreme signals with the Upper Band of a Bollinger Band applied on volume.
(If you use TradingView, you can use this indicator to identify volume spikes.)
Before we move on, let’s take a look at one example.
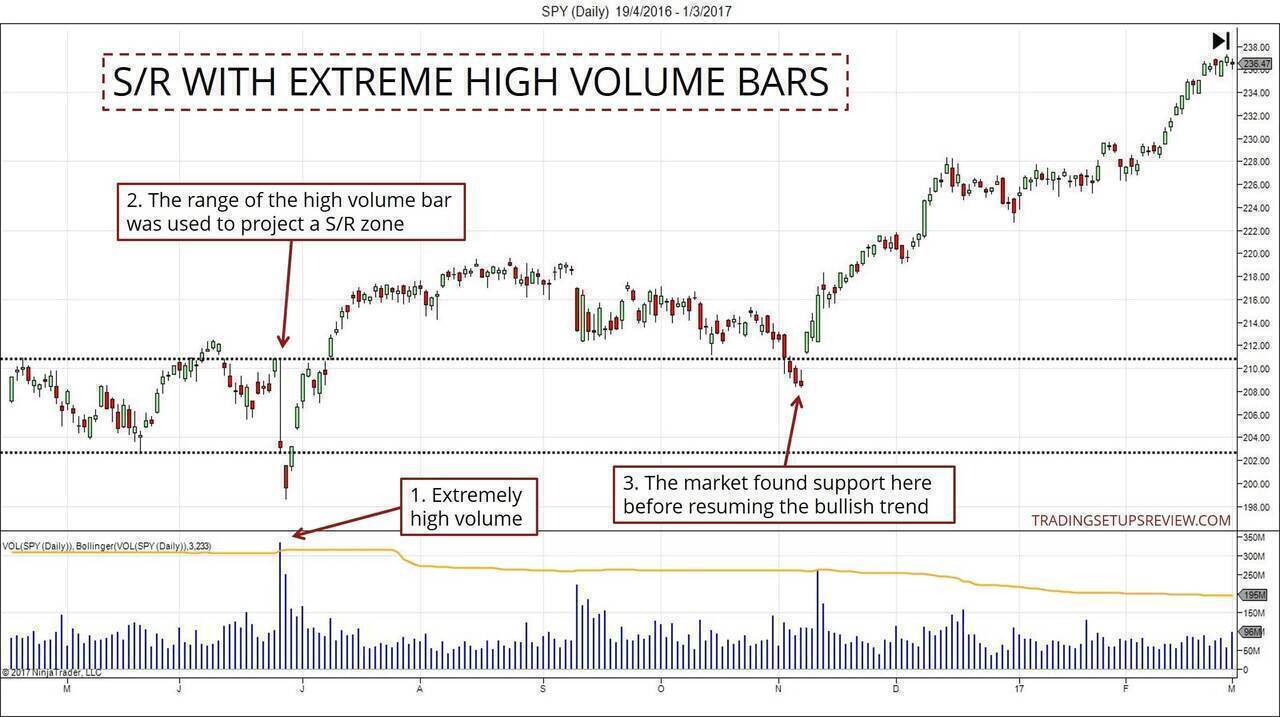
- A volume spike - a candlestick with extremely high trading volume.
- Here, we used the high and low of the volume spike bar to project a potential support zone.
- The bull trend did not take off in earnest until after it tested the support zone.
If you look closely at the price action before the high volume bar, you will notice sideways trading. This is because both congestion areas and high volume bars are signs of market interest. Hence, it’s not uncommon for them to occur together.
For more examples of trading with volume spikes, refer to Reliable Support and Resistance Zones With High Volume Signals.
#4: Price Gaps
Price gaps are also practical support and resistance zones. Why?
Gaps create a vacuum. Although the market has moved past them, no actual trading has taken place within the gap zone.
Hence, traders who intended to buy or sell within the gap range missed their chance to do so. And they are now waiting for the market to give them a second chance.
When the market returns to the gap, they will seize that second chance and send in their trading orders. This behavior creates the potential for support or resistance zone.
In the example below, you will see how a bearish gap acted as an effective market resistance.
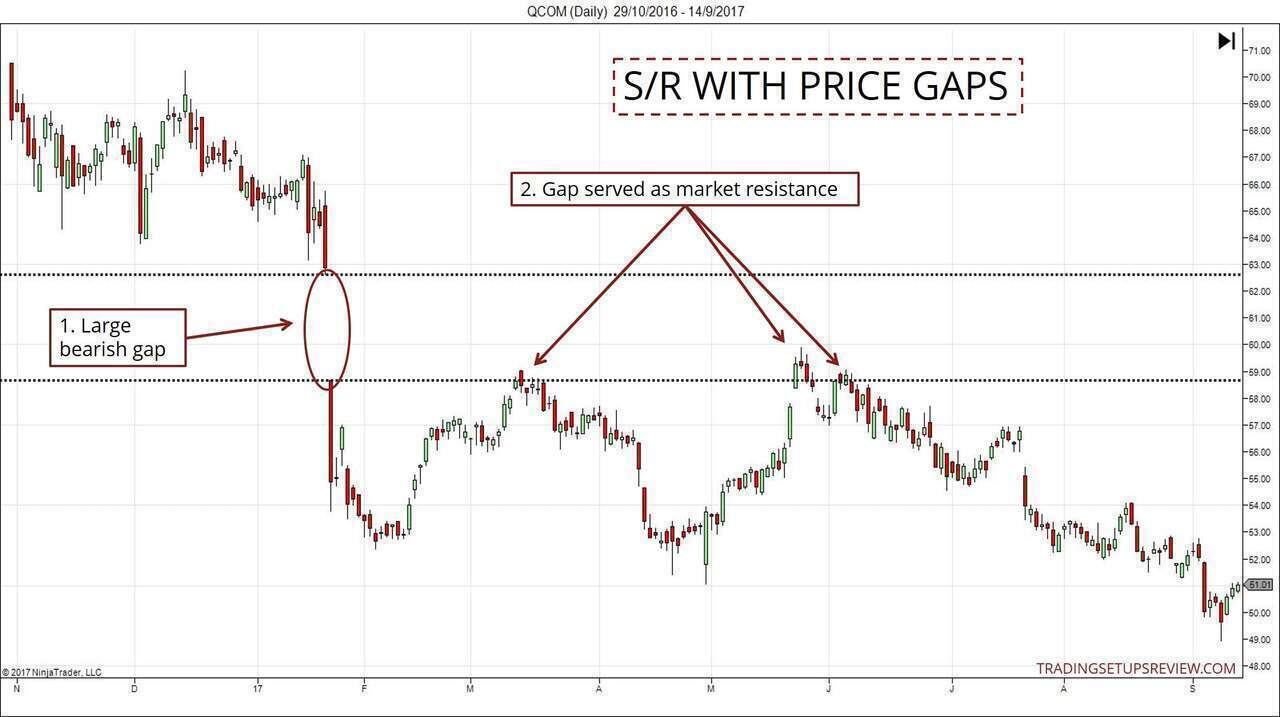
- This was a sizeable bearish gap that certainly made its impression in the market.
- At these points, the bearish gap acted as a solid resistance zone. The last swing high was a lower swing high and presented an excellent short entry.
Using price gaps as a support and resistance zone is a rewarding strategy for the patient trader.
Many traders get excited after an opening gap and are eager to get into the market. However, you might be able to work out a better reward-to-risk ratio if you aim to trade the support (or resistance) that the gap implies.
Let’s take a look at another example.
In this chart, I applied a custom indicator to mark out gaps that remain unfilled by the candlestick immediately following it.
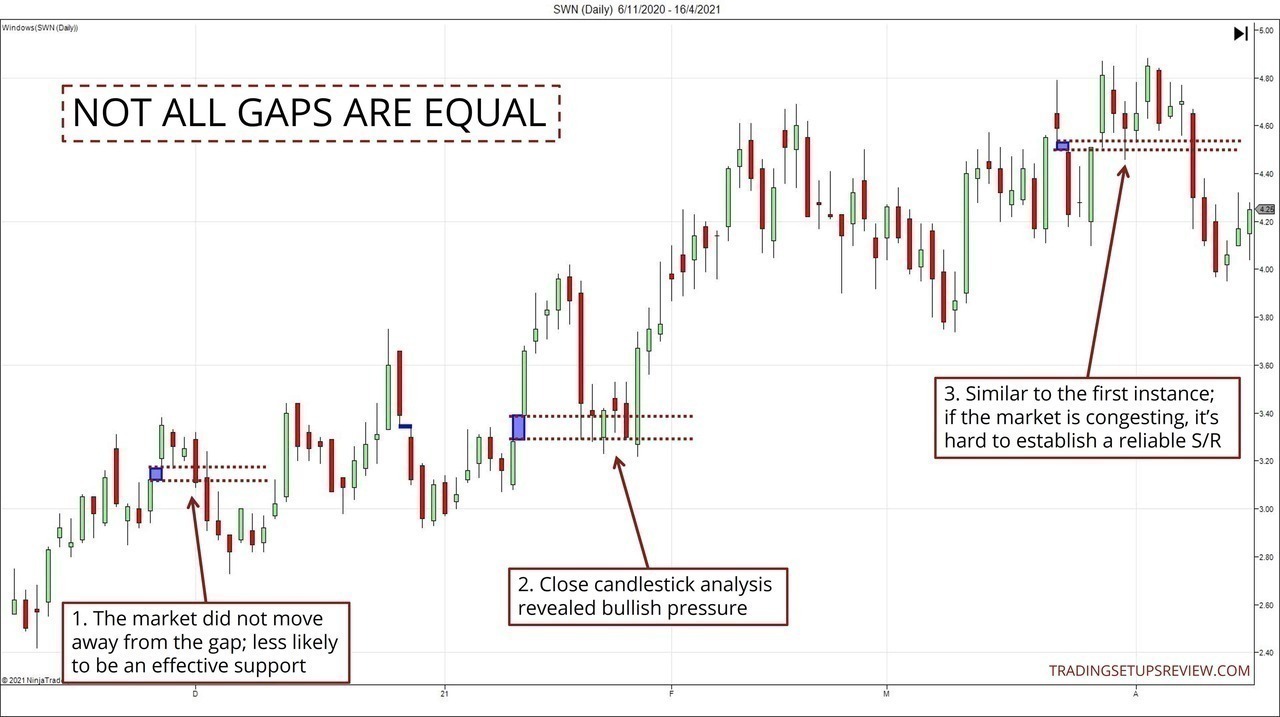
- The market did not move much away from the gap. Hence, the market was less likely to have established effective support at the level of the small price gap. We could also deduce the weakness of the support from how easily the bearish outside bar closed below it.
- In contrast, this gap served as a solid support zone. Most of the incursions into it were met with buying strength, as shown by the bullish reversal patterns.
- This gap was similar to the first instance in that the market was still meandering around the gap area. In such cases, the gap becomes less reliable as a support or resistance zone.
This extra example illustrates an important point - a close analysis of the price action around the potential S/R zone helps work out the reliability of the S/R zone. This idea applies regardless of the tactic you use to identify the S/R zone.
#5: Psychological Numbers
Take a look at these headlines:
- Wall Street points to lower open as investors eye Dow 20,000
- S&P 500 Closes Above 2000 for First Time
- Nasdaq Breaks Through 6,000 Barrier, But Should We Party Like It’s 1999?
They are just a tiny sample of headlines that demonstrate the market’s interest in specific round numbers.
The line chart below shows how the $50 and $100 levels acted as support and resistance for QQQ (NASDAQ 100 ETF).
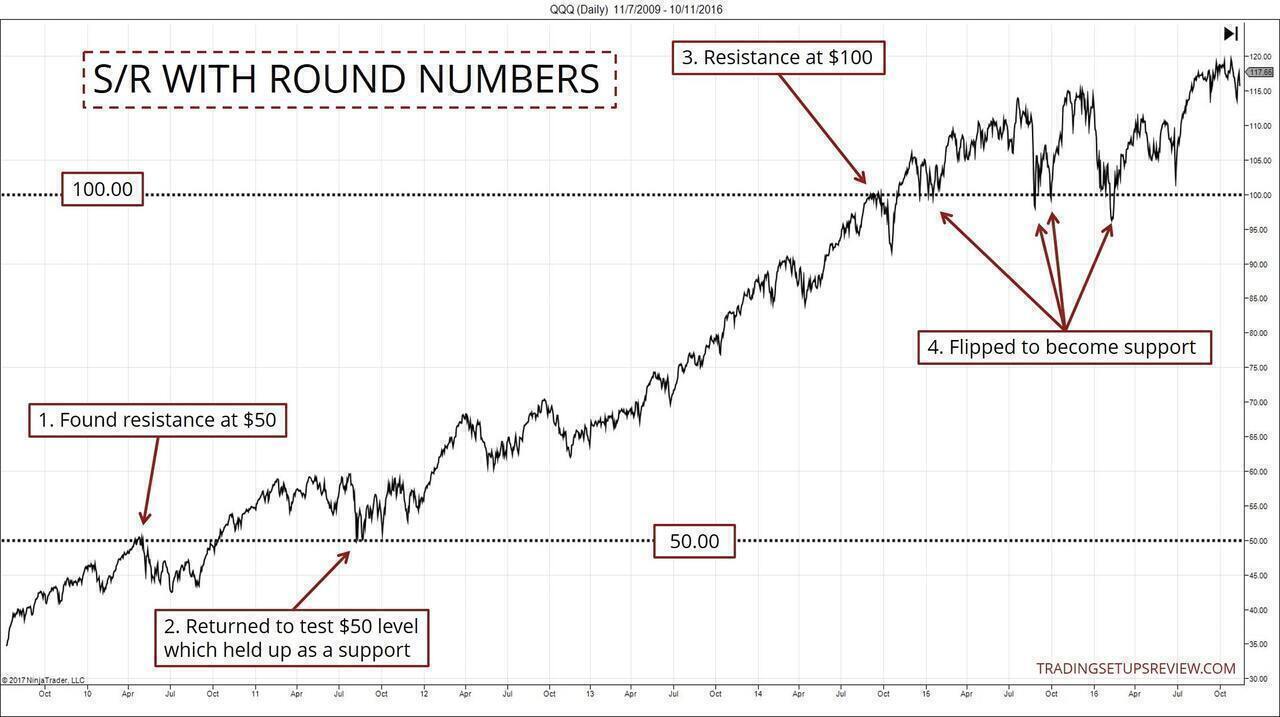
- Resistance at $50 level.
- After the market broke above the $50 level, it returned to test it a few times as a support zone.
- We observed a similar pattern at the $100 level.
- The $100 level turned out to be a critical support level.
(Interesting exercise - open up a QQQ chart and examine the $200 and $300 levels. One level worked better as an S/R than the other.)
Certain price levels have a psychological impact on investors and traders. Consequently, these levels attract the market’s attention.
Again, it’s all about market interest. And round numbers are the prime example.
The Natural Number Trading Method is a trading strategy that tries to capitalize on this collective psychology.
Conclusion
For finding support and resistance, the key concept is market interest. Therefore, you want to find the price zones that the market is interested in.
Here, we explored five tactics to do so. You can, of course, combine the tools above for a more compelling picture of the market.
However, it’s good to stick with one primary technique to find support and resistance. Then, use other tactics to supplement it. This way, you will not dilute your attention by trying to watch out for too many features.
We discussed the methods above mainly in the context of the daily timeframe. If you are a day trader, you might also want to keep an eye on these levels:
- High, Low, Close of the previous trading session
- VWAP
- Opening Range
Another point to note is this. Finding support and resistance is not enough for a trading strategy.
It gives you a solid awareness of the market conditions from a technical trading perspective. But to create a trading framework, you need to move on to observe how price behaves around support and resistance. In particular, watch the volatility and price action around the support and resistance.
Then, form a plan to determine an entry trigger, stop-loss point, and profit-taking point. Only then, you have a workable plan that you can improve on systematically.
Finally, remember that identifying support and resistance is more of an art than a science.
There is no guarantee that the support and resistance you find will hold up each time. Instead, you should know that projected zones will fail you sooner or later.
Nonetheless, support and resistance remain crucial concepts that a technical trader cannot ignore; knowing how to identify support and resistance will definitely upgrade your trading performance.
For a detailed discussion on interpreting support and resistance, check out this guide.
The article was first published on 27 October 2017 and updated on 3 November 2021.