Trading Candlestick Patterns With Relative Strength Index (RSI)
By Galen Woods ‐ 6 min read
Combining candlestick patterns with Relative Strength Index (RSI) increases the odds of a successful reversal trade setup. Learn how to find RSI divergences.
In Steve Nison’s well-known work, Japanese Candlestick Charting Techniques, he included a section on using candlesticks with oscillators including stochastics, RSI, and moving average oscillator. Crucially, he observed that oscillators are objective and augment the more subjective candlestick patterns.
This review will focus on trading candlestick patterns with Welles Wilder’s Relative Strength Index (RSI). This popular indicator measures the momentum of gains and losses.
What does relative strength mean?
In Wilder’s formulation, relative strength refers to the ratio of average gain to average loss. These averages are calculated in a way similar to the exponential moving average. The subsequent steps transform the relative strength into a bounded index that fluctuates between 0 and 100.
In the trade setups below, we will look for two features:
- Candlestick patterns
- RSI divergences
If you are not familiar with the concept of oscillator divergence, no worries, here’s a short introduction.
In a nutshell, divergences occur when the RSI does not support price action.
The diagram below illustrates a bearish RSI divergence.
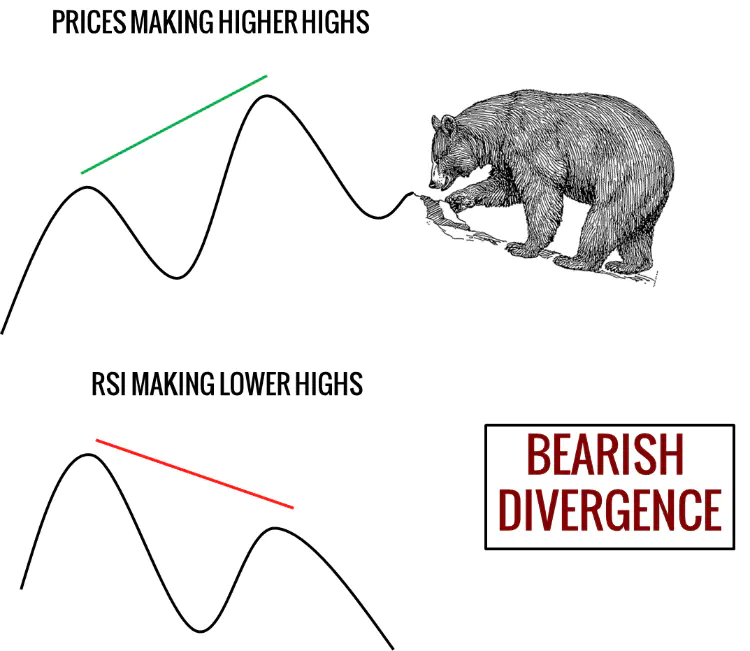
- When price action pushes to higher highs, we expect the RSI to do the same. When the RSI does not, we observe a bearish divergence. This situation is shown above.
- In the opposite situation, as price action pushes down to lower lows, we expect the RSI to go lower as well. If the RSI does not do that, a bullish divergence is present.
Trading Rules - RSI Divergence with Candlestick Patterns
The rules are straightforward.
In essence, we watch out for RSI divergences to set the context before pinpointing an entry with candlestick patterns.
Rules For Long Setup
- Bullish RSI divergence between the 14-period RSI and price action
- Enter a long position with a bullish candlestick pattern
Rules For Short Setup
- Bearish RSI divergence between the 14-period RSI and price action
- Enter a short position with a bearish candlestick pattern
For identifying RSI divergences, here is a helpful guideline:
- Start with oversold or overbought RSI levels for bullish and bearish divergences, respectively. They add another layer of support for the reversal setups we are looking for.
RSI Trading Examples
In each of the three examples in this section, we marked out the divergence and candlestick pattern we identified.
Example #1: Three-Point Divergence
This daily chart of International Business Machines (IBM on NYSE) shows two consecutive bearish divergences (also called a three-point divergence).
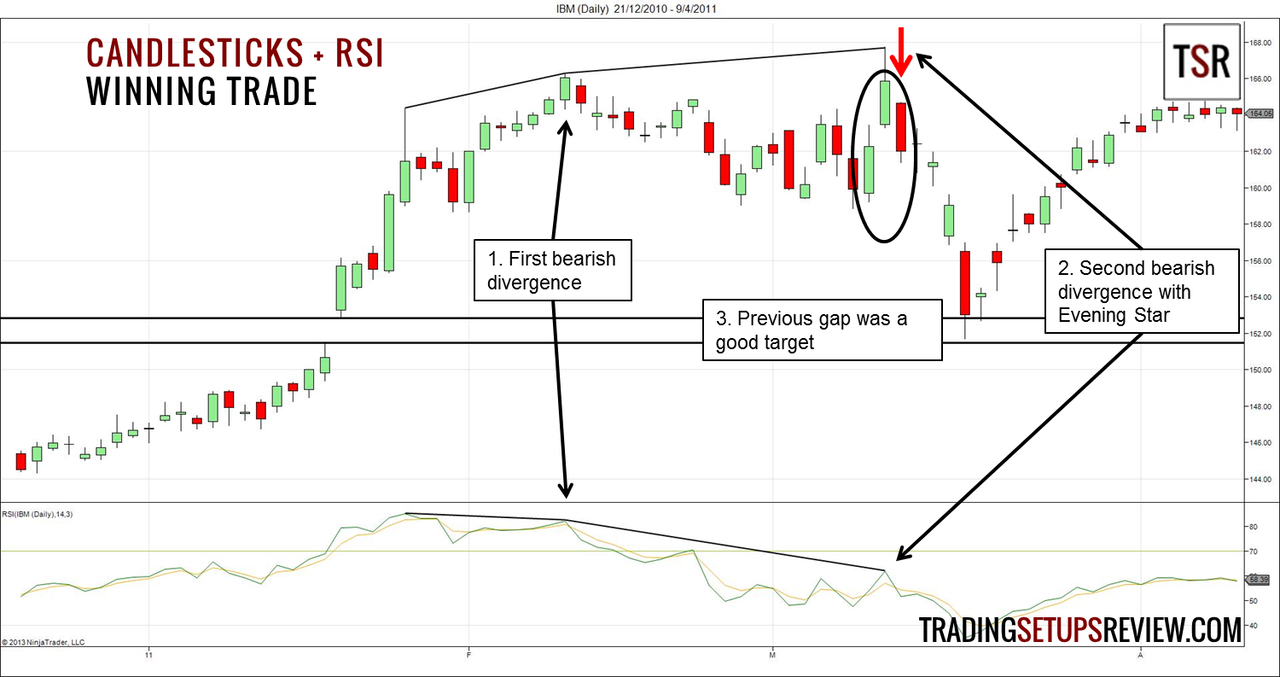
- As prices pushed higher, the RSI made a lower high which completed the first bearish divergence. However, no remarkable candlestick reversal pattern was present, so we sat on our hands.
- The market made another high after some sideways movement. However, the RSI did not make a higher high, and we got another bearish divergence. Although prices tested a new high, the market could not close above the previous trend extreme. This failure was a bearish sign. The next day completed an Evening Star candlestick pattern, and we shorted.
- The earlier gap (or window in candlestick-speak) was the perfect price target.
With an Evening Star candlestick pattern that failed to close above the trend extreme, shorting at the red arrow offered a quick and profitable trade if the target was conservative. After all, a full-fledged bear trend did not materialize, and traders gunning for that would have been disappointed.
Example #2: Losing Trade
This example shows a 10-minute chart of the futures on Germany’s blue-chip stock index (FDAX on EUREX). Its liquidity and volatility make it suitable for active trading.
Let’s take a closer look at this failed trade setup.
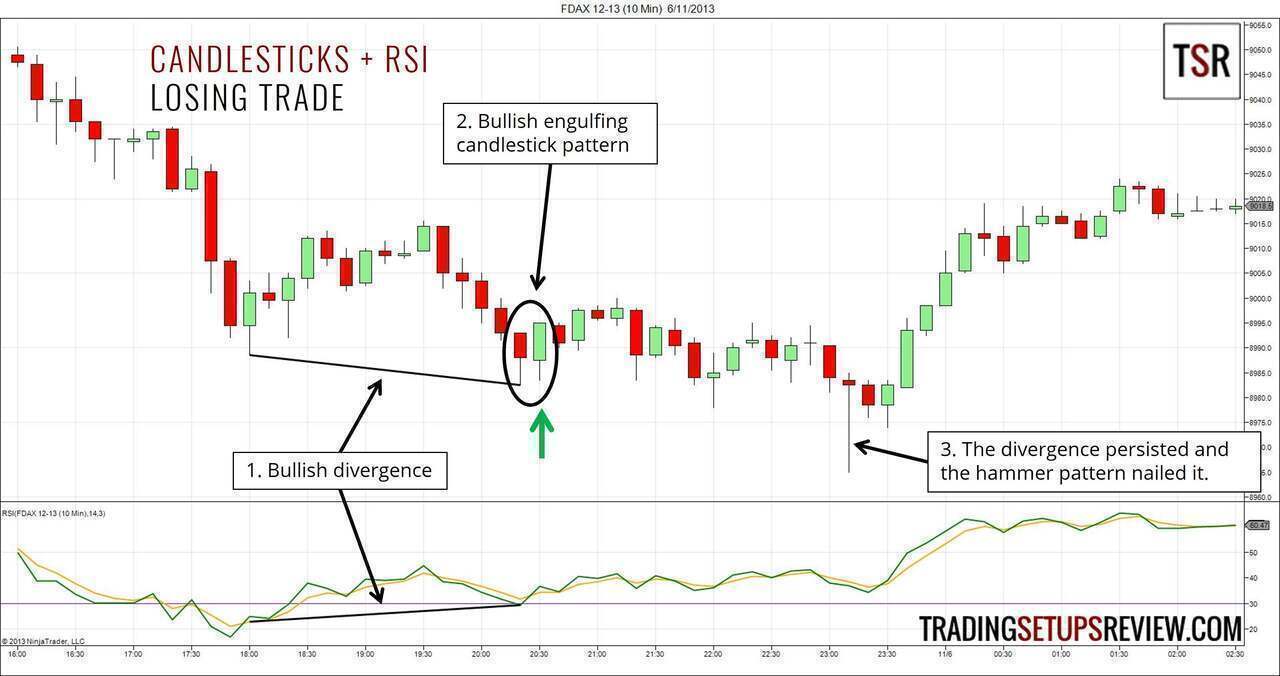
- Prices pushed to a lower low, but the RSI formed a higher low instead, forming a bullish divergence.
- A bullish Engulfing candlestick pattern formed with the bullish divergence, and a long setup presented itself (as shown by the green arrow). However, the trade went sideways for around an hour and stopped us out. (Our stop loss was below the setup bar.)
- However, after our losing trade, the bullish divergence continued. Eventually, the Hammer candlestick pattern nailed a profitable long trade.
In losing trades, there’s usually one of two issues. We got the context wrong, or we got the timing wrong. Here, it’s the latter.
In such situations, the key is to ensure proper risk control and a plan to re-enter if possible. The candlestick pattern offered a neat stop-loss level that helped with risk control.
Example #3: Two Divergences (Or One?)
This chart shows the daily candlesticks of Southwestern Energy Company (SWN on NYSE).
There are two bullish RSI divergences marked here.
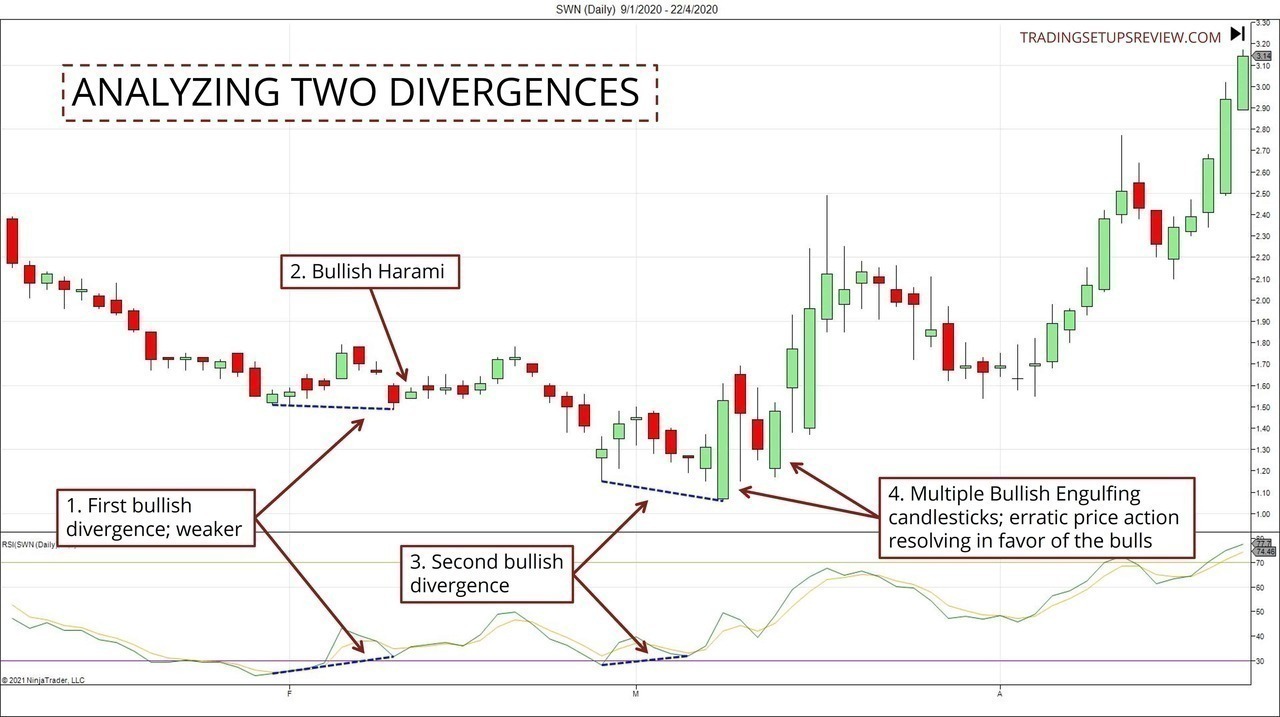
- This was the first bullish divergence. It had a weaker form as the lower low formed by the price action did not push much lower. Hence, the divergence was subtle.
- This bullish Harami offered a valid long entry. However, the market meandered sideways after that and did not reverse upwards beyond a couple of days.
- We observed a second bullish divergence. As this instance came soon after the first one, it looked promising.
- The second divergence formed together with multiple bullish Engulfing candlesticks. They gapped lower but closed higher, showing evident buying pressure. Eventually, the erratic price action resolved in favor of the bulls.
It’s crucial to understand that spotting divergences can be more of an art than a science. Let’s use this example to show why.
The chart below shows the same price action as the one above, but with only one divergence marked out.
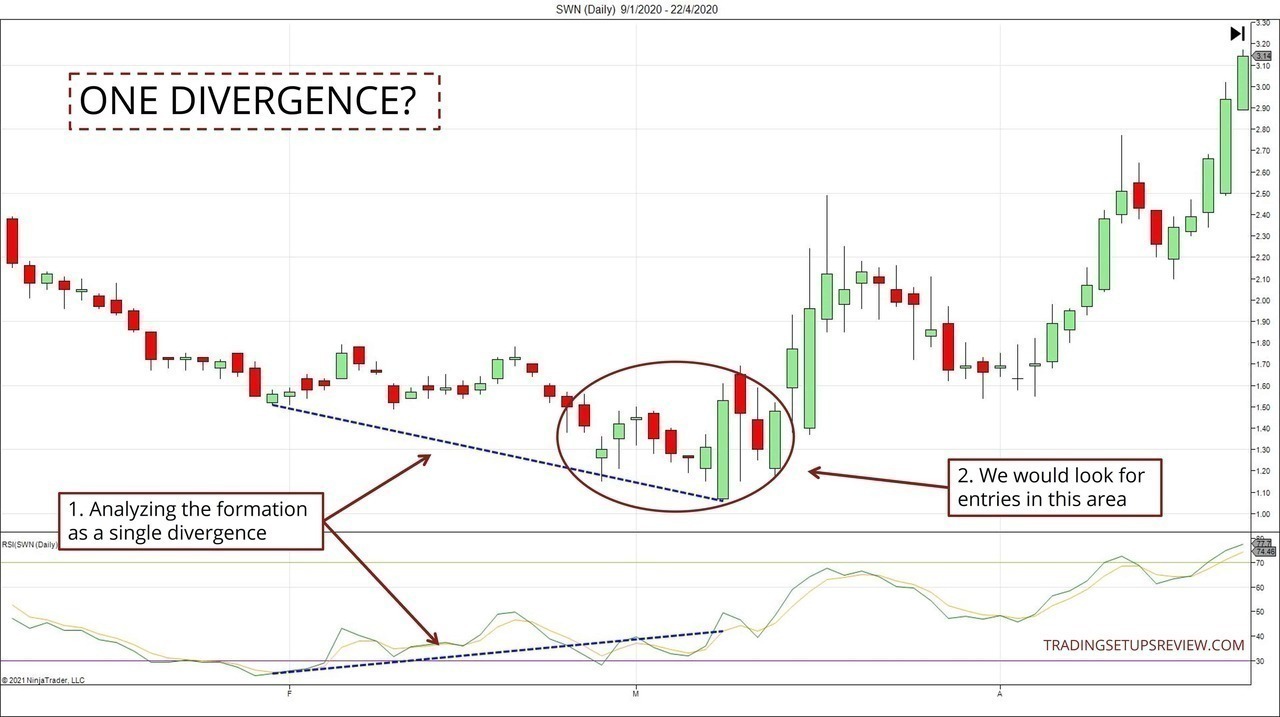
- If we take a step back, we could also analyze the context as a prolonged bullish divergence. This observation would establish a more potent context for bullish reversal trades. (It was also possible to identify a three-point divergence like the one in Example #1.)
- From this perspective, we would look for entries in this area that could offer better outcomes.
Review - Candlestick Patterns With Relative Strength Index (RSI)
This trading approach of combining candlestick patterns and RSI divergence generally produces reversal trade setups.
Compared to other types of setups, reversals have a lower chance of success and a higher reward-to-risk ratio. Using RSI divergences to find exhausted trends helps to improve the odds of a reversal trade.
However, the problem with divergences is that they merely hint at an impending reversal. The hints might keep coming, and coming, and coming before a reversal actually takes place.
While looking out for candlestick patterns helps pinpoint better entries, whipsaws are inevitable, and you will experience consecutive losses.
Hence, it’s helpful to be nimble and to scratch stalling trades if possible. Pay attention to the price action after entry. The best reversals happen swiftly, and you should see strong bars in your trade direction within two to three bars of your entry. If not, exit with a slight loss or profit and wait for better opportunities.
To find trading opportunities efficiently, you can use a stock scanner to scan for RSI divergence in a basket of stocks before looking closely to see if there is a proper trade setup.
For learning more about candlestick patterns and how to combine them with other oscillators like stochastics, you should refer to Steve Nison’s book, Japanese Candlestick Charting Techniques. which is a superb reference text.
If you’re interested in studying more candlestick patterns, here are a few more resources for you:
- Moving Averages with Candlestick Patterns
- Piercing Line Candlestick Pattern
- Marubozu Candlestick Pattern
- Belt Hold Candlestick Pattern
The article was first published on 1 December 2013 and updated on 18 November 2021.