A Practical Guide To Price Action Trading
By Galen Woods ‐ 15 min read
A detailed guide to price action trading, filled with practical advice, examples, and resources to bring your price action analysis to the next level.
Price action trading is often touted as an elusive magic bullet for traders. But the truth is that it is neither elusive nor magical.
It is not elusive. In fact, you can grasp the essential concepts of price action trading with ease.
But it is not magical as well. Price action trading is a just one of the many trading approaches. It does not magically produce profits.
The good news here is that you do not need a magical trading method.
To succeed as a trader, what you need is a practical trading approach that suits your personality.
- Want to keep things simple?
- Want to find out if price action trading is for you?
- Want to learn how to trade with price action without all the complicated jargon?
- Want to pick up a bottom-up price action trading approach?
If you answered yes to the questions above, this is the guide you need.
Guide Overview
Definition Of Price Action Trading
How To Read Price Action
- Price Bars
- Price Swings & Market Context
- Types of Price Action Trading Setups
Essential Price Action Trading Concepts
- Support & Resistance
- Trend Lines
- Price Patterns
Advanced Price Action Trading Concepts
- Multiple Failed Attempts
- Confluence
- Multiple Time Frames
Complementary Trading Tools
- Moving Average With Price Action
- Volume With Price Action
- Price-Only Charts
Building Your Own Price Action Trading Plan
- Entry Strategy
- Trade Execution
- Stop Losses
- Profit Targets
Advancing Your Price Action Education
- Simulation Trading & Analysis
- Resources For Further Studies
Definition Of Price Action Trading
Price action purists define price action trading as trading charts with no indicators. This definition holds a strict view that demonizes indicators.
This simplistic definition works well as a marketing line. It is attractive to traders who have grown disillusioned with indicators.
But this is not the best way to define price action trading.
What is the best definition for a practical trader?
Definition: Price action trading is trading with price movement as your principal focus.
A realistic trader wants to do what works, regardless of its label or classification. Hence, the exclusion of other trading tools is irrelevant.
If you find an indicator that is helpful, use it!
But remember to use it with price action as an anchor. Price action must remain the cornerstone of your trading strategy.
How To Read Price Action
Price action is a continuous flow of data. To analyze price action, you must first condense the data into discrete parts.
You can do this easily with OHLC price charts. OHLC means Open-High-Low-Close.
This means that the price chart must show the open, high, low, and close price of each trading period. (E.g., 5-minute, 1 hour, 1 day)
Both traditional Western bar charts and Japanese candlestick charts fit the bill here.
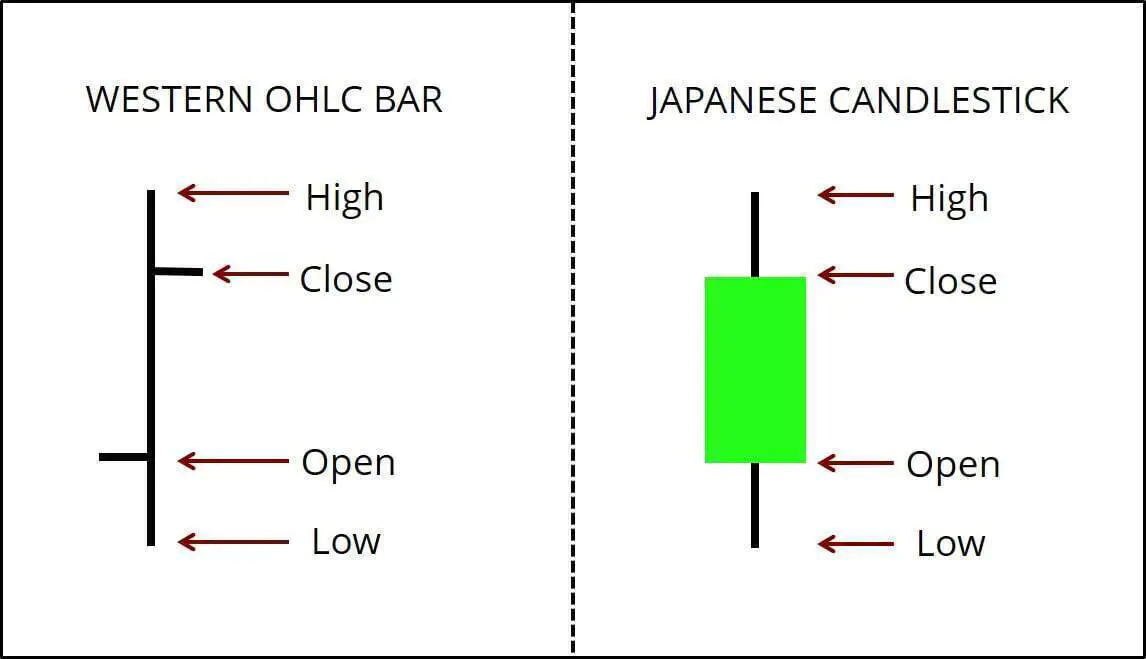
In this guide, we’ll use price bars and candlesticks interchangeably.
Our lesson plan for learning to read price action:
- Read price bars/candlesticks bar-by-bar.
- Observe price swings to determine the market context (trending or ranging).
- Understand the different types of price action setups suitable for each market context.
Price Bars
Learning how to read price charts bar-by-bar is a critical skill.
Hence, I’ve written a separate article - Beginner’s Guide To Reading Price Action.
I highly recommend that you read the article above to learn the basics of reading price action. It will bring you through a bottom-up approach to understanding price action.
After completing the Beginner’s Guide To Reading Price Action, the chart below will make sense to you.
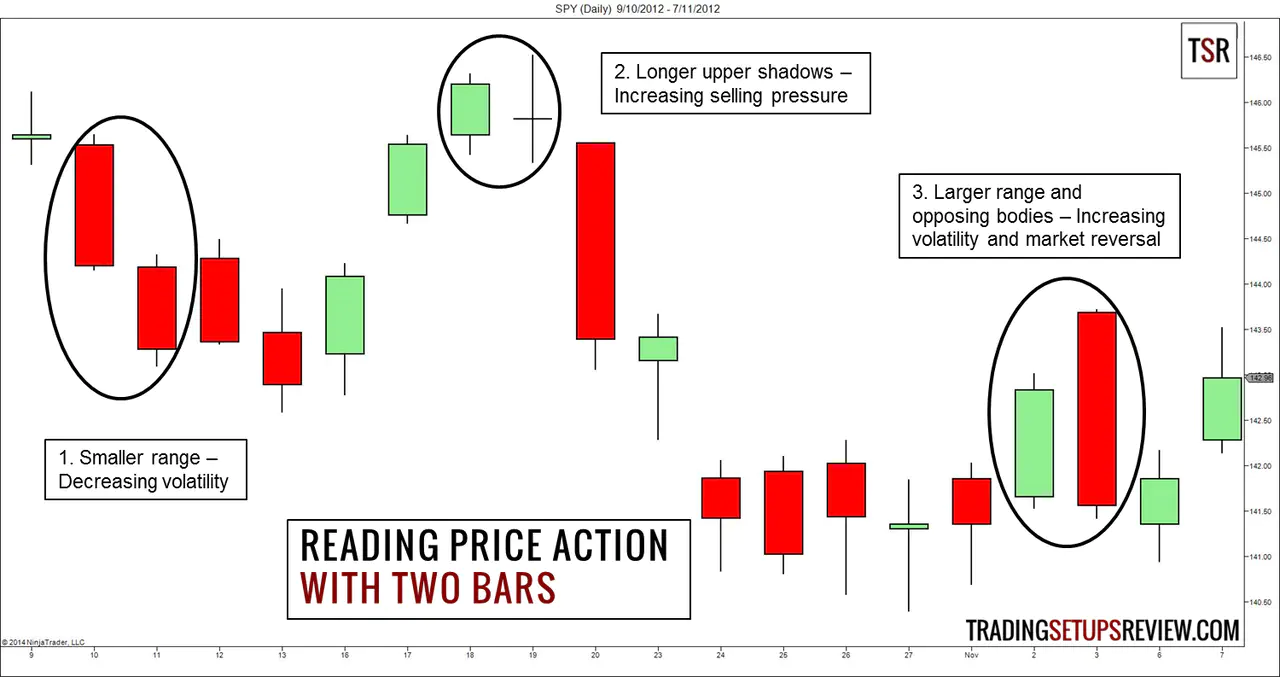
The rest of this practical guide is not going anywhere. You can return here after picking up the basics.
Price Swings & Market Context
Each time the market changes direction, a new price swing is formed.
Each turning point is a swing pivot. When a rising market turns down, a swing high is formed. When a falling market turns up, a swing low is formed.
Price swings highlight the market context.
To make sense of the market, you just need to observe the swing highs and swing lows.
Are they rising or falling?
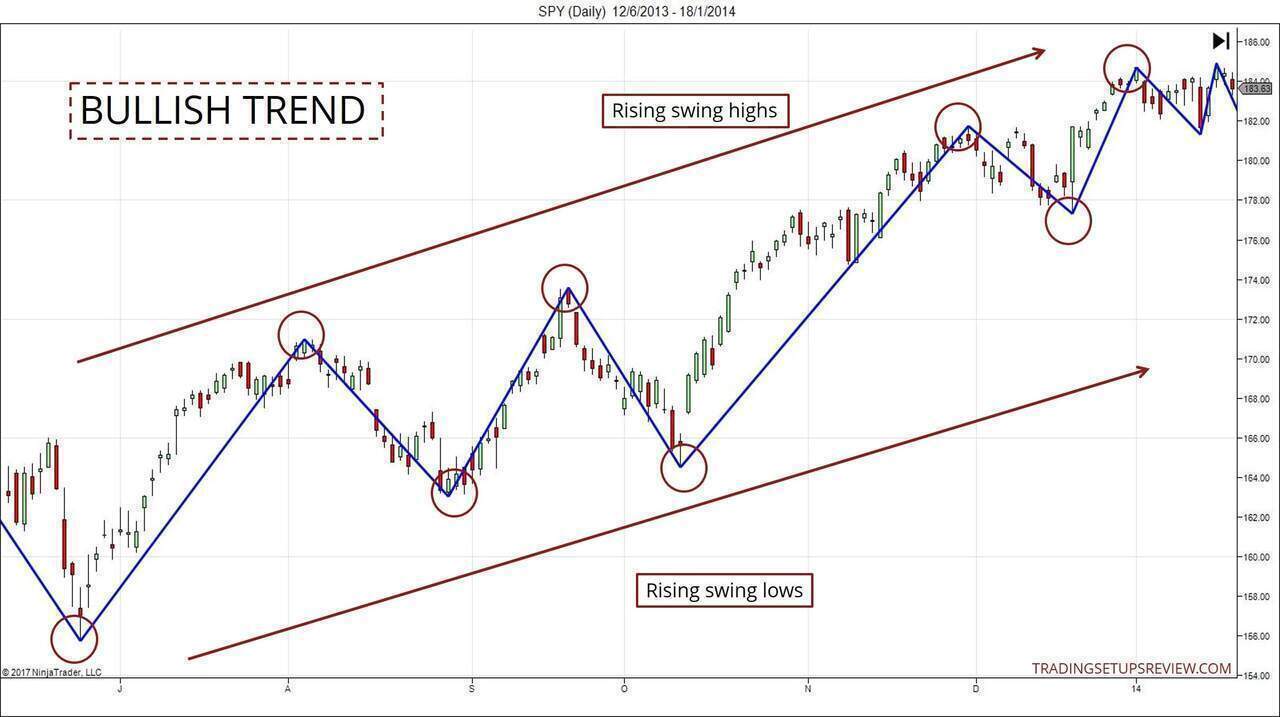
#1: They are rising.
If the swing highs and lows are rising, the market is in a bull trend.
#2: They are falling.
If the swing highs and lows are falling, the market is in a bear trend.
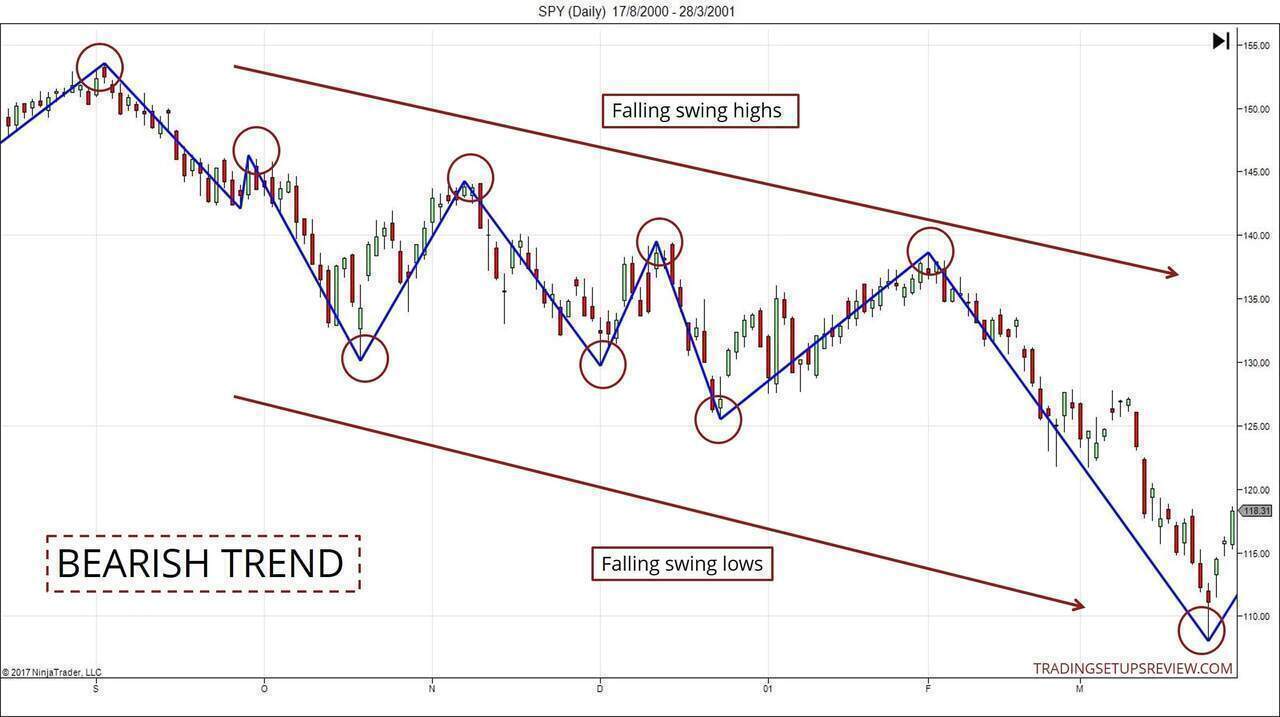
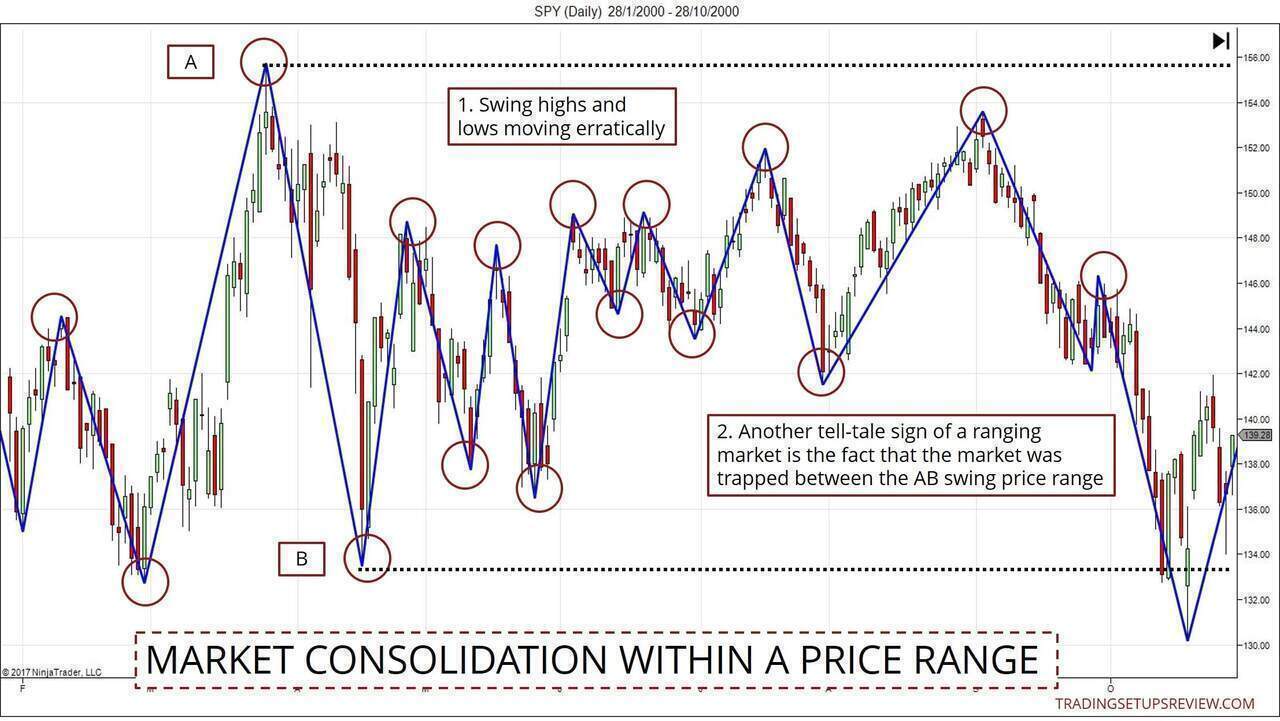
#3: I’m not sure.
If the swing highs and lows are giving you mixed signals, the market is consolidating.
Markets often consolidate before reversing its trend direction. This period is known as accumulation or distribution depending on the trend that follows.
In fact, the chart below shows the consolidation that took place before the bear trend shown in the previous chart.
Important Note on Drawing Price Swings
For price swing analysis to be helpful, you must employ a consistent method of identifying swings. You must not mark out the swings subjectively.
You need to use an objective framework for marking out swings. The swings drawn in the charts above are the tested and valid pivots taught in my course.
Types of Price Action Trading Setups
There are four types of price action trading setups:
- Retracement
- Reversal
- Range-Bound
- Break-Out
The first two, retracement and reversal, are setups you look for in a trending market.
The other two, range-bound and break-out, are setups you find in a ranging/consolidating market.
#1: Retracement Trading Setup
A retracement trading setup is also known as a pullback or throwback trade, depending on the market trend. Regardless of the label, these trades capitalize on the tendency of a trend to resume.
When analyzing a trend, it’s useful to know the difference between an impulse swing and a corrective swing.
- Price swings in the direction of the trend are impulse swings.
- Price swings against the trend are corrective swings.
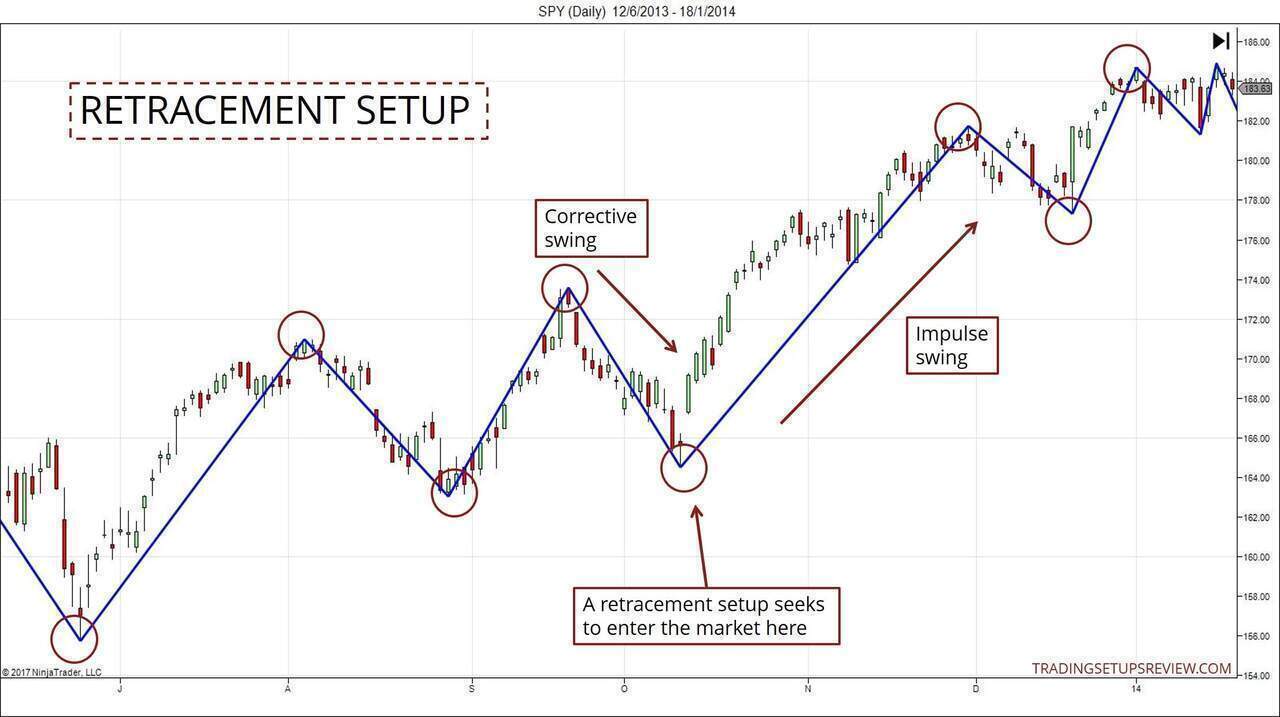
In a retracement strategy, you want to enter the market as a corrective swing ends. The aim is to profit from the subsequent impulse swing.
Hence, the crux here is to determine when a corrective swing is over.
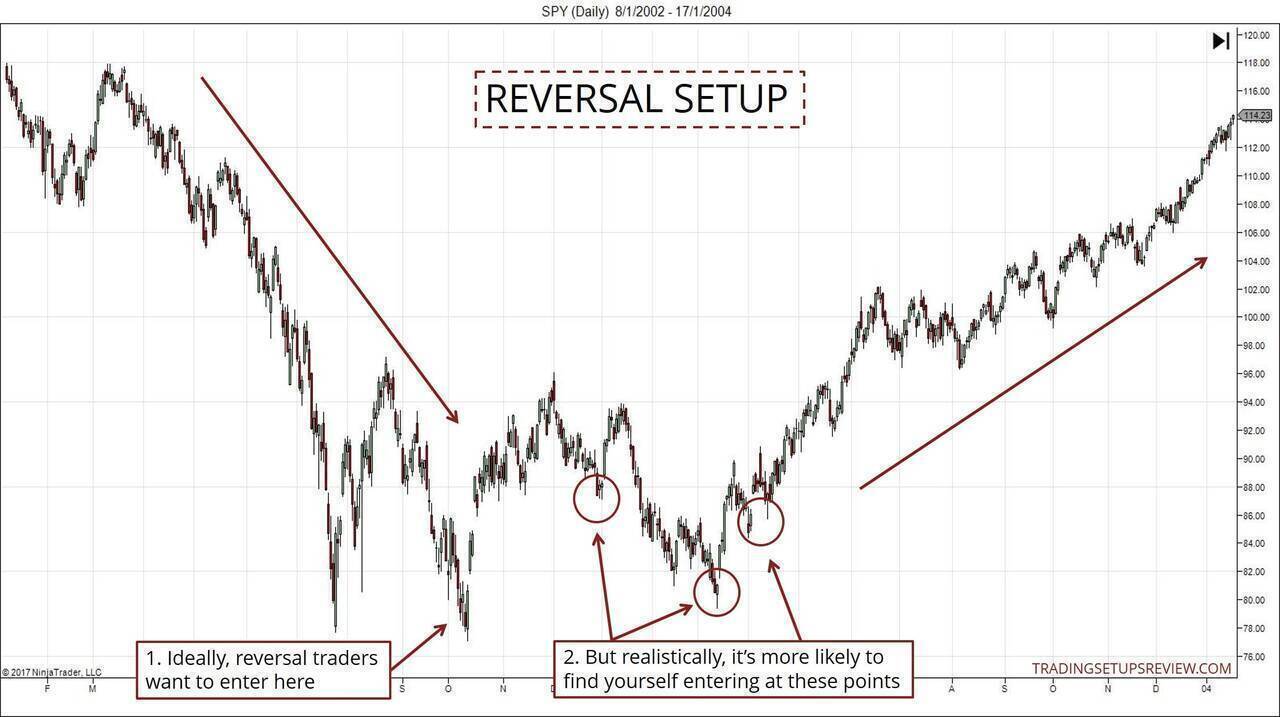
#2: Reversal Trading Setup
It’s trickier to catch a reversal, but the rewards are great when you do.
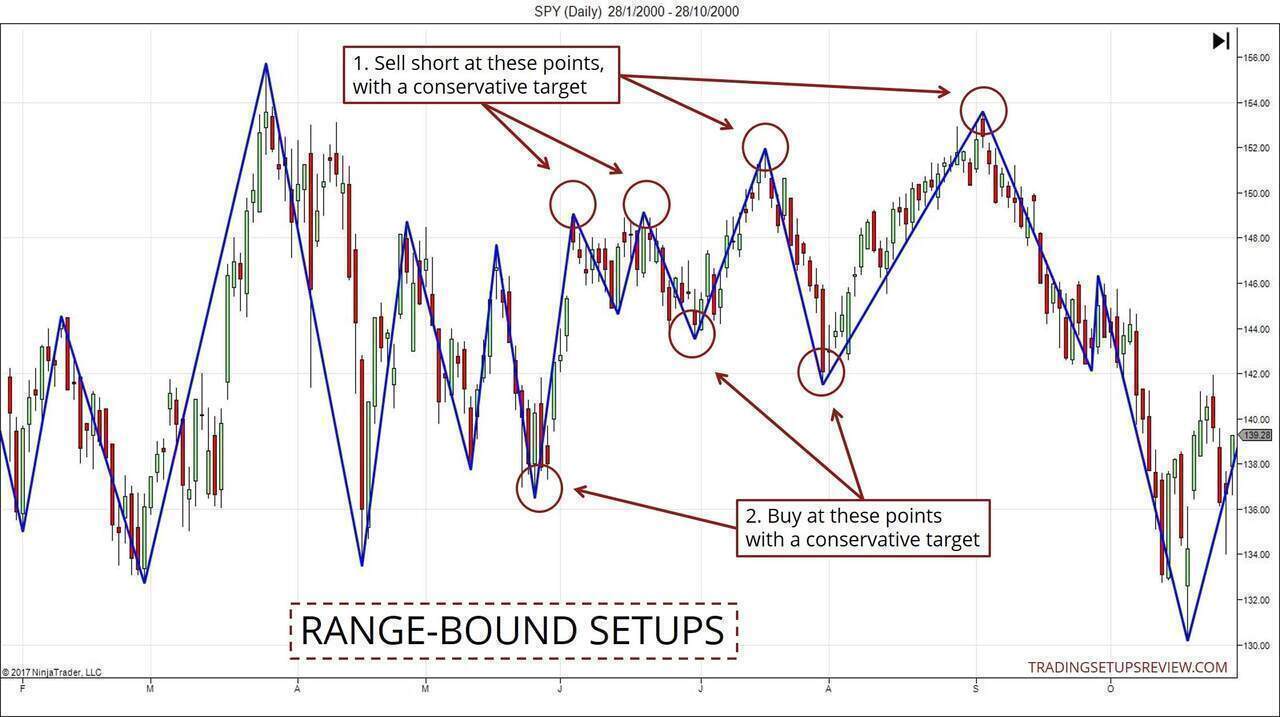
#3: Range-Bound Trading Setup
In a prolonged range-bound market, fading false break-outs of the range can yield excellent results.
However, as the market is trapped in a range, the profit potential is limited. Hence, it’s important to pay close attention to your reward-to-risk ratio.
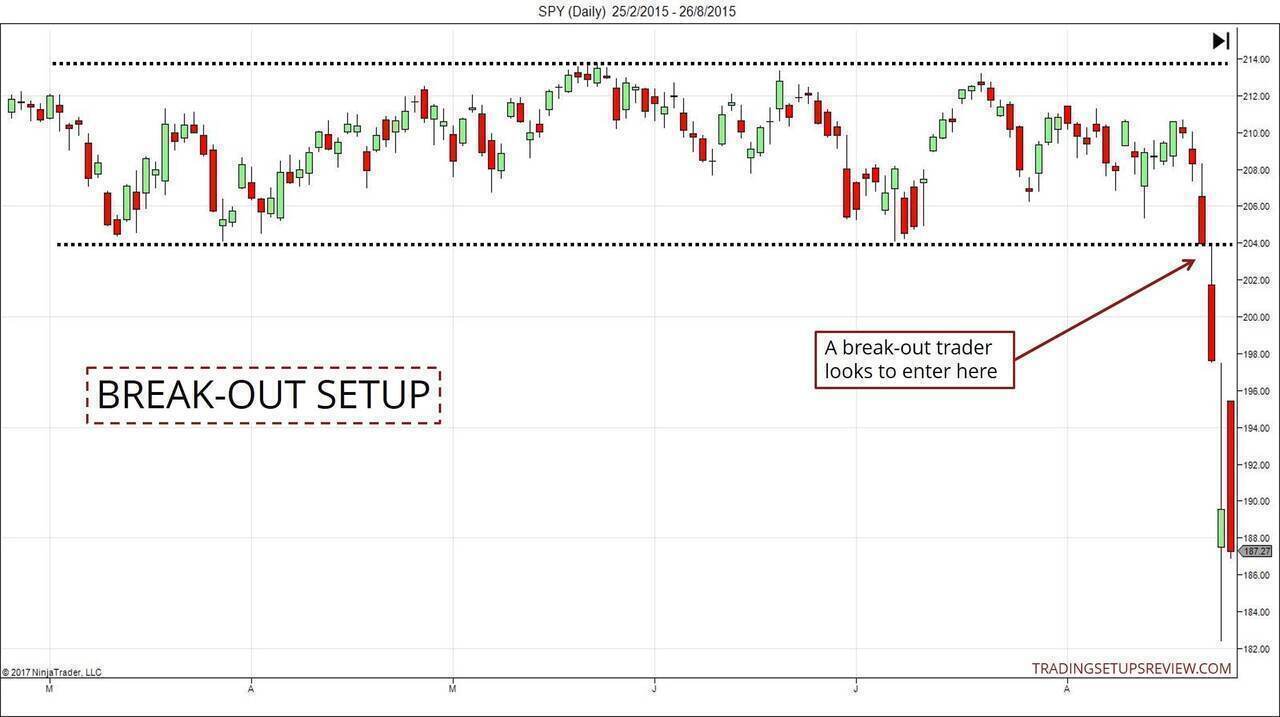
#4: Break-Out Trading Setup
A break-out trade is challenging because of the possibilities of many false break-outs.
However, if you spot the right signals, you are likely to enjoy a swift trade with an excellent risk-to-reward ratio.
In this section, you’ve learned how to read price action and judge the market context using price bars and swings.
We also took a look at the four kinds of setups in different market environments. Each setup type has a different risk profile. Hence, traders tend to gravitate towards particular type(s).
Regardless of your preference, it’s clear that we are interested in market turning points.
And in the next section, you’ll learn three vital tools to help you pinpoint these turning points.
Essential Price Action Trading Concepts
The core concepts are:
- Support and Resistance
- Trend Lines
- Price Patterns
Support and Resistance
Support and resistance (S/R) is the most important concept in price action trading.
Think of them as price zones that tend to reject prices.
A support zone is a price area that rejects falling prices. In other words, it is a price zone that supports the market from falling.
A resistance zone is a price area that rejects rising prices. It is a price zone that resists the market from ascending.
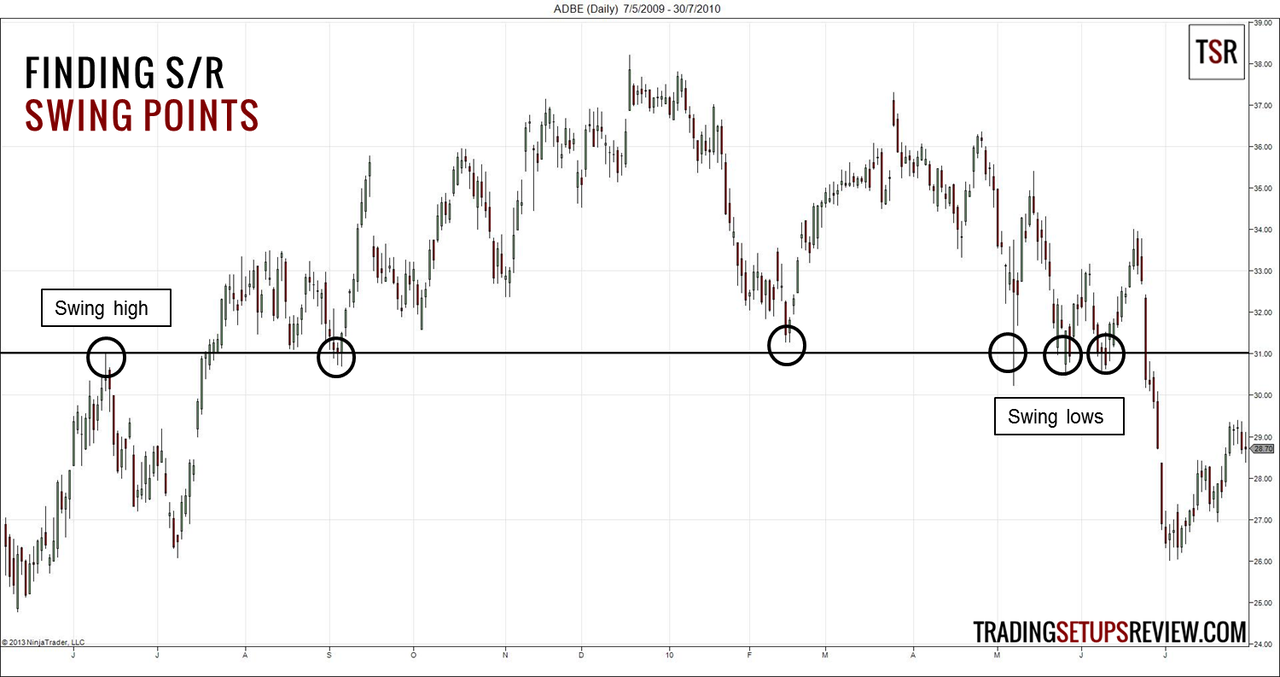
Standard methods used to determine S/R:
- Swing Highs and Lows (as shown in the chart above)
- Psychological Numbers
- Moving Averages
- Fibonacci Levels
- Pivot Points
- High Volume Signals
- Trend Lines
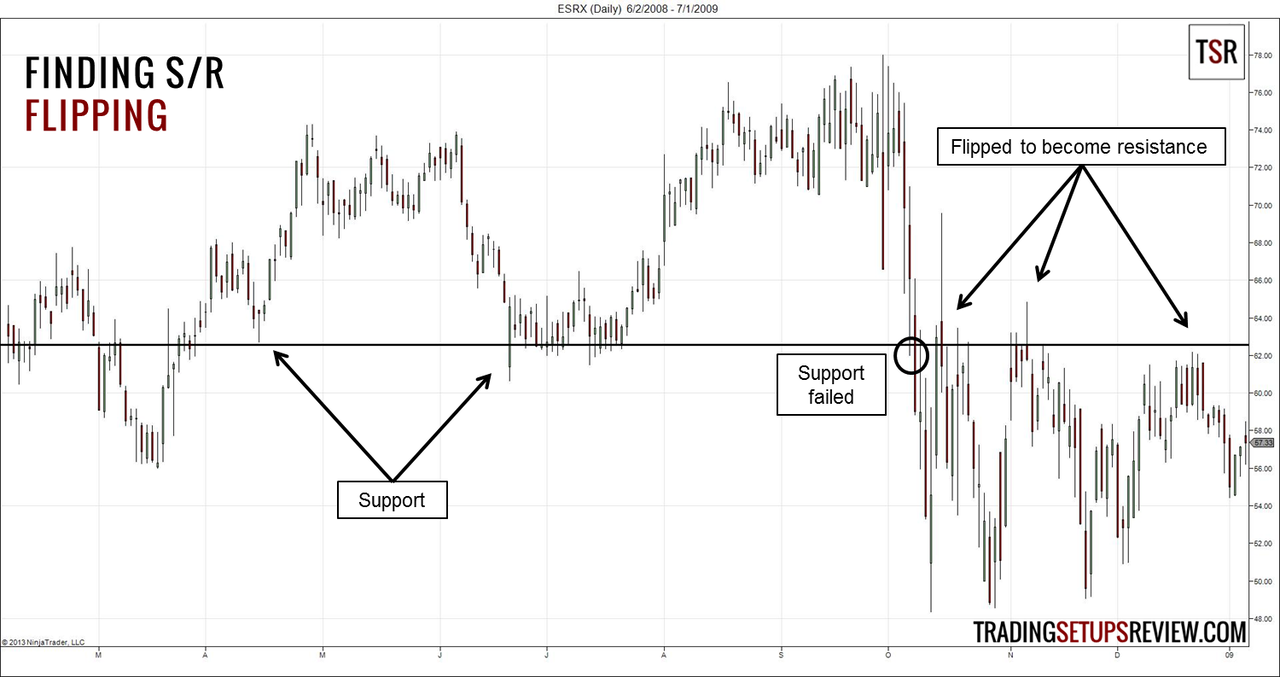
When using S/R in your trading, take note of the phenomenon of S/R flipping.
If a support zone fails, it turns into a resistance zone. Likewise, if a resistance zone fails, it becomes a support level.
Make sure you comprehend the idea of support and resistance.
The existence of S/R zones, together with market inertia, form a major part of a price action trader’s edge.
Trend Lines
As covered earlier, you can derive great insights simply by observing price swings. Trend lines allow you to amplify those acumens.
Trend lines are lines that highlight trends.
A bull trend line slopes upwards. You can draw it by connecting a pair of rising swing lows.
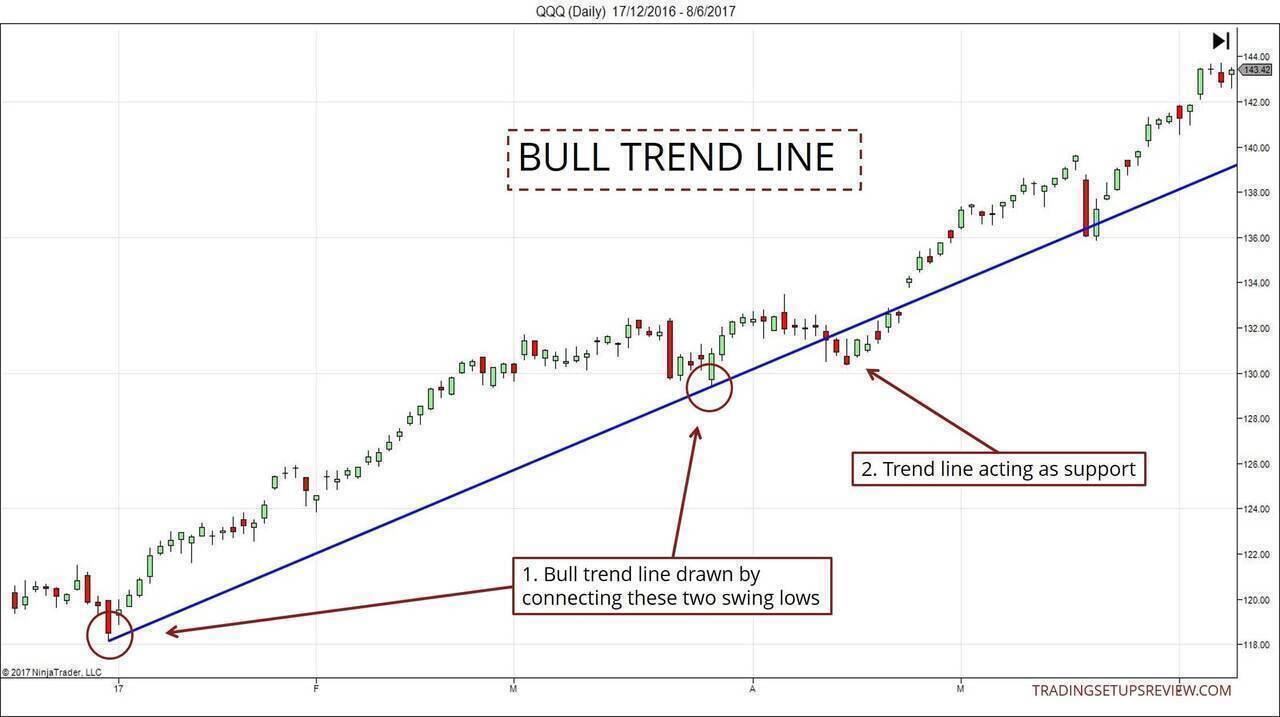
A bear trend line slopes downwards. Connect a pair of falling swing highs to get a bear trend line.
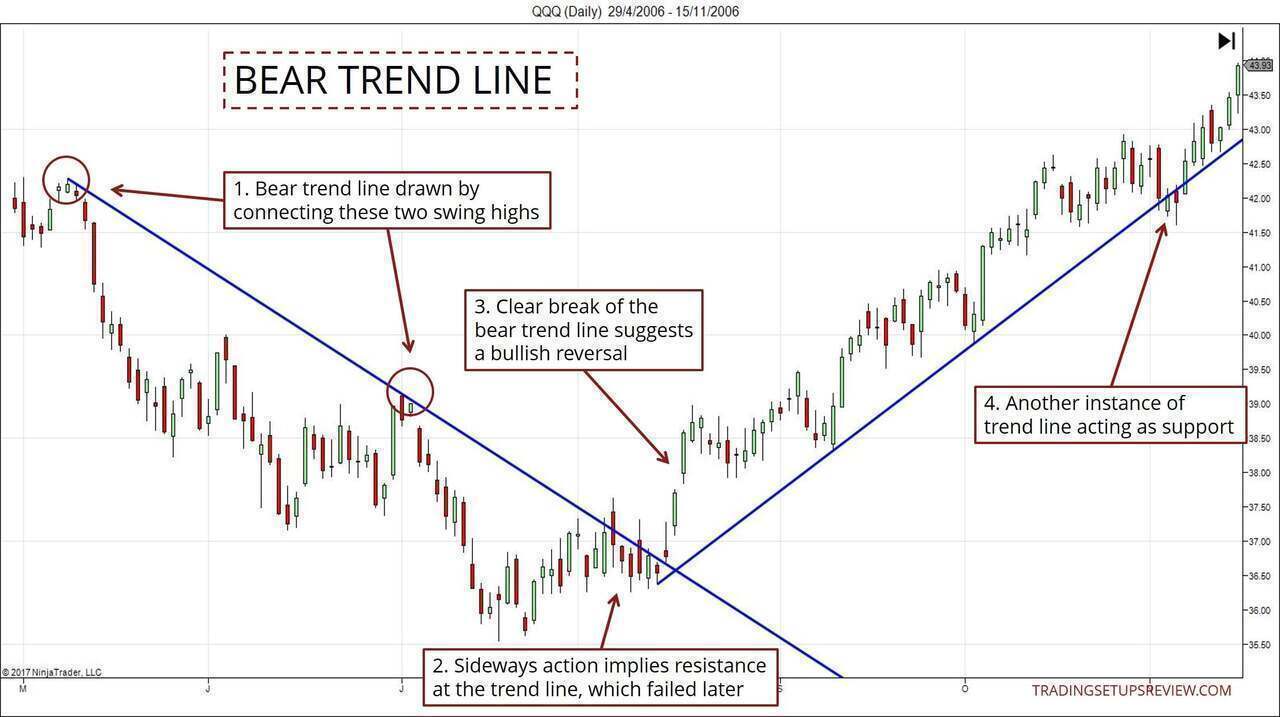
As shown in the examples above, trend lines act as a support or resistance. Hence, you can use trend lines to help you time your market entry.
On top of that, broken trend lines hint at a market reversal, making them a prime tool for tracking trends.
Price Patterns
Specific sequences of price movement can be useful. They tell us what the market is doing now, and offer clues to what it might do in the future.
These sequences are called price patterns. They are helpful for pointing out entry points and potential stop-loss levels.
Hence, price patterns form an integral part of a price action trading strategy.
Short-term price patterns include bar patterns and candlestick patterns. The diagram below shows a typical bar pattern known as Pin Bar.
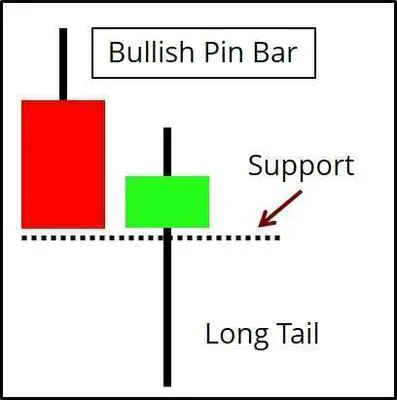
Both bar and candlestick patterns are based on pure price action. Hence, unsurprisingly, they overlap a great deal. Many bar patterns have a similar candlestick counterpart.
To make the most out of your price pattern study, I encourage you to review these price patterns in the pairs listed below.
Bar Pattern Pin Bar Inside Bar NR7 Outside Bar
-———— ————- ————- ————- ————-
Candlestick Pattern Hammer Harami Doji Engulfing
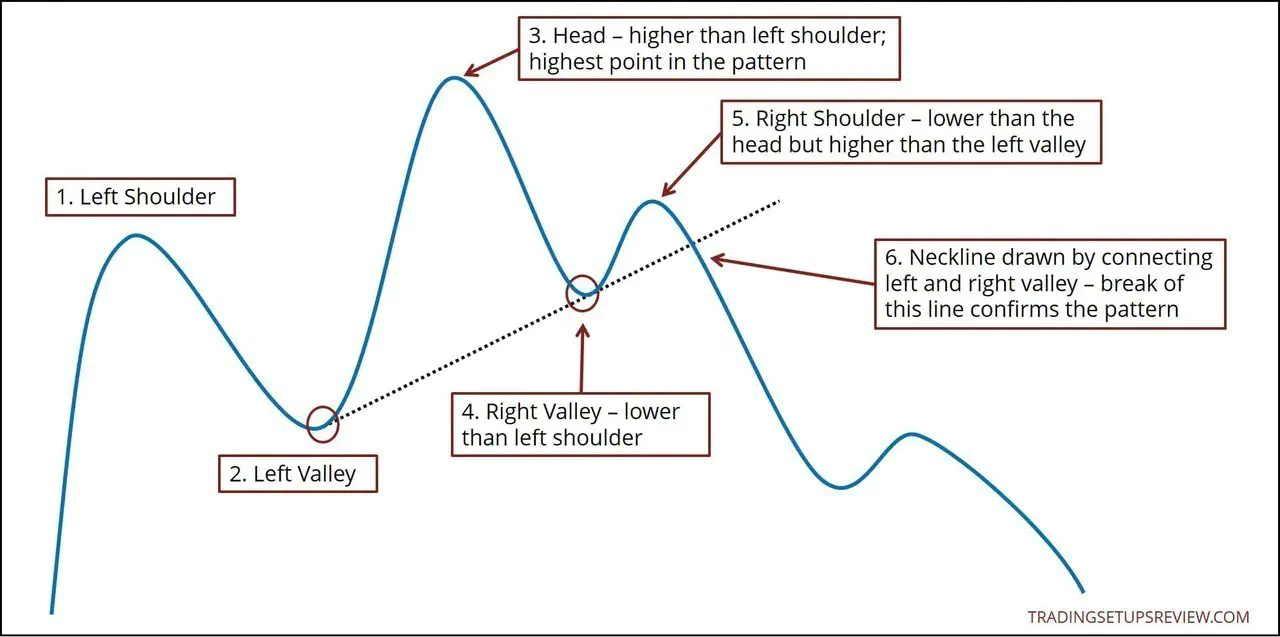
Price patterns that tend to form over a longer period are known as chart patterns. The example below shows the Head and Shoulders pattern, a striking reversal pattern.
Many traders focus on finding price patterns because they signal an entry. But price patterns should not be the cornerstone of your trading strategy.
This is because price patterns work best in the correct market context. Hence, your evaluation of the market bias is crucial.
Advanced Price Action Trading Concepts
Armed with S/R, trend lines, and price patterns, you can already start looking out for a trading setup.
But if you want to refine your price action tactics, take a close look at the following concepts.
- Multiple Failed Attempts
- Confluence
- Multiple Time Frames
Multiple Failed Attempts
When the market tries to do something and fails more than once, it is more likely to move in the opposite direction. (Concept of trapped traders.)
Take a look at these examples.
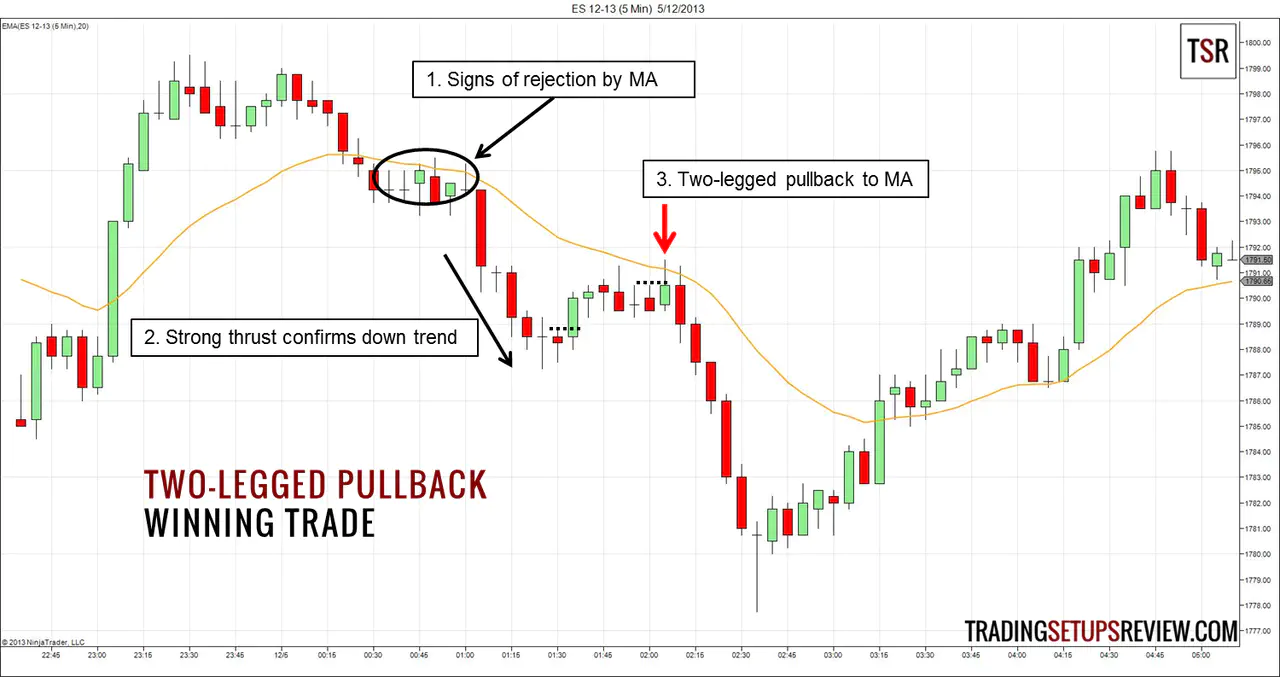
Example #1: Two Legged Pullback
This example shows the M2S trading setup that Al Brooks popularized.
In the chart below, you’ll see that the market made two attempts (two upswings) to move against the trend. Both attempts failed, and the market fell to new lows.
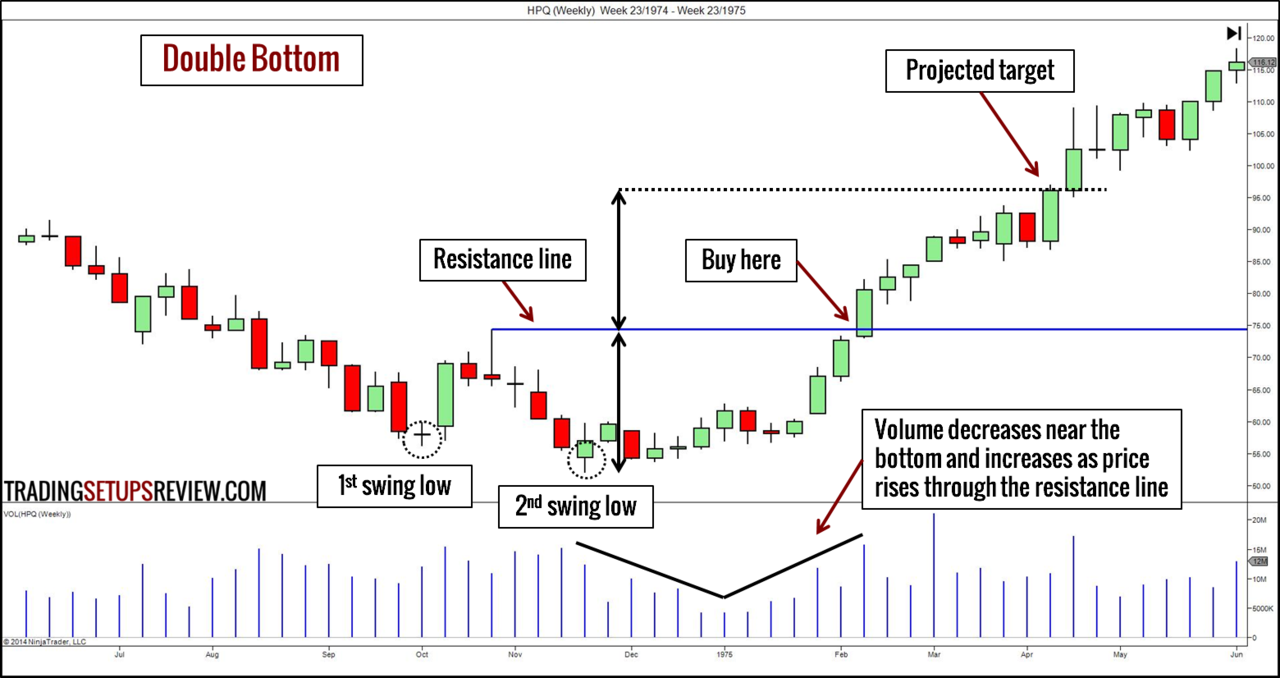
Example #2: Double Bottom Pattern
In the chart below, the market made two attempts to push lower before reversing up. This formation is the well-established Double Bottom reversal pattern.
Many compelling price patterns are the result of multiple failed attempts.
Hence, this is a principle you can rely on when interpreting price action. It is also the basis for the re-entry equivalent setup.
Confluence
Confluence refers to confirmation from different trading tools.
There are infinite possibilities here. Examples:
- A bearish Pin Bar at a resistance zone (A better short setup)
- A Triangle pattern projected a target within an earlier congestion zone (A more reliable profit objective)
- A bullish Outside Bar breaking the neckline of a Reverse Head & Shoulder pattern (A better long setup)
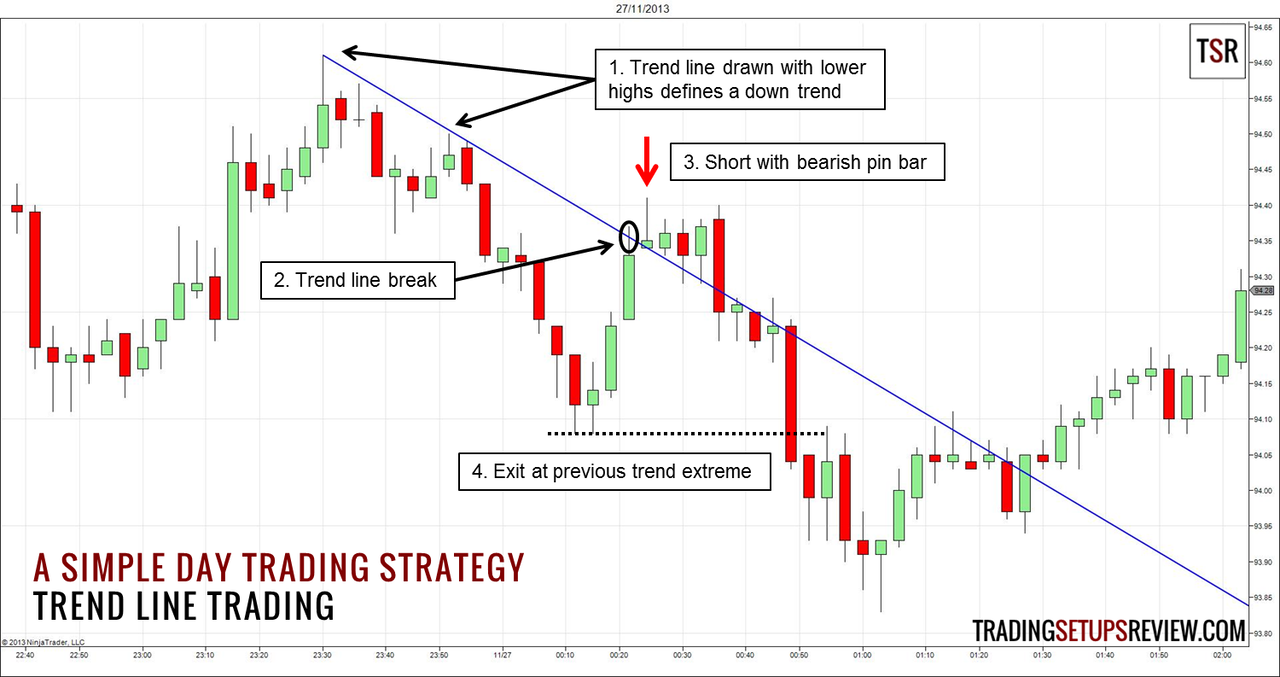
The chart below from Template For A Simple Day Trading Strategy shows an example of confluence working in our favor.
A bearish Pin Bar formed as price met the resistance of the bear trend line. An excellent short setup.
Multiple Time Frames
Using multiple time frames is an organized method to focus your analysis.
Don’t be intimidated. “Multiple” usually means just two or three time frames.
For instance,
- A higher time frame to analyze the market context
- A trading time frame to identify setups
- A lower time frame to time the entry and limit risk
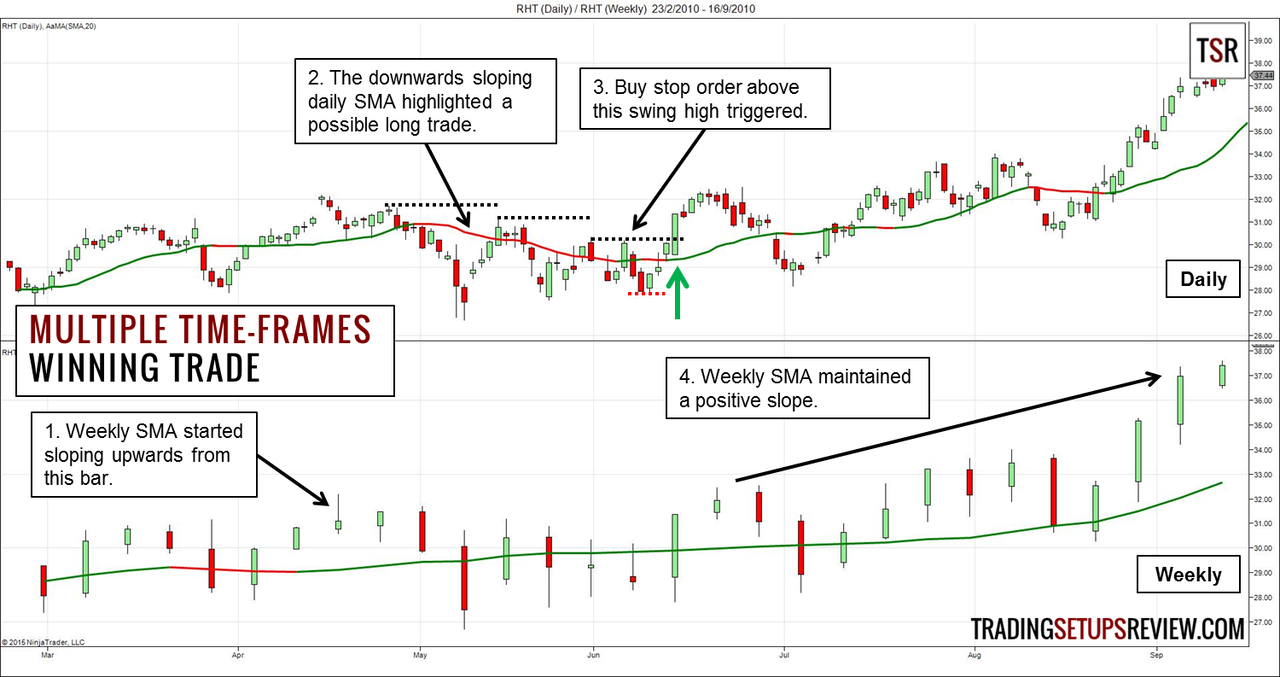
When using only two time frames, the trading time frame is used to determine setups, time entries, and limit risk.
The example below used the weekly chart to determine a bullish trend. Then, a break of the resistance on the daily time frame triggered the long trade.
Multiple time frames offer a glimpse into the fractal nature of financial markets.
Multiple time frames are valuable. But they are optional.
Simply pay close attention to the different degrees of swing pivots and trend lines within a single time frame. After enough practice, you’ll be able to visualize what’s happening on the higher and lower time frames, without looking at extra charts.
You should be comfortable analyzing price action within a single time frame first. Only then, you can reap the benefits of using multiple charts without confusing yourself.

Complementary Trading Tools
Many trading tools complement price action analysis. When used correctly, these tools can be valuable to price action traders.
In this section, you will learn about three tools favored by price action traders of all stripes:
- Moving Average
- Volume
- Price-Only Chart Types
Moving Average with Price Action
A moving average is an excellent complementary tool for price action traders.
It is a simple line plotted alongside price action. Hence, it offers depth to your analysis without obscuring price action.
A short-term moving average can highlight price swings.
The chart below uses a 3-period simple moving average (SMA) of the median price to track price swings. Median price refers to the mid-price of the bar range.
![]()
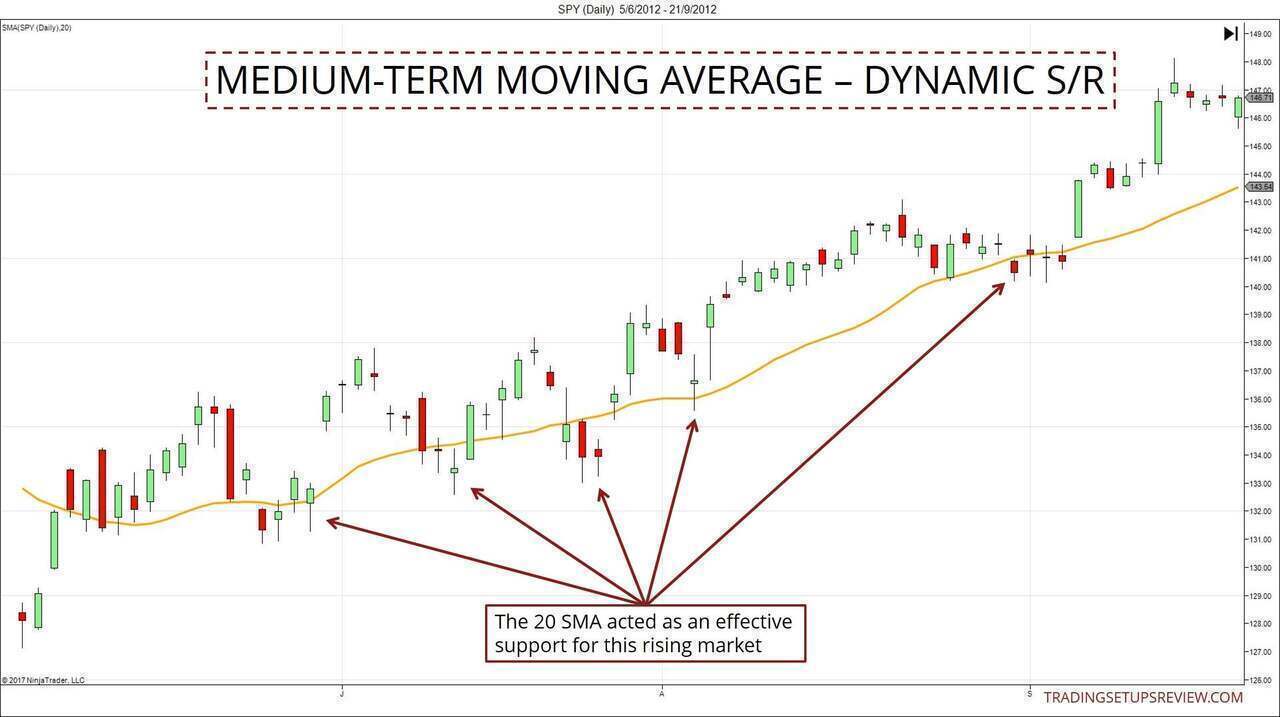
A medium-term moving average acts as dynamic support and resistance.
For active traders, this setup works well for timing trade entries.
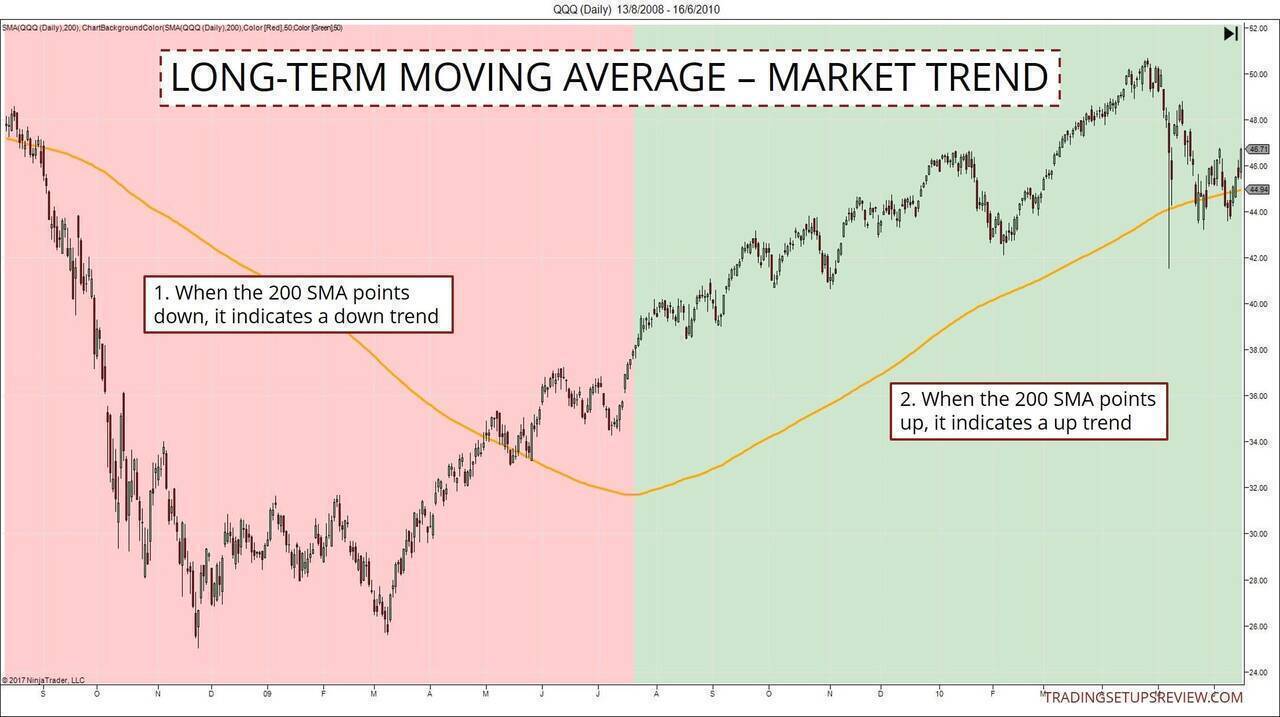
A long-term moving average shows the market trend.
Use moving averages as a tool, not a crutch.
As the examples above show, moving averages add value to price analysis. However, always remember that you are not trading the moving averages. You are trading price action.
Volume With Price Action
Volume works well with price action. Seasoned price action traders can trade with just price action and volume.
One of the most reliable and easy-to-spot volume signals is climatic volume. Climatic volume points to significant support and resistance levels and might precede a trend reversal.
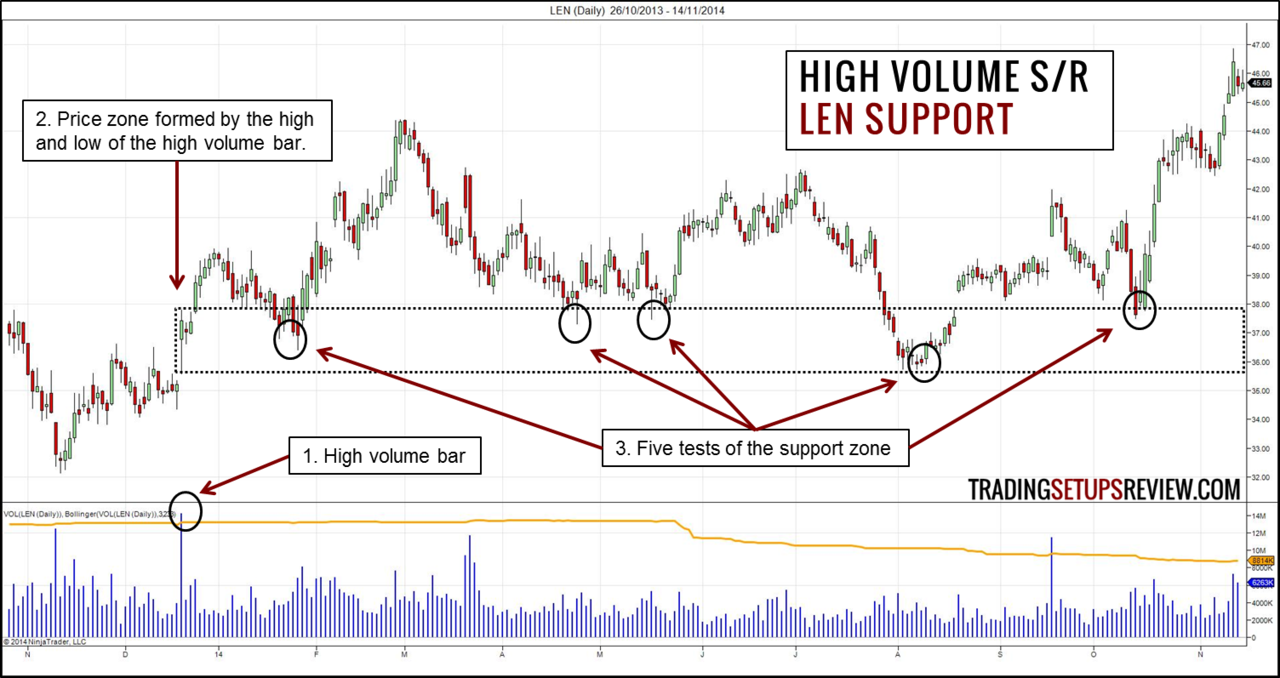
The chart above shows how a high volume bar set the stage for a major support zone.
Intrigued?
The best way to study the relationship between price and volume is through Volume Spread Analysis (VSA).
Price-Only Chart Types
Typical price charts plot price against time.
Such charts continue to plot new price bars even when the price is unchanged. This behavior leads to the unpredictable sideways price action that traders dread.
Price-only charts remove the time element from the chart. In other words, these charts represent real market movement.
Many traders do well with conventional charts. But most price action traders will be intrigued by the option of a price-only chart.
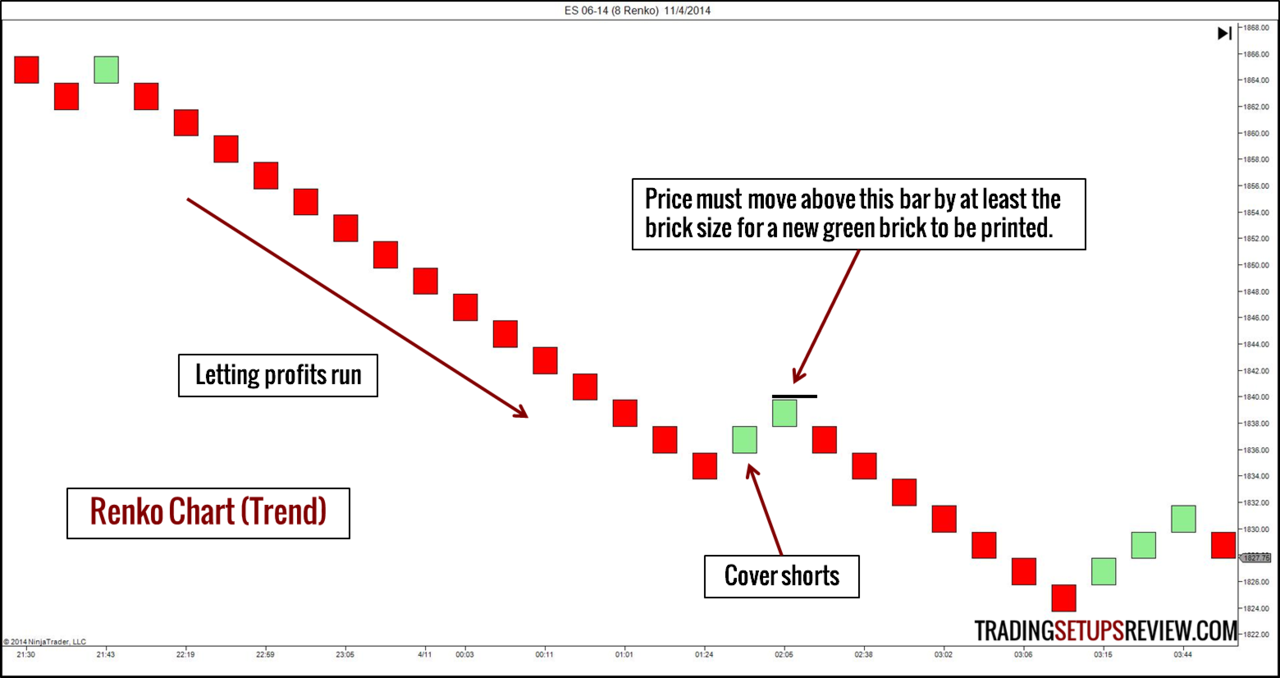
The example below shows a type of price-only chart, Renko, which means brick.
A Renko chart forms a new brick only when the market moves beyond the previous brick by a preset price range. When the market stagnates, the Renko chart stays still.
Common Price-Only Charts:
- Range Bar
- Renko
- Point & Figure
- Heiken Ashi (This is a modified candlestick chart.)
Be careful. Due to their unique construction, these exotic chart types may defy the usual price action analysis. Observe them with an open mind and tread carefully.
Building Your Price Action Trading Plan
We’ve covered an array of price action trading concepts. It’s time to create your own price action trading framework.

Minimally, you should plan for the following:
- Entry Strategy
- Trade Execution
- Stop Losses
- Profit Targets
I’m not going to lie. It takes hard work to put together a functional trading plan. But the concepts you’ve learned so far and the resources in this section will be of great help.
The following sections contain examples, advice, and resources to assist you with each aspect of your trading plan.
Entry Strategy
The most efficient way to learn is by examples.
I’ve selected three of my favorite simple price action strategies to get you started.
Trade Execution
The moment you enter the market is critical. But how exactly should you enter into a position?
You have a choice between entering at the market, with a stop order, or with a limit order.
Make sure you understand the implications of your selected order type - How To Enter The Market As A Price Action Trader.
Stop Losses
You must always limit your risk. A stop loss order is one of the best ways to do so.
Learn how to set proper stop losses with these guides:
Profit Target
A stop loss will ensure that you get out when you’re wrong. But do you have a plan for getting out when the market goes your way?
Having a profit target will ensure consistent performance and remove emotions from your exit plan.
Click here to learn ten ways to take profits.
Advancing Your Price Action Education
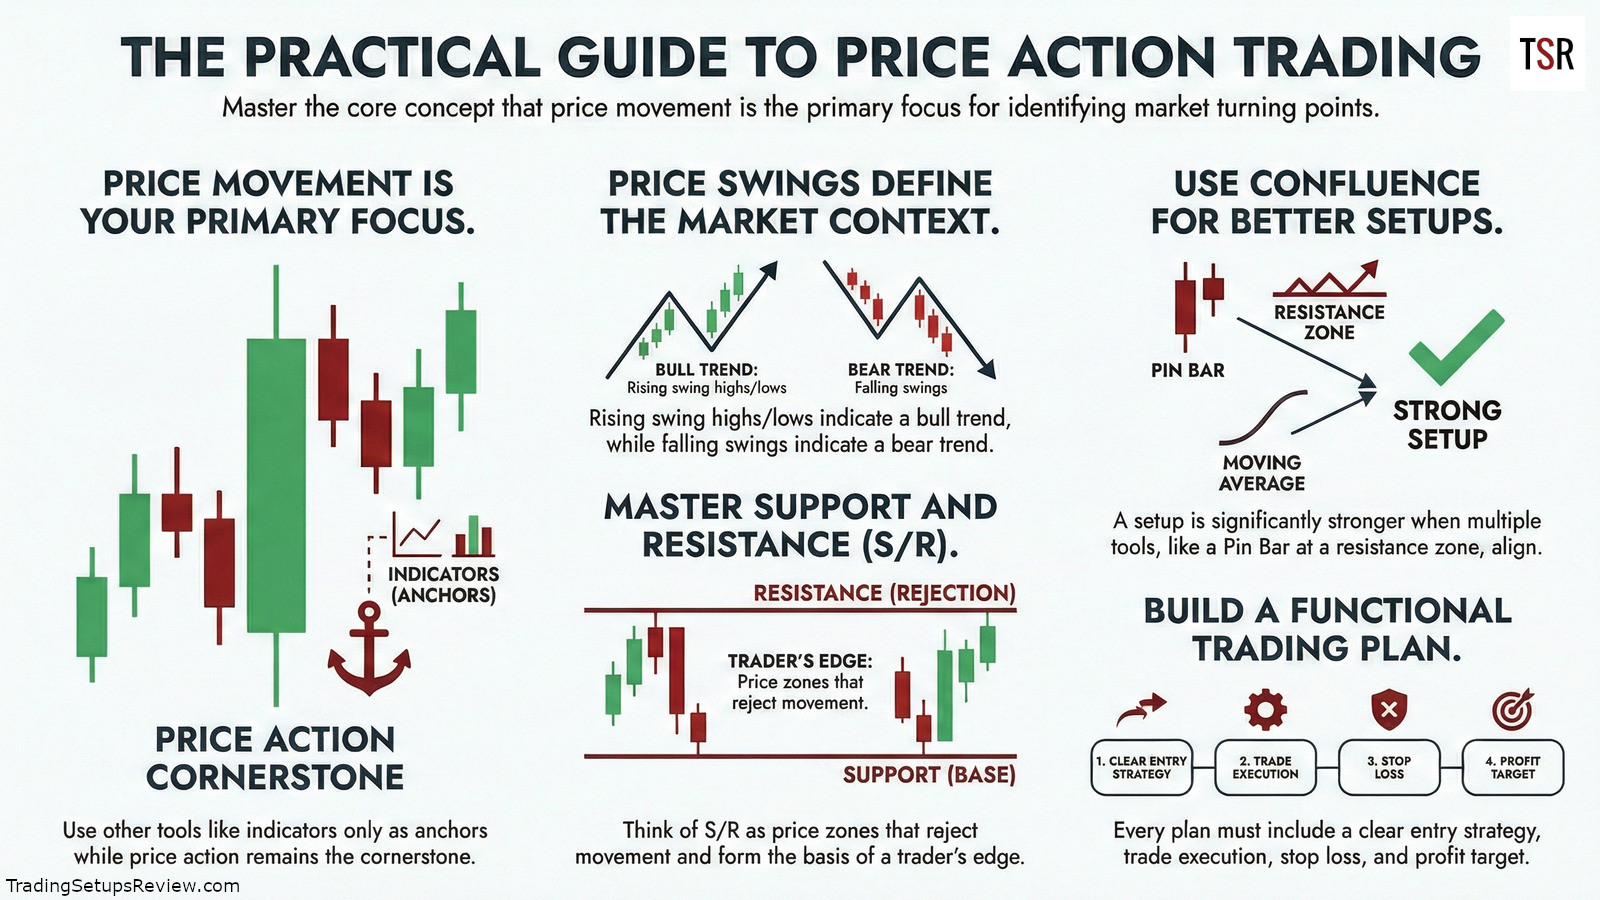
This graphic sums up the pertinent points of our discussion. Review it and once you’re ready, go on to review the additional tools and resources below.
Simulation Trading and Analysis
You want to be able to interpret price action as the market moves. To become a proficient price action trader, you need to simulate real-time analysis.
To do this, you need a reliable charting platform. Check out:
- NinjaTrader - a popular multi-market platform free for simulation trading
- MetaTrader 4 - a free and well-supported platform popular among forex traders
- TradingView - one of the best online charting platform that works with just your browser
Read this before you start your trading simulation.
Resources For Further Price Action Studies
Want to go further in your price action education?
Take a look at:
- Day Trading With Price Action Course - The swings and trend lines in this guide are drawn according to the method taught in this course.
- Price Action Article Directory
- Top 10 Price Action Trading Books