Trading Consecutive Up/Down Days With Lower Risk
By Galen Woods ‐ 4 min read
Trading consecutive up/down days means going against the most recent momentum. Learn how to trade them safely as you keep the market on your side.
When a market closes up for consecutive days, traders get excited. They start speculating that the market cannot continue its upwards streak. Somehow, we are wired to think that what goes up must come down, and vice versa. (See: Gambler’s Fallacy)
This is why consecutive up/down days form the basis of many stock scans and market strategy research. Traders want to find out if there is an edge in buying after consecutive down days or selling after consecutive up days.
- Buying after consecutive up/down days and selling after a week.
- Testing four days down and up.
- Building a heatmap of QQQ returns after consecutive up/down days.
In these studies, they approached the trading idea as quantitative system traders. The results seem encouraging, but they are not conclusive of an actual trading edge. This is especially true for discretionary price action traders.
In this article, we will explore a price action trading strategy based on the same idea of consecutive up/down days. But we will focus on the market context of such consecutive up/down days.
Trading Rules - Consecutive Up/Down Days Low Risk Entry
Fading consecutive up/down days often means going against the market trend and momentum. It is a dangerous strategy, but it does not have to be.
In our low-risk variant, we focus on fading consecutive up/down days that go against the market structure of swings.
Long Entry After Consecutive Down Days
- Four or more consecutive days down (close below open).
- If the market has not breached the last swing low, buy a tick above the next bullish bar.
Short Entry After Consecutive Up Days
- Four or more consecutive days up (close above open).
- If the market has not breached the last swing high, buy a tick above the next bullish bar.
Consecutive Up/Down Days Trading Examples
Winning Trade - Long Entry ROST Daily
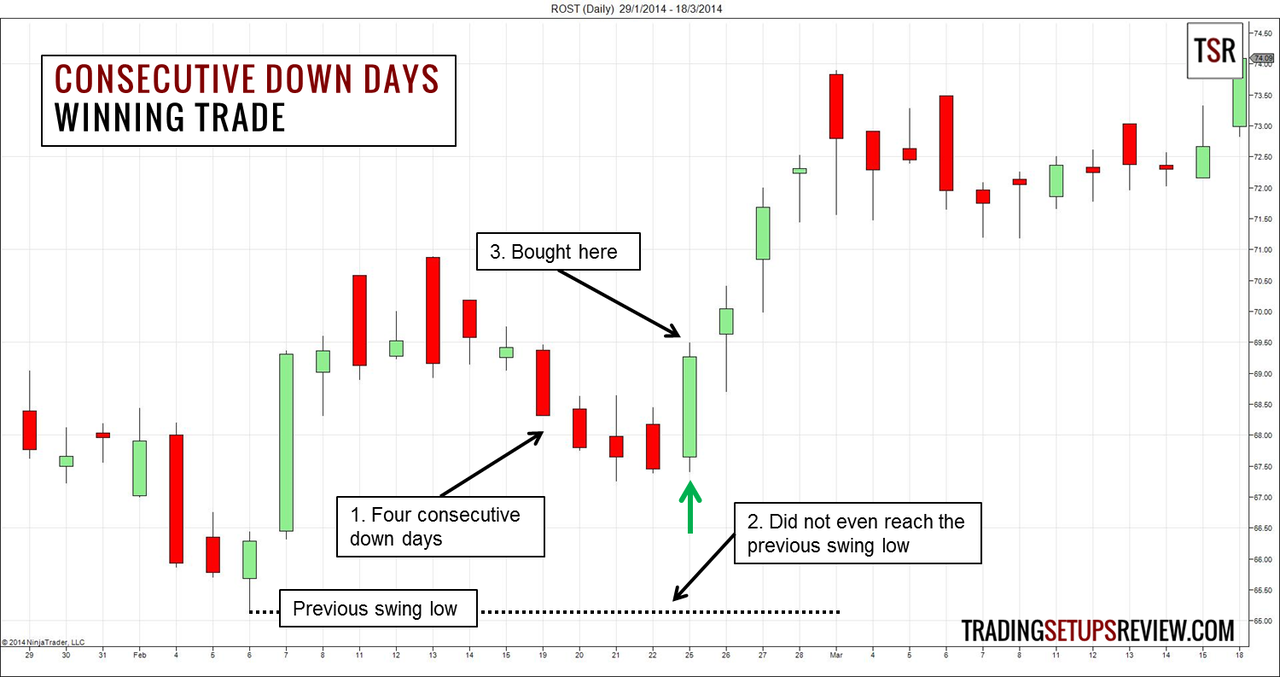
This is a daily chart of Ross Stores Inc. It shows an underachieving four-bar down thrust.
- These four consecutive down days caught our attention. Is it a last-ditch attempt by the bears? Or is it the beginning of a powerful down trend?
- The four-bar thrust did not even reach the previous swing low, hinting that the market was in the first scenario.
- This bullish bar was our setup bar. We bought a tick above it.
The market continued to rise, opening with up gaps for the next four days.
Losing Trade - Short Entry SPY Daily
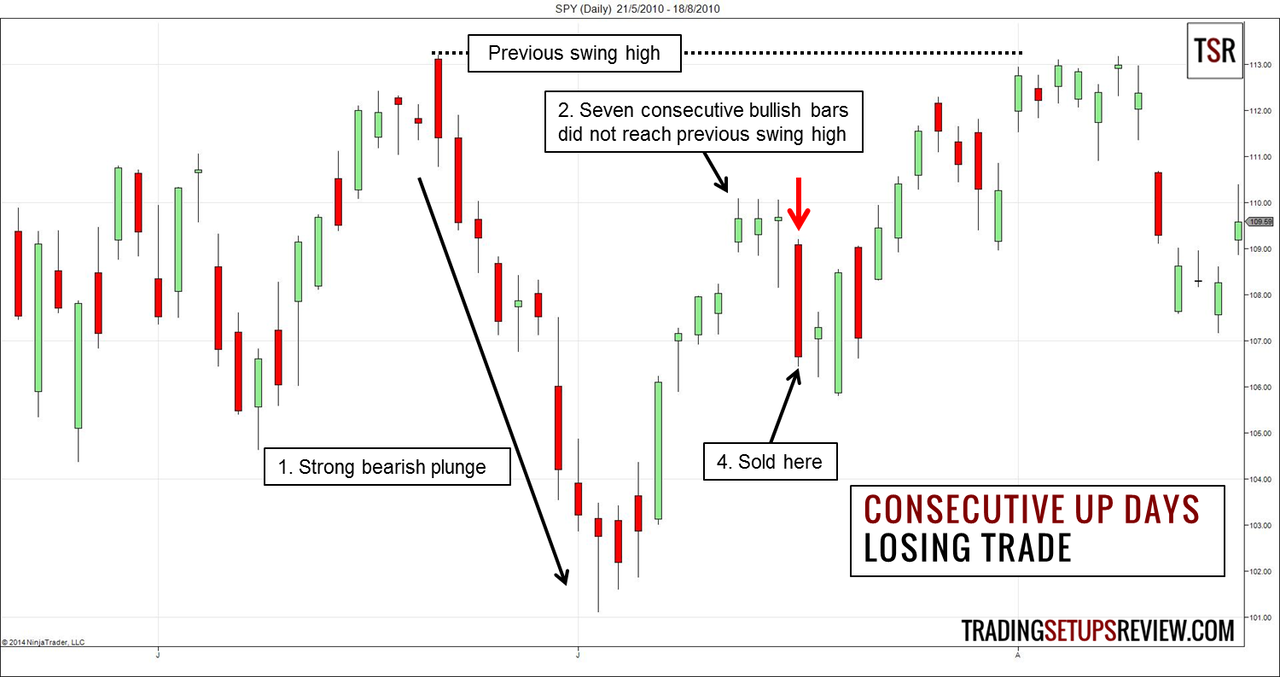
The chart above shows the daily bars of SPY, the S&P ETF. The price action in this chart is less straightforward.
- There was a strong bearish plunge that was hard to ignore. It breached the last swing low so it was not a candidate setup under this trading strategy.
- But after the bearish plunge, the market rose with seven consecutive bullish bars that did not hit the last swing high. That was in line with our trading rules.
- We sold a tick below this bearish bar and was stopped out as the market continued to rise.
After the strong bearish plunge, the market rose sharply, forming a V-shaped reversal. Interpreting such V-shaped patterns is tricky. It shows strength in both directions and it is difficult to judge which side will emerge victorious.
Review - Consecutive Up/Down Days Low Risk Entry
In most markets, there are many instances of consecutive up/down days. Most back-testing research trades them indiscriminately. Thus, they are going against the trend most of the time.
Using the market structure to filter consecutive up/down days is a simple method to make sure that we take only the low risk setups. This is akin to the improved three bar pullback trading strategy.
There will be fewer trading setups. However, it is a worthwhile sacrifice for better trading quality.
Other than the market context, you can also pay attention to the price thrust formed by the consecutive bars.
Are the consecutive bars making higher bar highs? Or lower bar lows? Do they exceed the previous bar by an increasing distance or a decreasing distance?
In my price action trading courses, I discussed two price patterns derived from answering these questions. They are the Deceleration and Anti-climax patterns. They are useful patterns to look out for when you see consecutive up/down bars.
- The Deceleration pattern consists of consecutive up/down bars that weakens as they progress. The winning example above is also a bullish Deceleration setup.
- The Anti-climax pattern consists of consecutive up/down bars that are exhaustive. The losing example was in fact an Anti-climax pattern that was invalidated before the setup bar appeared.
To learn more about these price patterns, take a look at “Day Trading with Price Action”. Although the focus is on day trading, you can adapt the price patterns for all time-frames easily.