Double Inside Bar Pattern For Intraday Trading
By Galen Woods ‐ 8 min read
The Double Inside Bar pattern pinpoints low-risk trades with high reward under the correct context. Master this pattern for price action trading.
Are you familiar with the inside bar? If so, it’s easy to add another pattern to your arsenal by paying attention to the Double Inside Bar pattern. This price pattern is useful in the right context, but trading it can be tricky. This review will go through a few guidelines and examples to help you use it for intraday trading.
An inside bar indicates a contraction. Double inside bars do so with greater intensity.
Not sure what’s an inside bar? Click here.
The formation of the inside bar tells us two things:
- The market is trading at around the same price as the previous bar.
- The market is trading through a smaller range compared to the previous bar.
This stagnant price action scenario poises the market for a breakout. And the prospect of this breakout is attractive to traders who are agile enough to take advantage.
This setup spots the transition from muted action to powerful thrusts. Hence, with careful analysis, you can pinpoint setups with a fantastic reward-to-risk ratio.
This is how a Double Inside Bar pattern looks like.
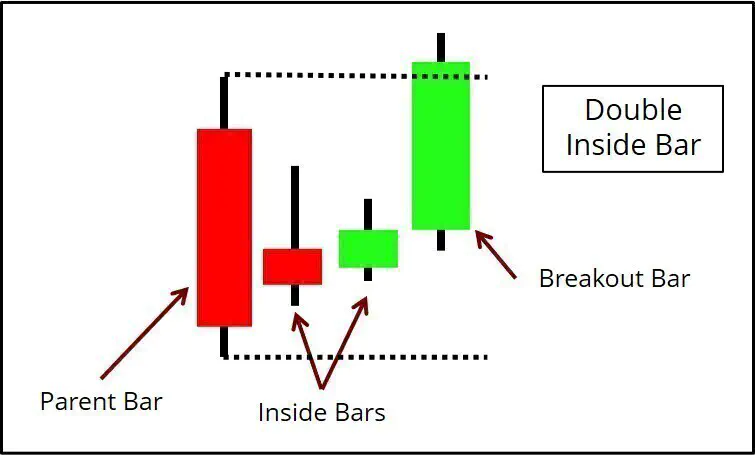
- For ease of reference, we will refer to this bar as the parent bar. It is the bar that precedes the two inside bars.
- Many traders define a breakout with the high and low of the parent bar. However, you can tweak this threshold, as we will discuss in the first example below.
To understand this pattern from another perspective, recall the triangle chart formation. A triangle pattern is conceptually similar to a Double Inside Bar. For instance, a triangle pattern can show up as a Double Inside Bar on a higher timeframe.
Double Inside Bar Trading Guidelines
These are general guidelines for trading the Double Inside Bar pattern effectively.
- Avoid double inside bars that form within a congested area.
- Focus on the closing price to judge breakouts.
- Respect the trend.
- Failures are more reliable, but you might need to sacrifice the number of trades.
Don’t worry if you don’t get these concepts entirely now. We will reiterate these guidelines in the chart examples below.
Double Inside Bar Trading Examples
The examples below come from the 3-minute chart of the FDAX futures over the past 30 days.
They show a variety of situations involving the Double Inside Bar pattern, including:
- Standard Breakout Trade
- Breakout Failure Trade
- Prolonged Congestion
- Multiple Patterns
- Bias Reversal
Example #1: Standard Breakout Trade
This example illustrates the different entry options available for this pattern.
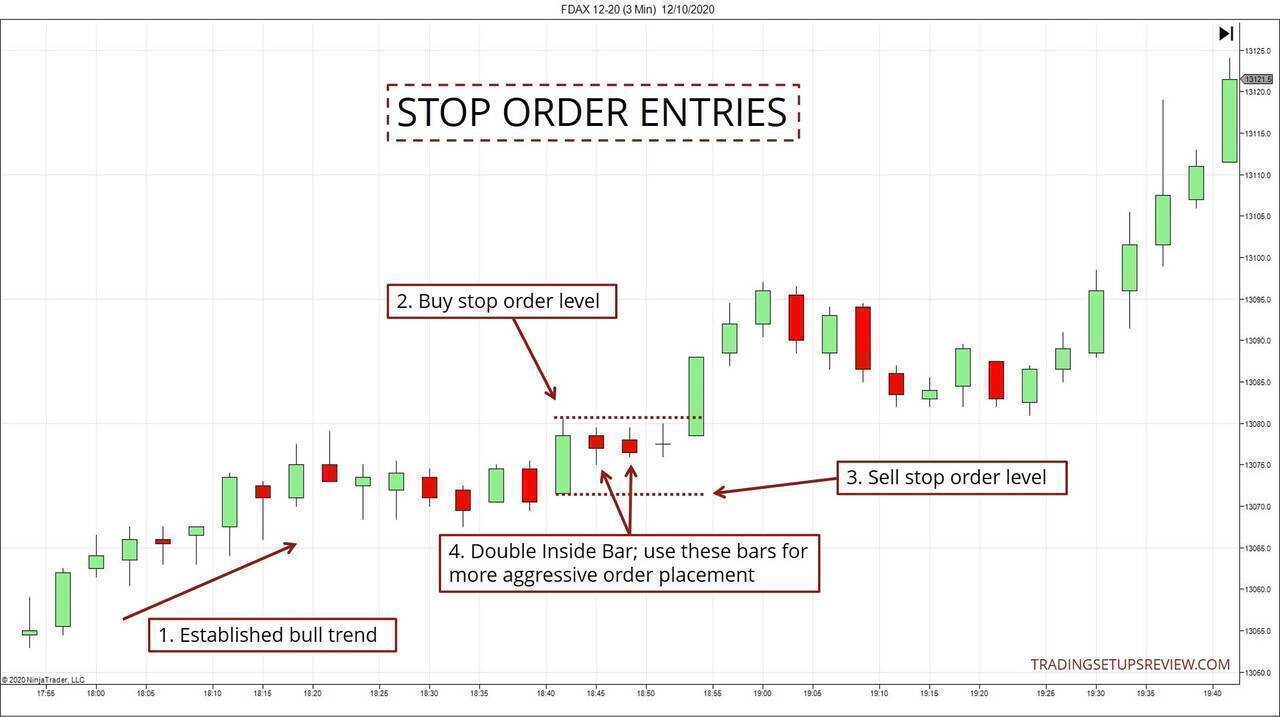
- The market context was bullish.
- A common approach to trading the Double Inside Bar breakout uses stop orders. Precisely, place stop orders around the parent bar. The high of the parent candlestick is the buy stop order level.
- Correspondingly, the low of the parent bar is the sell stop order level. Once one of the orders is filled, the other is canceled.
- You may use any of the inside bars to set the stop orders for more aggressive entries.
As you can see, traders define a breakout differently based on how aggressive they are.
I use one of the two criteria below:
- Any breach of the parent bar high/low; or
- A close above/below the previous bar.
In this example, the breakout bar fulfilled both criteria.
Example #2: Counter-trend Breakout Failure
This example shows a great short setup that involved two instances of the pattern.
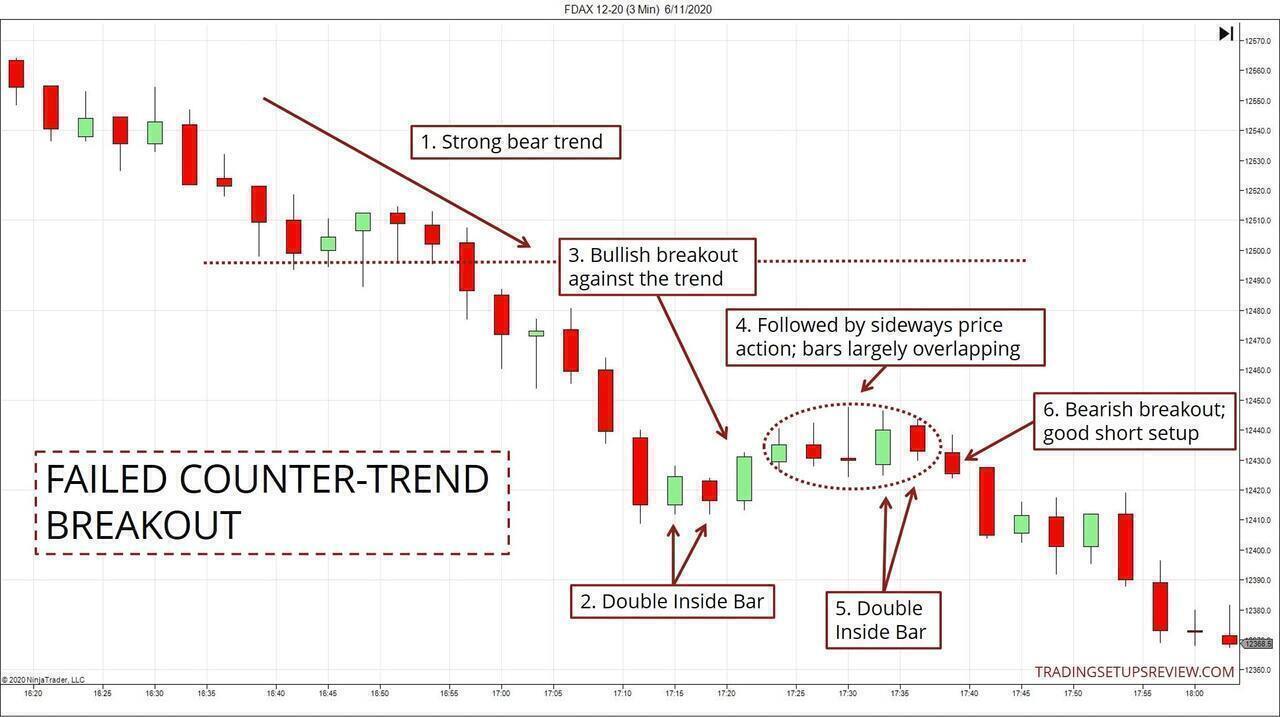
- There was a strong bear trend.
- As the market pushed to a new low, it hesitated and formed a Double Inside Bar pattern.
- However, the breakout went against the established bear trend. It was not advisable to take a counter-trend setup without other supporting factors.
- A meaningful price action observation came after the bullish breakout bar. The five bars that followed overlapped substantially with one another. A sideways block was apparent.
- On top of that, another Double Inside Bar pattern formed.
- The breakout of the second Double Inside Bar pattern was also the first instance’s failure. Furthermore, this breakout was aligned with the dominant market trend. Hence, it offered an excellent shorting opportunity.
Example #3: Stepping Aside
This example shows a remarkable instance of the pattern: Triple Inside Bar.
A Double Inside Bar pattern is tricky because it can be a sign of prolonged congestion. A Triple Inside Bar pattern is an even more vital sign of a meandering market.
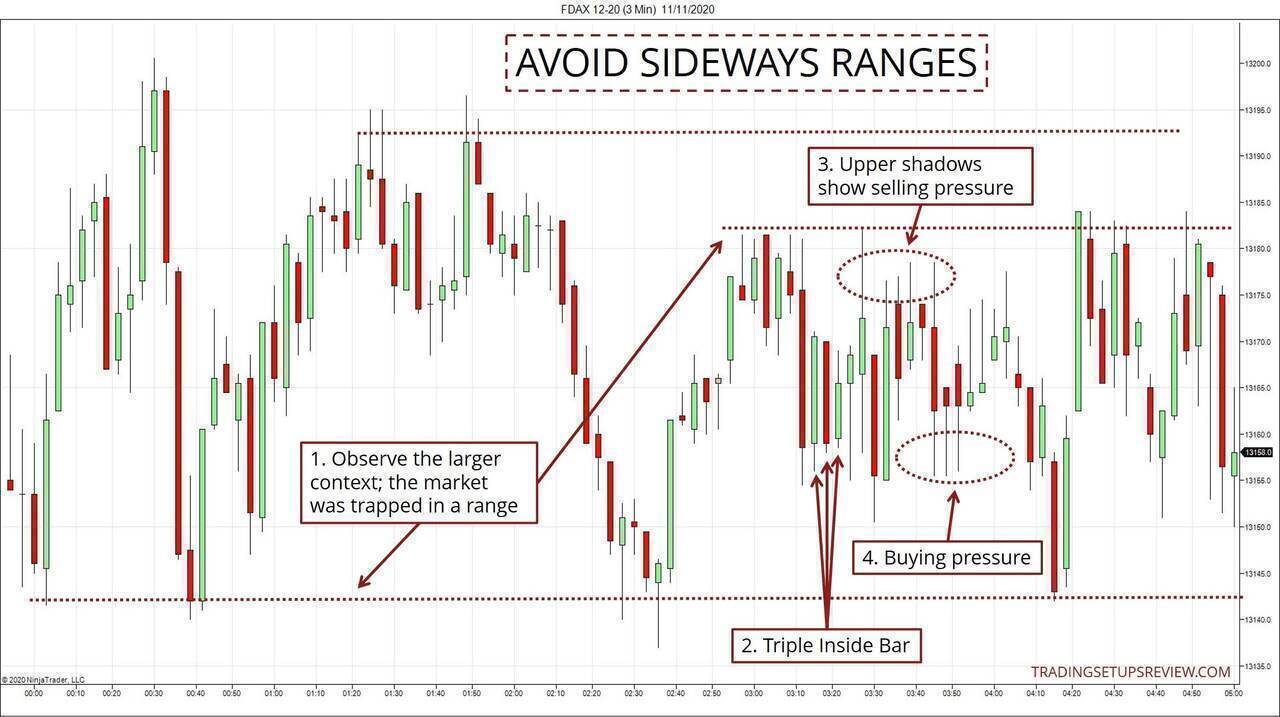
- If you’ve been tracking the significant support and resistance levels, it’s easy to recognize that the market was trapped in a range.
- Within this meandering context, a Triple Inside Bar pattern formed. Given the market range, it was unlikely that its breakout would lead to a strong thrust that we could ride on.
- Indeed, the bullish breakout bar ended with a long upper shadow, implying bearish pressure.
- We considered the potential of a breakout failure trade. But the overlapping lower shadows implied bullish pressure, hinting that the bears were not forthcoming too.
The pressure from both directions within a tight trading range does not bode well for a breakout trade.
Thus, unless you are looking to scalp within the range, it’s a good idea to avoid a ranging market like the one in this example.
Example #4: Two Patterns; Same Outcome
This chart shows a Triple Inside Bar followed by a Double Inside Bar.
In this example, you’ll see how examining their relationship aided our analysis.
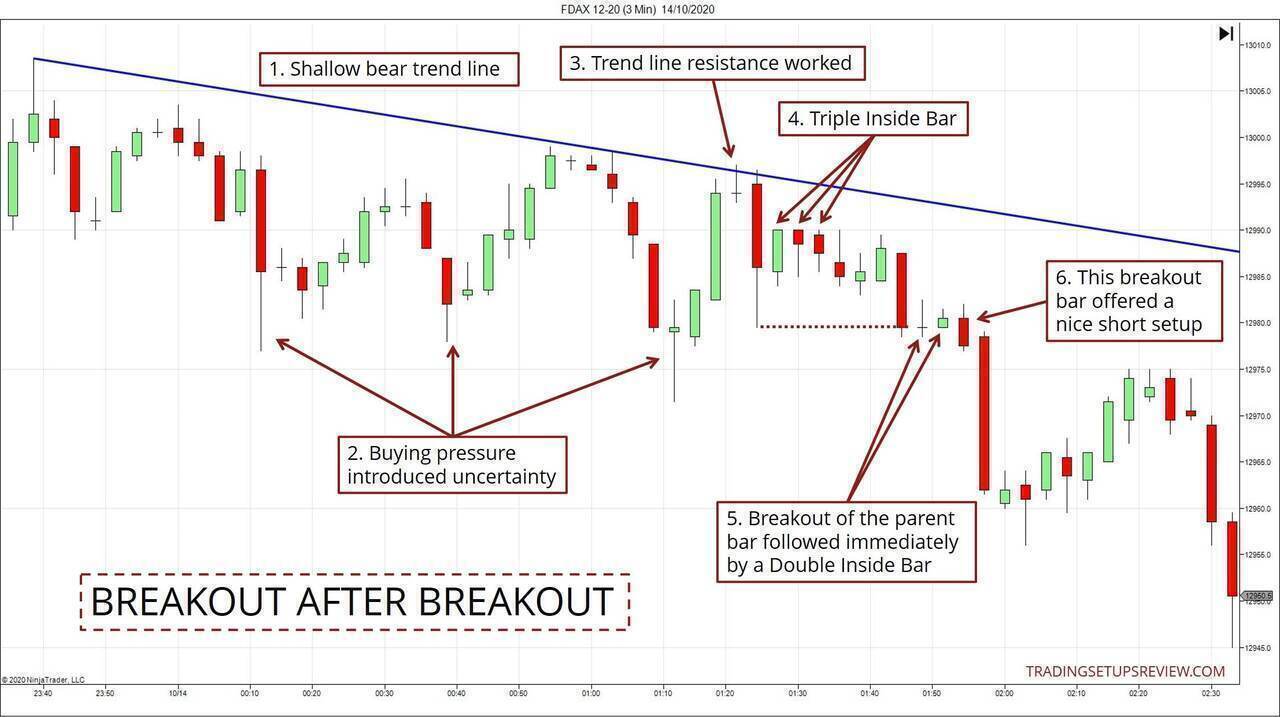
- This shallow bear trend line was the starting point for our analysis.
- The buying pressure (lower shadows) as the market pushed lower was evident. Together with the shallow trend line, they cast doubt on the bearish bias.
- Nonetheless, the trend line managed to resist the market at this point. Hence, we maintained a bearish outlook.
- A Triple Inside Bar pattern formed. (I use a liberal definition of an inside bar. Matched bar highs or lows do not stop me from recognizing an inside bar.) Given the uncertainty explained earlier, we might want to hold back on a short trade.
- As the market tested the low of the parent bar, a Double Inside Bar pattern formed.
- The bearish breakout of the pattern confirmed the market bias. It offered a much more reliable short setup than the earlier Triple formation.
Example #5: Setting The Context With Trend Channels
This example shows the value of trend channels in helping us to arrive at a suitable trading approach.
Without the channels’ help, the bias seemed unclear, and we had to abstain from trading the pattern. But with the price channels, we were able to illuminate the market structure. As a result, we could form a reasonable trading approach.
If you are new to trend channels, check out this article.
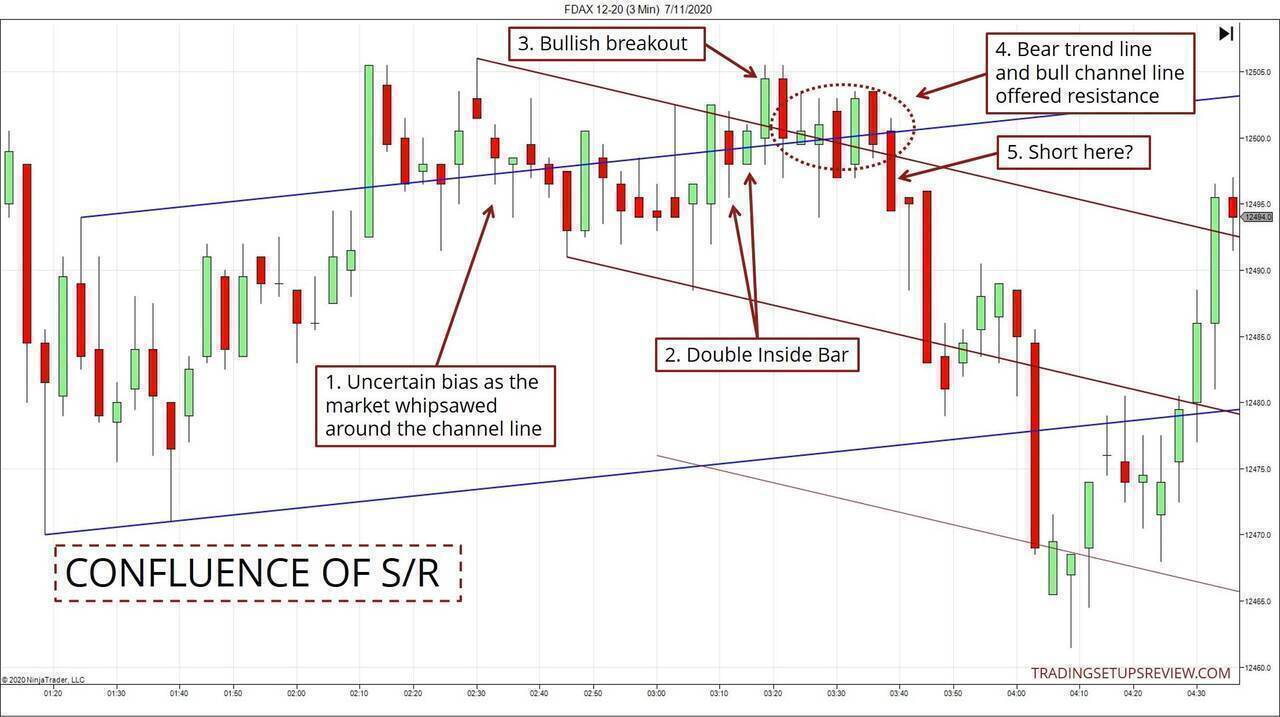
- Although a bull channel (in blue) was present, the market tangled with the channel line. There were multiple whipsaws around the channel line, and the bullish bias was in doubt.
- Within this meandering along the channel line, a Double Inside Bar pattern formed.
- Would this bullish breakout resume the trend? Our confidence in a bullish trend resumption at this point was low.
- This is because of the confluence of two resistances: the channel line and a more recent bear trend line in maroon. (Note to course students: Valid pivots were used to draw both channels.)
- Bearish traders could short with this bearish candlestick (or any of the previous bearish bars).
After the bears took over, the bear channel would be adjusted, as shown in the chart below. The adjusted channel proved helpful for either a secondary entry or for profit-taking.
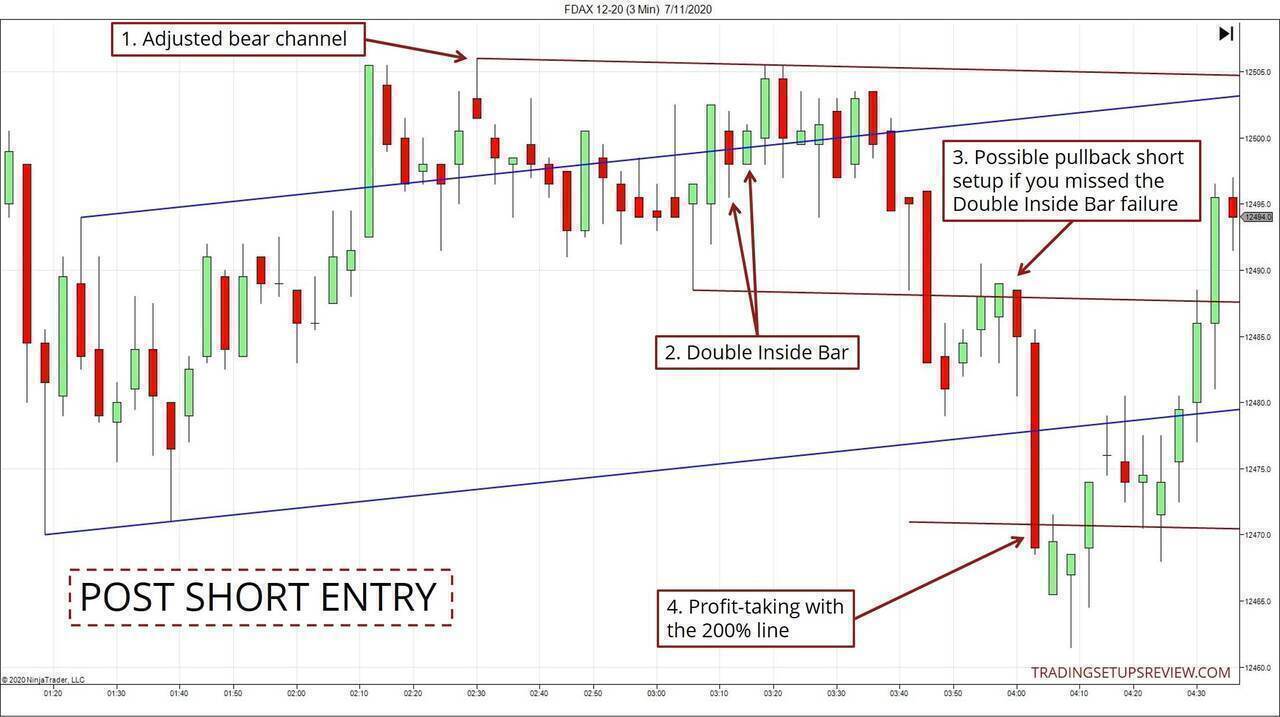
- After the market pushed lower, we adjusted the bear channel (in maroon) to contain all the price action. This resulted in a shallower channel.
- For ease of comparison with the first chart, we are pointing out the same Double Inside Bar pattern.
- The new channel line offered resistance and a chance to enter a short trade on a pullback.
- Its 200% line was also a concrete level to take profits for bearish traders.
If you want to learn more about using price channels for intraday trading, visit this guide.
Conclusion - Double Inside Bar Intraday Trading
As you saw in the examples above, sticking to a rigid method to trade the pattern is not adequate. It would be best if you considered the more extensive market context.
A Double Inside Bar pattern can form in the middle of a trading range or as part of a trend pullback. The approach to trading them differs accordingly.
Consecutive inside bars are not typical, especially when the market is not in congestion. Hence, it makes sense to observe how the market reacts to them.
Spend more time observing their formation and the market’s reaction to them. Soon, you’ll find out how to get into low-risk trades with them. When in doubt, wait for more price action to unfold. If the market speeds away from you, accept that as a cost of demanding clarity.
In this tutorial, we kept our focus on intraday trading charts. However, you can find this pattern on the daily charts as well. Hence, it is also valuable for swing traders looking to expand their price action trading toolbox. The same trading guidelines apply.
(Note for course students: For the breakout failure setups, perform your analysis using the Anxiety Zone method covered in Volume 3 of the course. It will help you to decide when exactly to enter for a failure setup.)
For more trading strategies that utilize the inside bar, check out: