The Power Of Multiple Trading Signals In Confluence Zones
By Galen Woods ‐ 4 min read
Put varied trading signals together to find the best confluence trading zones. The concept of confluence empowers you with an effective trading approach.
Confluence is the act of coming together. Traders use it as a fancy word that refers to having multiple reasons for taking a trade. The more reasons you have to take a trade, the better. And bonus points if the reasons are unrelated.
There are many possible reasons for taking a trade. These are some of my favorite.
- Trendline support or resistance
- Congestion support or resistance
- Flipped support or resistance
- Volume signals
- Price-indicator divergence
- Bar patterns & candlestick patterns
- Chart patterns
If you prefer mixing indicators, familiarize yourself with the concept of multicollinearity.
Confluence Trading Zone Examples
To highlight confluence in the examples, each reason supporting the setup is in bold.
The examples refer to several patterns taught in my price action trading course. Don’t fret over them. Just take note of their bullish or bearish nature, and you can follow the examples easily.
Trading Example #1 - HPQ Daily
This example shows a confluence of five reasons to go long at around the support zone.
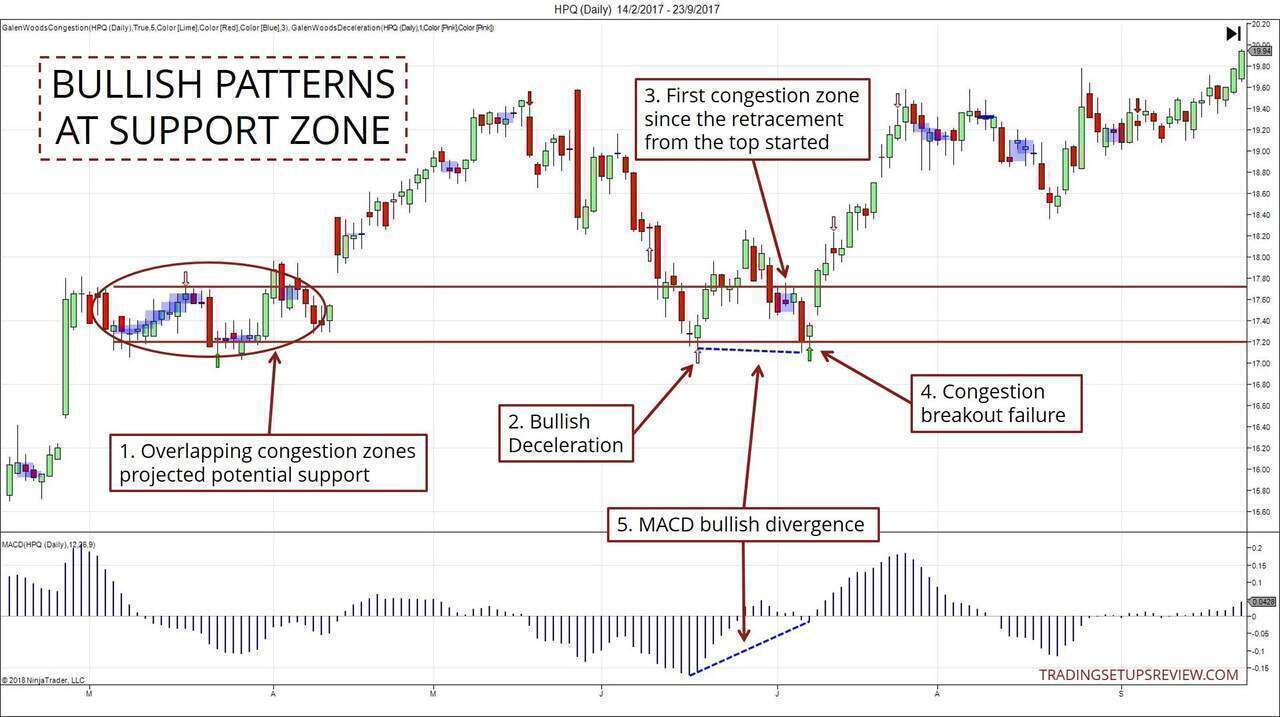
- The blue zones mark out congestions. These overlapping congestion zones projected a potential support level.
- As the market first fell to test the support, it formed a bullish Deceleration pattern. (As taught in my course.)
- Later on, the market created the first congestion zone since the retracement began. Such stalling action affirmed that the support was holding up.
- This breakout failure from the congestion pattern also formed a double bottom pattern.
- Look at the MACD panel below now. You’ll see a bullish divergence confirming the double bottom formation.
Example #2 - CL Futures 3-Minute
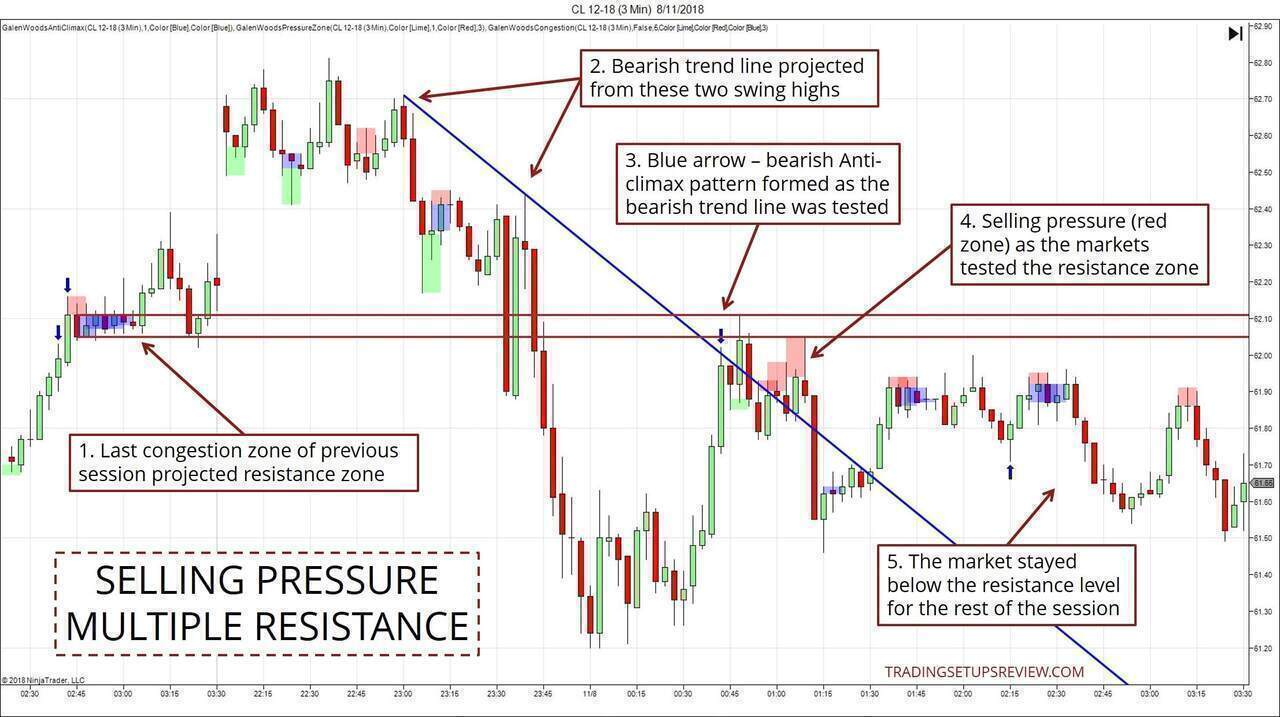
- The last congestion zone of the previous session is helpful. You can use it to project initial support or resistance. In this case, it was first projected as a potential support zone. But it flipped into a resistance level later in the session.
- Based on these two points, a bearish trend line was drawn.
- The small blue arrow marked out a bearish Anti-climax pattern. It formed as the market rose to test the trend line and the projected resistance. (Learn more about the Anti-climax pattern in the free chapter.)
- The red zone marked out bearish pressure near the resistance zone. These signs added up to build a case for going short.
- Although the market fell after that, it did not gain enough momentum to resume the trend. But it did establish an effective resistance for the rest of the session. (The market did not test the resistance zone again.)
Despite the confluence of four bearish signals, the market did not resume the bear trend. Hence, this setup might not have turned out great for traders with ambitious exit plans.
No trading method is perfect, even when you add a few of them together. This is the reality of trading.
Example #3 - ES Futures 3-Minute
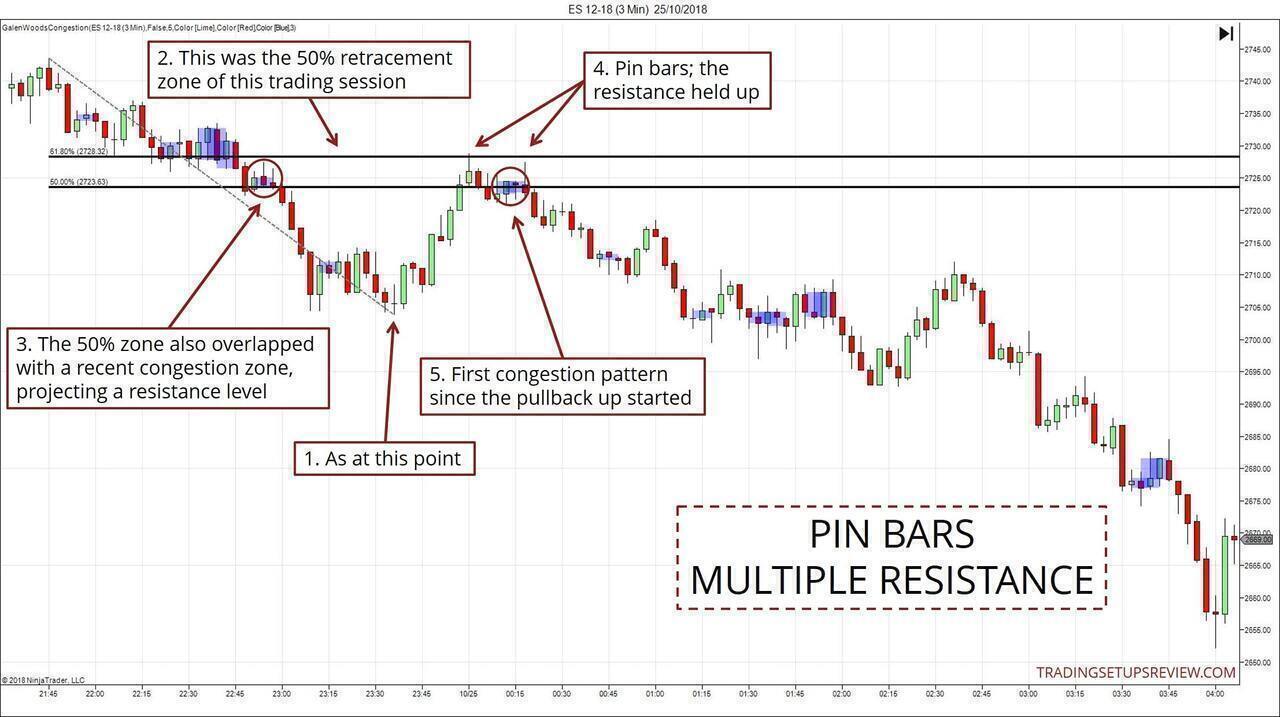
- The 50% retracement level is often used to project support and resistance. I like to use the area between the 50% and 61.8% levels as the action zone.
- When you apply this concept to a trading session, you need to adjust the zone as the day extends its range. This zone was the 50% retracement zone of the day’s range as at that point.
- The 50% zone coincided with a congestion zone formed earlier in the session.
- These two Pin Bars were signs that the 50% zone was resisting the market’s rise.
- This congestion zone was the first sign of the market stalling after the pullback up. (Similar to Point 3 in Example #1.)
The confluence of four bearish signals captured one of the best short setups of the session.
Conclusion
Confluence helps. Go wild with your experimentation. You can even factor in fundamental analysis with a couple of price action patterns.
But don’t clutter your decision-making process. Once you start to lose sight of what each pattern or tool is telling you, you should pare back.
A final reminder - You might think that with a confluence of reasons, you’re invincible; you cannot lose. That is incorrect. Confluence trading is not the Holy Grail.
But it does offer us a prudent approach to trading the market.