This website or its third-party tools use cookies which are necessary to its functioning and required to improve your experience. By clicking the consent button, you agree to allow the site to use, collect and/or store cookies.
Please click the consent button to view this website.
I accept
Deny cookies Go Back
  • Price Action Trading Course
  • Trading Setups
  • Topics ↓
    • Price Action Trading
    • Day Trading
    • Trader Development
    • Site Map
  • TSR Trading Guides
  • Trading Resources
    • Trading Journal Software
    • Our Partners
    • Support Us
  • Member Login

Trading Setups Review

Trading Strategies, Guides, and Articles for Active Technical Traders

Trading Course Banner
You are here: Home / Trading Setups / The Holy Grail Trading Setup

The Holy Grail Trading Setup

By Galen Woods in Trading Setups on June 1, 2012

The Holy Grail is, of course, not the Holy Grail. Linda Bradford Raschke and Larry Connors named it so for its simplicity. As both of them are prominent traders, this trading strategy is hugely popular.

ADX Lovers: Day Trading, Range Trading

Trading Rules For The Holy Grail

Rules For Long

  1. 14-period ADX is initially above 30 and rising
  2. Prices retrace down to 20-period simple moving average (SMA)
  3. Place buy order at the high of the bar that touches 20-period SMA

Rules For Short

  1. 14-period ADX is initially above 30 and rising
  2. Prices retrace up to 20-period SMA
  3. Place sell order at the low of the bar that touches 20-period SMA

The Holy Grail Trading Examples

Winning Trade – Bullish

Holy Grail Winning Trade
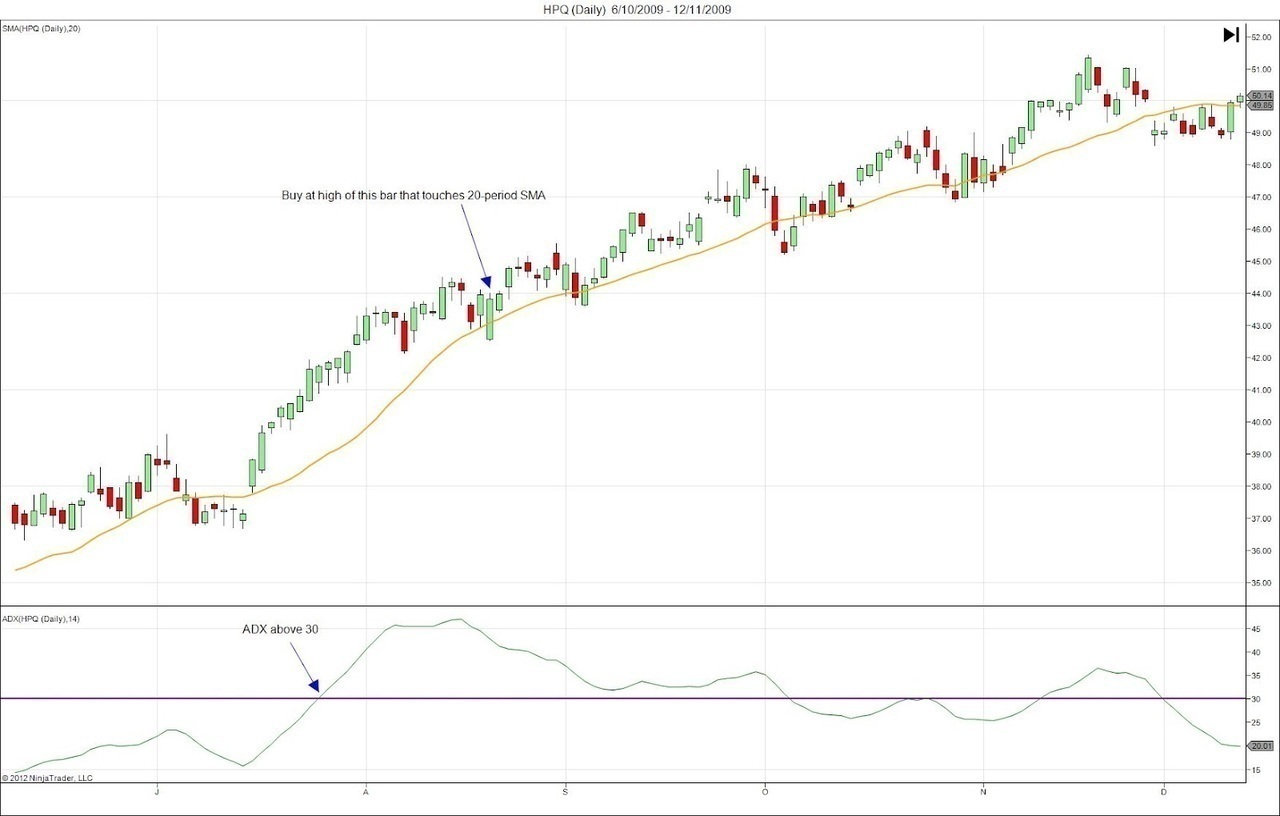
This is a daily chart of Hewlett-Packard (HPQ on NYSE). The bottom panel shows the ADX rising above 30. ADX measures trend, so this criterion finds markets that are trending strongly.

In this trending stock, we saw a pullback to the 20-period SMA. We entered at the high of the bar that touches the SMA. The trend continued beyond this chart and gave a profit potential of around $9.00 per share.

The ADX only served to confirm what prices showed. The series of 13 bullish bars was all that any trader needed to see the upward trend. The marked bar offers a great entry point as the day gapped down before rebounding up within the day. An extremely bullish sign.

Losing Trade – Bullish

Holy Grail Losing Trade
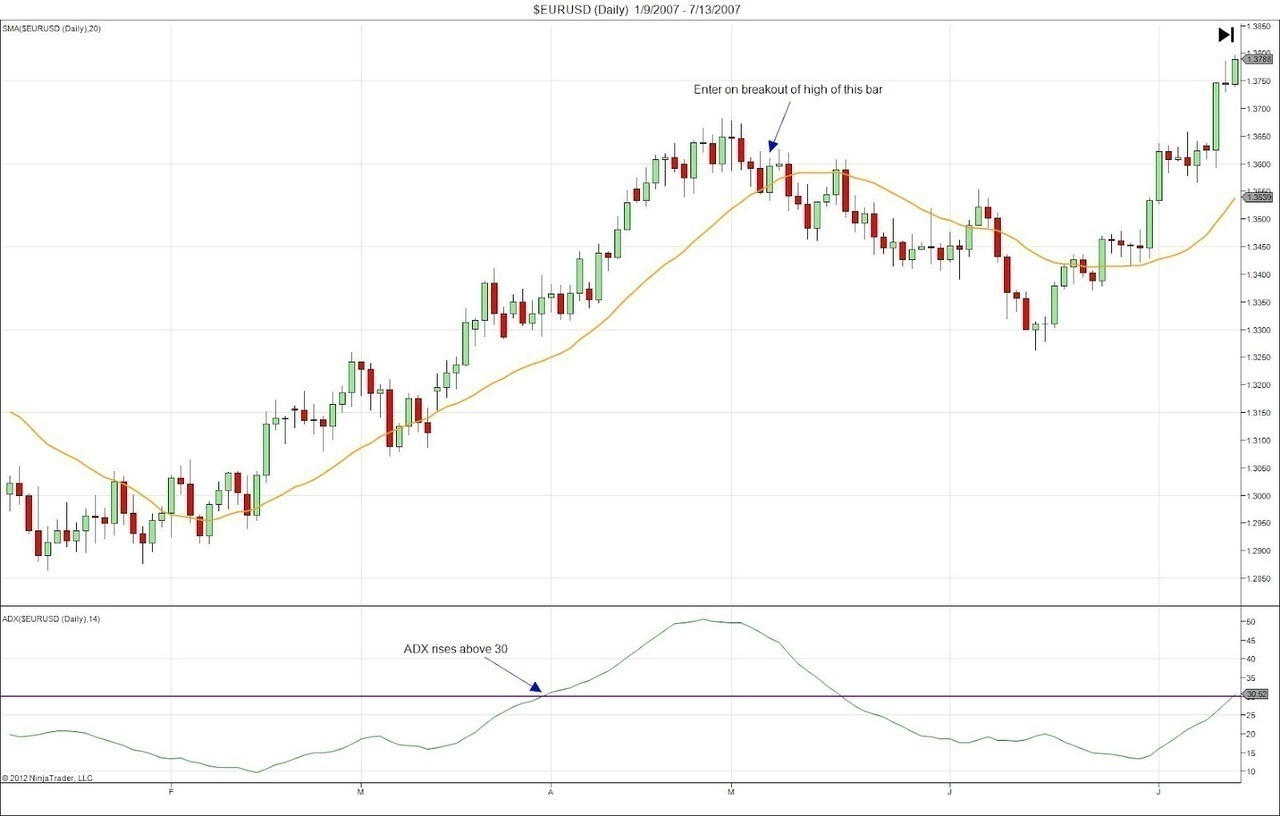
This is a daily chart of EUR/USD spot forex.

Again, the ADX rose above 30 to show a strong bullish trend. Then, prices retraced to the 20-period SMA to present a Holy Grail long setup. We entered on the high of a bullish reversal bar. However, the market hit our stop two days later.

This entry looked good with a nice bullish reversal bar as the signal bar. Moreover, it looked like a possible failed downside breakout of the trading range at the top.

However, the increasing number of dojis showed a lack of buying pressure before the pullback. Also, before the marked reversal bar, there was a bearish outside bar. After entering the trade, the entry bar became a doji which was a signal for more conservative and nimble traders to exit earlier to limit their losses.

Review – The Holy Grail Trading Setup

The Holy Grail trading strategy finds retracements within healthy trends. You don’t need the ADX to see strong trends, as they are hardly subtle. However, the ADX keeps new traders out of trouble and provides a convenient way to scan for trending stocks.

With regards to finding trends, the criterion of ADX > 30 has two drawbacks. First, a high ADX can mean that the trend is overdone and may reverse soon. Traders might enter at the worst possible timing. Second, gradual and protracted trends may unfold entirely without the ADX ever crossing above 30. This will result in missing some trades.

Street Smarts: High Probability Short-Term Trading Strategies explains how to re-enter a trade and to look for a second retracement. The book is an excellent read as the authors explain the concepts underlying each trading strategy very clearly.

If you like the ADX indicator, check out these articles for a unique way to use this powerful indicator.

  • Day Trading With ADX
  • Trend Trading With The 2-Period ADX

Read more about ADX, Moving Average, Trading Trend

If Trading Setups Review has helped you trade better, please help us stay ad-free by buying me a coffee.

Support me on Ko-fi

Thank you for being awesome.

You can also check out other ways to support us here.

Or, please continue exploring what we have to offer…

4 Tactics to Boost Your Day Trading Profits

How to Create a Price Action Day Trading Plan

6 Timeless Trading Ideas from Legendary Traders

9 Day Trading Mistakes That Will Ruin You

Harami Candlestick Reversal Trading Strategy

Comments

  1. psc says

    August 2, 2013 at 8:38 AM

    How do you scan for this ?

    Reply
    • Galen Woods says

      August 2, 2013 at 9:48 AM

      Hi, it depends on the platform you used for scanning. A basic scan will filter stocks with ADX more than 30. However, with a more advanced scanner, like the Market Analyzer in Ninjatrader, you will be able to scan for stocks with ADX more than 30, ADX rising, and a retracement bar touching the 20 EMA. That will give you a list of stocks which you can look through manually.

      Investopedia has a good guide to using the market analyzer in Ninjatrader.

      You can also refer to Ninjatrader’s help section on market analyzer.

      Let me know if you need more help.

      Reply
  2. Nil's says

    May 30, 2016 at 12:53 PM

    “RULES FOR SHORT
    14-period ADX is above 30 and rising”
    How it comes to above 30 and rising instead of below 30 and falling ?

    In the chart example, you have pointed the ADX on 30 but the trading signal far after that ! Should we have to wait for the trading signal after the 1st condition to comply ? Correct me if m wrong.

    Reply
    • Galen Woods says

      June 6, 2016 at 1:41 PM

      Thanks for your comment. The ADX is a measure of trend. Both bullish and bearish trends will cause the ADX to rise. Hence, both long and short trading rules require the ADX to be rising above 30.

      You are right. The trading rules above are sequential. You wait for the ADX to confirm a trend, then you watch the MA for a suitable entry.

      Reply
  3. CCM says

    December 5, 2016 at 11:48 PM

    In your rules at the top, you specify the use of a Simple Moving Average (SMA). However, according to Raschke’s own website, as well as other sources (including
    Kirkpatrick, Charles D., and Julie R. Dahlquist. Technical Analysis: The Complete Resource for Financial Market Technicians. 3rd ed. Upper Saddle River, NJ: FT, 2016. Print.), an Exponential Moving Average (EMA) is used in the strategy. Is this a typo or do you choose to use the SMA for some specific reason? (I understand that there wouldn’t be a large difference between the two, but I was curious if there was a reason.)

    Reply
    • Galen Woods says

      December 8, 2016 at 1:13 AM

      Thanks for pointing that out! I overlooked the difference myself. When I was testing this setup, I had a mindset of “the simpler, the better”. Since SMA was the simplest of all moving averages, I chose to go with that without realising that it’s different from the original rule. But you are right that there wouldn’t be a large difference between them.

      Reply
  4. CryptoMAD says

    April 13, 2018 at 2:55 PM

    I use indicators as a filter but I base my trading on Price Action

    Reply
  5. Naren Das says

    May 15, 2018 at 2:35 PM

    Does it work only in a trending market or even in ranging markets?

    Reply
    • Galen Woods says

      May 21, 2018 at 9:40 AM

      This strategy is designed to catch pullbacks in a trending market. You might want to check out strategies like the Gimmee Bar for ranging markets.

      Reply
  6. K_Charles says

    August 22, 2020 at 8:32 PM

    Do we need to plot DI +/- with ADX(14)? DI values are combined in most of the ADX indicator.

    Reply
    • Galen Woods says

      August 24, 2020 at 4:40 PM

      You can plot them, but they usually add value by showing us if the market is bullish or bearish. (DI+ above or below DI-). However, in the context of a strong trend like in this step, if you look at the price action, you can always tell if the market trend is bullish or bearish.

      Reply

Leave a Reply Cancel reply

Your email address will not be published. Required fields are marked *


Search Trading Setups Review

Get a Free Course Chapter from Galen Woods' Day Trading With Price Action Course [PDF]

Plus, our latest trading guides and tips in right your inbox.

Recommended For You

Forex Price Action Re-Entry Trading Strategy

Three Black Crows Candlestick Pattern Trading Guide

Top 10 Price Action Trading Books

4 Price Action Methods to Define the Intraday Trend: Part I

5 Practical Steps to Become a Price Action Trader

How To Identify Demand and Supply Using Price Action

A Practical Guide To Price Action Trading

Trading Course Banner

Top Trading Books

Top 10 Volume Trading Books

7 Forex Trading Books To Get You Started

18 Trading Psychology Books To Help You Trade Better

Top 10 Price Action Trading Books

7 Trading Books For Your Library


If Trading Setups Review has helped you trade better, please help us stay ad-free by buying me a coffee.

Support me on Ko-fi

Or, check out other ways to support us here.

Thank you for being awesome.


Trading Setups Review

  • Support Us
  • Contact Us
  • About Us
  • Privacy Policy
  • Affiliate Disclaimer
  • Full Risk Disclosure

Learn More

  • Day Trading With Price Action Course
  • TSR Trading Guides
  • Trading Setups
  • Trading Articles
  • Trading Books
  • Site Map

Futures and forex trading contains substantial risk and is not for every investor. An investor could potentially lose all or more than the initial investment. Risk capital is money that can be lost without jeopardizing ones financial security or life style. Only risk capital should be used for trading and only those with sufficient risk capital should consider trading. Past performance is not necessarily indicative of future results.


The website contents are only for educational purposes. All trades are random examples selected to present the trading setups and are not real trades. All trademarks belong to their respective owners. We are not registered with any regulating body that allows us to give financial and investment advice.


Trading Setups Review © 2012–2022

Anti-Climax Pattern - Free Course Chapter

Learn a new powerful price pattern today!

Download for free now.