Trading With Consecutive WR7 Patterns
By Galen Woods ‐ 8 min read
Learn how to find reversals with consecutive WR7 patterns. Expanding bar range indicates price climaxes which are potent timing tools for traders.
What do you look out for when analyzing price action with Open-High-Low-Close (OHLC) bars or candlesticks? Do you focus on the bar range (High minus Low)? In this WR7 tutorial, you’ll learn a powerful approach to make use of expanding bar range to improve your trading.
The bar range within a period is a volatility measure. It is a critical piece of trading information that traders often overlook.
One of the best ways to make use of this information is to define price patterns with bar range.
Some common examples:
- NR7
- NR4/Inside Bar
- WR7
In this article, we review a specific approach to taking advantage of the WR7 price pattern. While we will not cover a particular strategy, you’ll pick up enough to integrate the WR7 pattern into your trading plan.
What Is WR7?
A WR7 bar has the widest range among the last 7 bars. In this sense, it is the direct opposite of an NR7 pattern.
If you are familiar with the NR7 price pattern, you will have no problem internalizing the WR7 pattern.
The WR7 pattern is unique as it focuses on expanding bar range.
The bottom panel of the chart below shows the bar range.
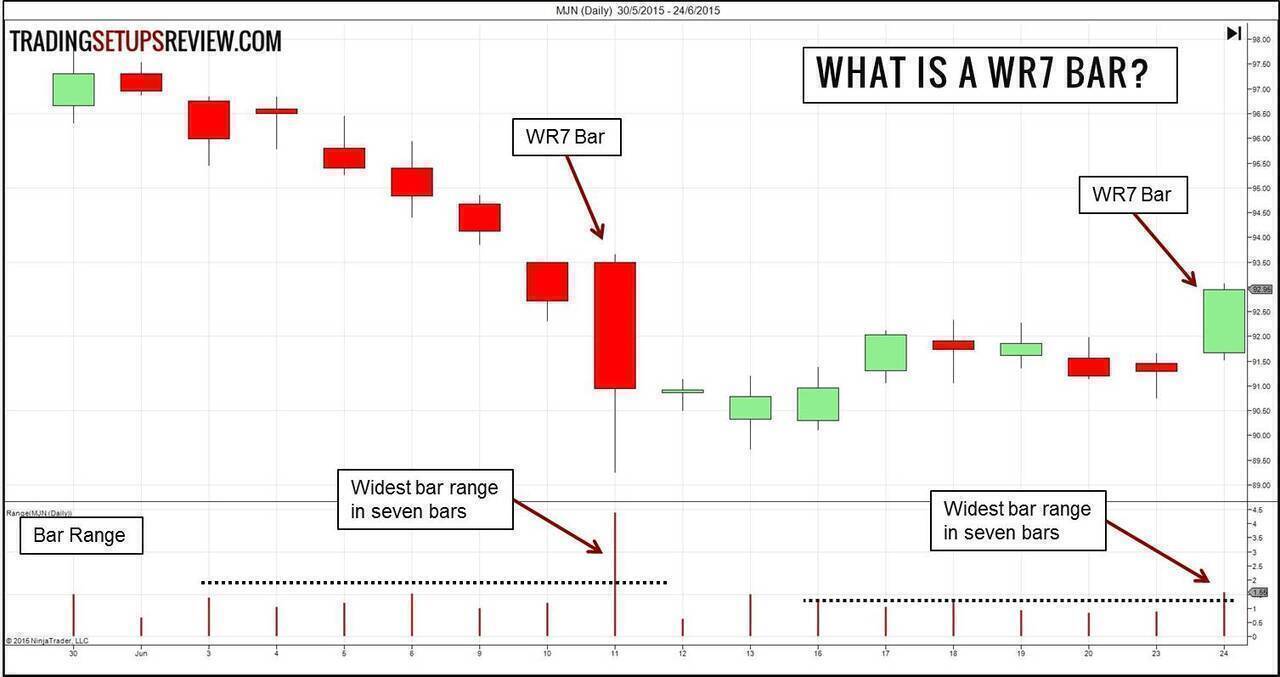
In isolation, a narrow range bar signals uncertainty while a wide range bar shows wild trading.
But relying on a single price bar or candlestick for market analysis is not prudent.
How To Interpret WR7 Bars?
To interpret price action, you need to focus on its context.
This is why we are focusing on a special occurrence - consecutive WR7 patterns. With consecutive WR7 patterns, the first WR7 bar offers a context for interpreting the second WR7.
When you find consecutive WR7 patterns, they are either:
- Opposing each other; or
- Building on the momentum in the same direction.
When you find consecutive WR7 bars opposing each other, take it as a sign that the market is swinging wildly. Under such conditions, it is hard to find a trading edge. In other words, it is a stay clear signal.
When you find consecutive WR7 bars that push the market in one direction, consider the possibility of a reversal. The consecutive WR7 pattern is essentially a climatic pattern.
Expanding bar ranges require an increasing level of market commitment and energy. WR7 is in itself a sign of uncommon bar range expansion, so consecutive WR7 bars are not likely to be sustainable.
WR7 Trading Examples
The examples below highlight the price behavior of consecutive WR7 patterns.
Looking out for this formation empowers you with a versatile analytical tool. By watching the market’s reaction to them, you become better positioned to track the market flow.
For better visuals, the WR7 bars are highlighted in cyan in the charts below.
Example #1 - Pipe or Climax
This daily chart of Micron Technology (MU) shows three instances of consecutive WR7 patterns.
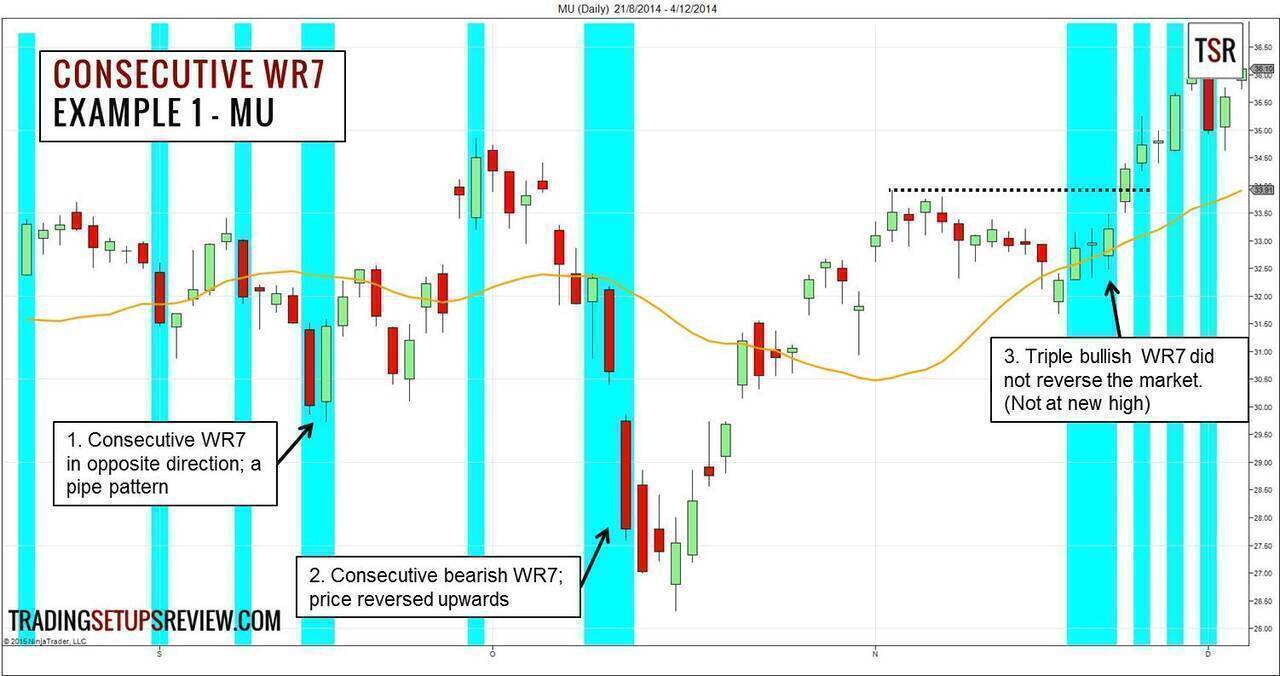
- This pattern type is not our focus here. The two WR7 bars closed in opposing directions. Nonetheless, it formed a pipe pattern, which could also be useful for spotting reversals.
- Here, we have two consecutive bearish WR7 bars. Notably, the two wide bearish bars had a gap in between them. While the market pushed to a new low, prices reversed upwards shortly after.
- This triple WR7 pattern has too much overlap to form a credible climax. (Each WR7 bar overlapped substantially with other WR7 bars). On top of that, the market was not at a new high. Hence, the possibility of a reversal was low.
This example shows that not all consecutive WR7 patterns indicate an impending reversal.
The key here is to look for climactic price action. Looking for WR7 bars offers a good first cut, but blindly trading them is not the way to go.
The next example reinforces this point.
Example #2 - Not All WR7 Patterns Are Equal
This is a daily chart of Microsoft Corporation (MSFT).
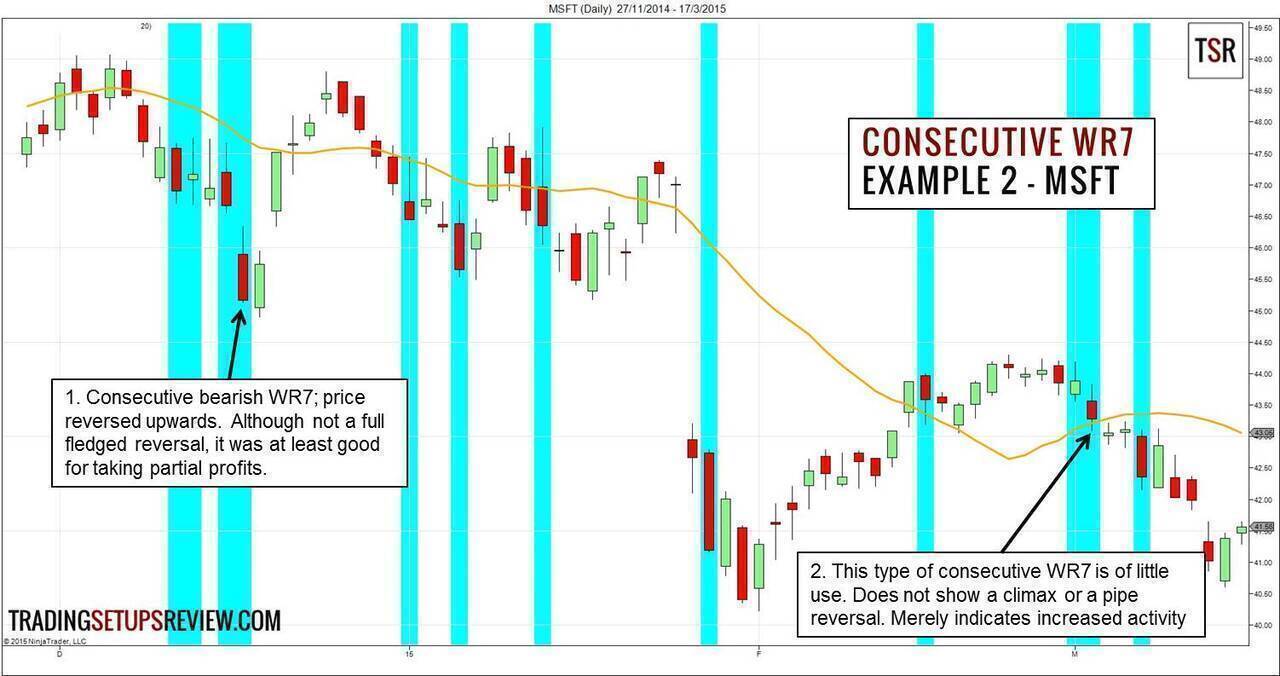
- This was a great climatic pattern that led to a sharp bullish reversal. Although it did not result in a full-blown bullish trend, it was at least a good profit-taking signal for traders in a bearish position.
- Not all consecutive WR7 patterns offer potential setups. This instance was neither a climax nor a pipe pattern. At most, it hinted at an increasingly erratic market.
However, consecutive WR7 patterns are not a common formation. Hence, they do not distract us from analyzing other price patterns. Furthermore, an increase in volatility is always worth a closer look.
Example #3 - Intraday Consecutive WR7 Patterns
Now, let’s shift gears and look at an intraday trading example - FDAX 3-minute.
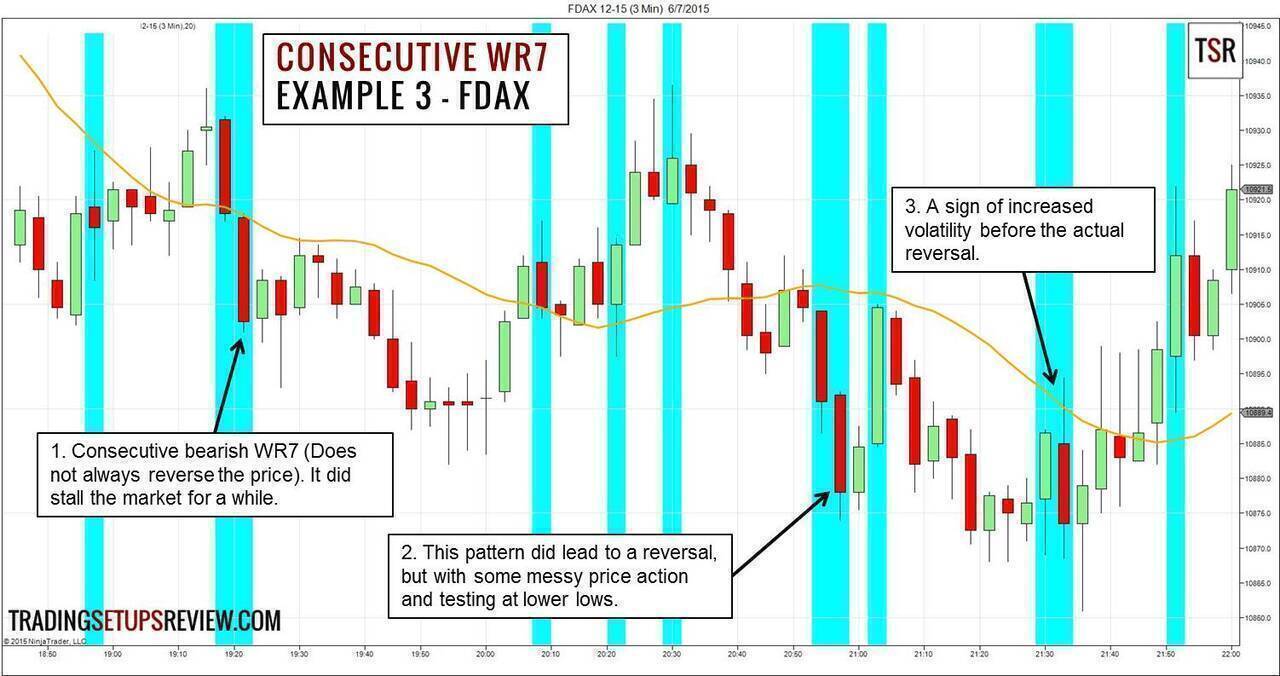
- This instance looked great if you were looking for a reversal. Yet, while the market stalled, it did not reverse. No pattern works all the time.
- These two WR7 bars did better. After an initial bullish thrust, the market tried to push lower but failed.
- This consecutive WR7 pattern was a sign of wild trading as the market struggled at a new low. Eventually, the market resolved in favor of the bulls.
Note that in day trading, you should look out for WR7 patterns only after the first seven bars of the session. It does not make sense to compare the bars of this session to the last few bars of the previous one.
Also, WR7 bars work better on lower (faster) timeframes for intraday trading. To understand this, consider an hourly chart.
Within a trading session, there are times of the day that have high volatility. An hourly chart with WR7 patterns will simply point out these hourly patterns. They are helpful, but not do not add value to ongoing analysis.
Example #4 - Entering Pullback Setups With WR7
Consecutive WR7 patterns are not only helpful for identifying market reversals. You can also take advantage of them in a strong trend.
The chart below shows a bullish stage ideal for demonstrating how WR7 patterns work for trading pullbacks.
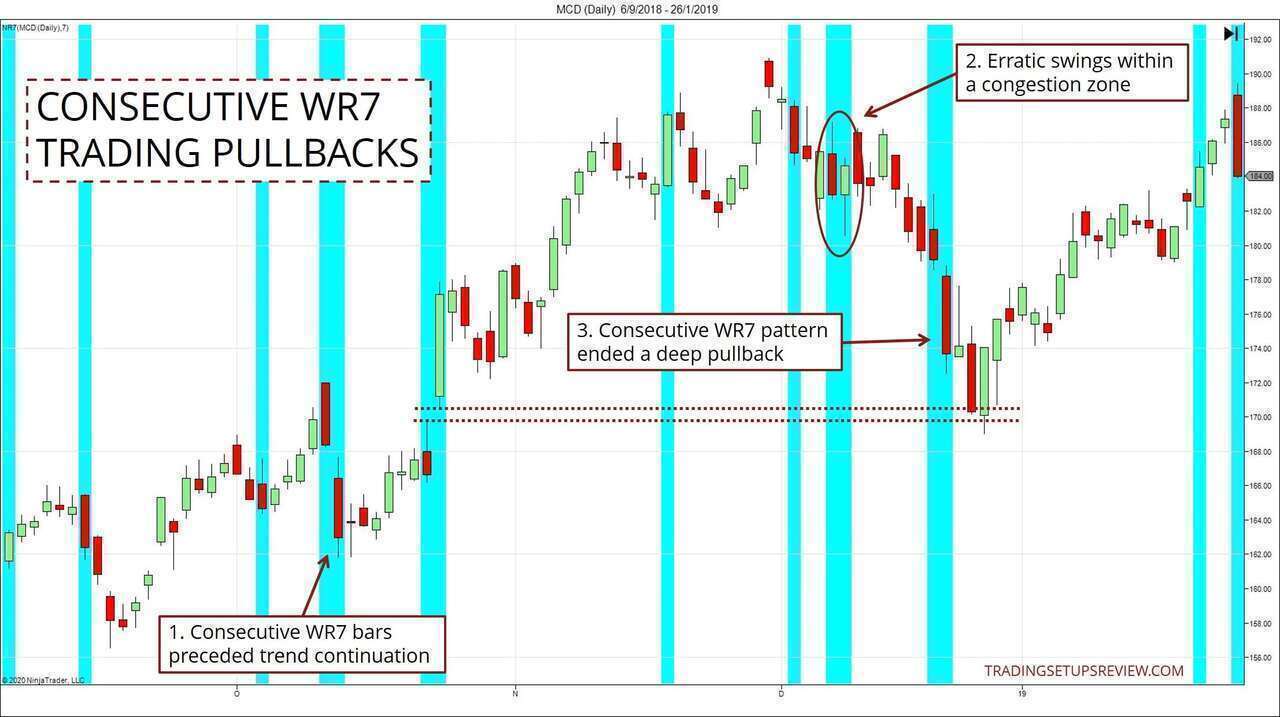
- These consecutive WR7 bars came down with force. However, this bearish thrust failed to follow through. A pullback trader looking to join the rising market could easily find entries within the next few bars.
- These two WR7 bars closed in opposing directions, indicating an erratic congestion zone.
- This WR7 pattern signaled the end of a deep pullback. However, the exact end of the pullback came nearer to a support level offered by an earlier gap.
Example #5 - Stop Orders For Reversal Entries
Consecutive WR7 patterns often signal potential reversals. However, it’s a good idea to ensure that the momentum is on your side before entering into a reversal trade.
And the easiest way to do so is to use stop orders.
In the example below, we will stick to a simple set of entry guidelines:
Bullish Reversal
- Place a buy stop order above each bullish bar after the WR7 pattern.
- Cancel the order if it is not triggered by the next bar.
Bearish Reversal
- Place a sell stop order below each bearish bar after the WR7 pattern.
- Cancel the order if it is not triggered by the next bar.
We cannot place and cancel orders indefinitely.
So it’s up to you to decide how many chances you want to give to a reversal signal, based on your overall market assessment. A rule of thumb is not more than two tries.
Also, do not place any orders if the market follows through in the direction of the WR7 thrust.
Let’s review an example.
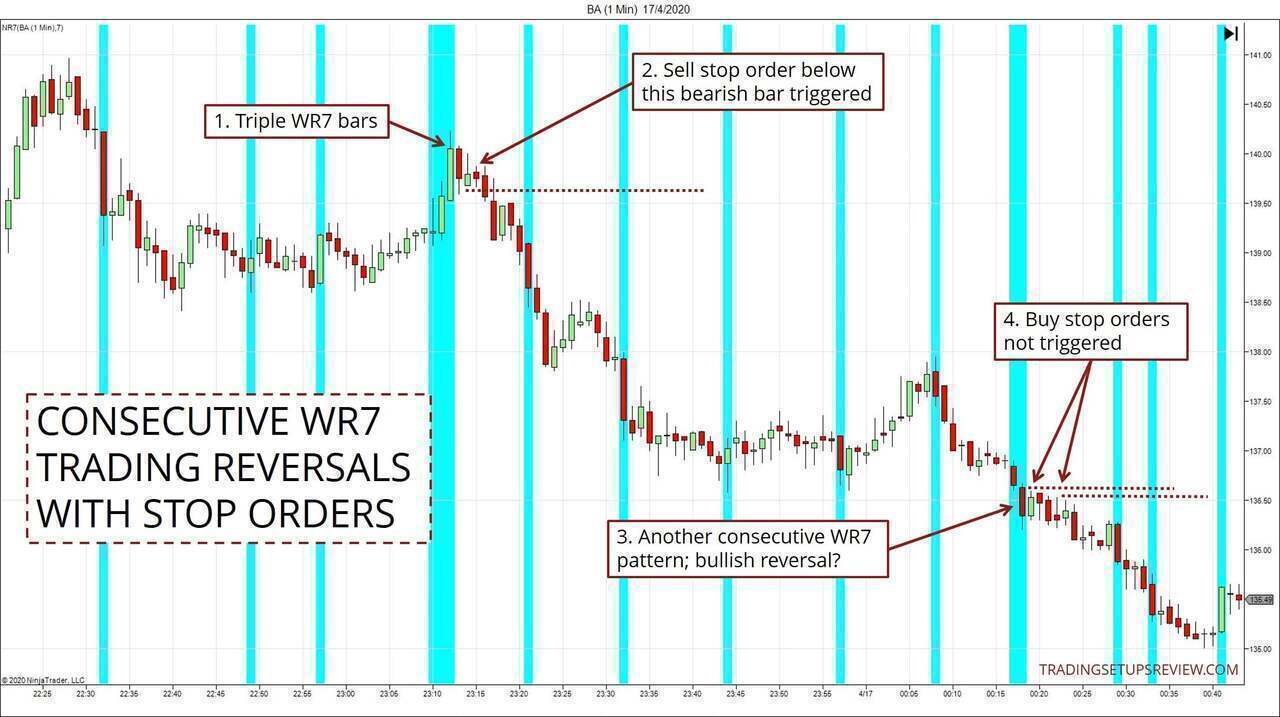
- This bullish surge out of a tight congestion zone consisted of three consecutive WR7 bars. A bearish reversal trade? Let’s place our sell stop order and let the market decide.
- In this case, the market fell and triggered our order. It turned out to be a profitable short trade.
- Another consecutive WR7 pattern, but this time, it signaled a possible bullish reversal.
- However, buy stop orders were not triggered as bullish bars after the WR7 pattern did not enjoy any followthrough.
Instead of trading WR7 patterns blindly, you should wait for confirmation, especially for a major reversal trade.
Tips for Trading with Consecutive WR7
Note that what we have covered above is not a trading strategy per se. It simply shows that consecutive WR7 are useful patterns for any price action trader.
The ideal way forward is to integrate them with your current trading methods.
Finally, here are a few tips for those who want to explore the WR7 pattern further.
#1: Improving Performance
Remember that you are looking for climatic price action.
- This means that WR7 bars that push to new market extremes are better.
- Also, the less the WR7 bars overlap, the better. (Example #1 illustrates this idea.)
Observing volume, together with WR7, is the natural next step. That is what Volume Spread Analysis (VSA) is about.
The “Spread” in VSA refers to the bar range. And focusing on the spread gives you a good foundation for learning VSA.
#2: Study Range Patterns With HiLo Charts
Studying bar range can yield valuable insights.
To do so without distraction, consider using HiLo charts. This chart type plots only the high and low of each price bar, and are usually colored according to the polarity of the bar.
However, for actual trading, use bar or candlestick charts. If not, you will lose too much detail (OHLC) for effective trade entries.
#3: Trade Reversals With Caution
Consecutive WR7 patterns do not pinpoint reversals. Most reversal patterns don’t.
When they work, they only point out the approximate price zone of the market bottom or top. You do not get the exact price and time of reversal.
This poses a challenge for placing both price stops and time stops. Hence, plan your exit strategy before jumping into a WR7 trade that targets trend reversals.
The article was first published on 14 July 2015 and updated on 22 April 2020.