Double Top and Bottom Trading With Bollinger Bands
By Galen Woods ‐ 8 min read
Bollinger Bands is an effective tool for finding reversal patterns like the double top and bottom. Learn how to trade reversals with detailed examples.
Bollinger Bands is a versatile trading indicator that includes a volatility measure. It plots directly over price. Hence, it does not distract us from price action while offering a helpful benchmark.
One way to use the Bollinger Bands effectively is to clarify chart patterns.
As Bollinger Bands reflect market volatility, they are a good gauge of price momentum. Using Bollinger Bands to assess price action adds both depth and focus to our analysis.
In this article, we will focus on using Bollinger Bands to find double tops and bottoms. Also referred to as M and W signals, they are classic reversal chart patterns.
Our primary reference is this guide from StockChart’s ChartSchool. But I will tweak it to my interpretation. We will also focus on integrating price action analysis to augment the approach.
Pattern Identification Guidelines
Not familiar with a double top or bottom?
Click here to learn more about this popular chart pattern before proceeding.
Chart Setup
First, we need to set up our chart.
The closing price of each bar is crucial to this strategy, so it’s best to use a Line On Close chart.
It is a simple line chart that plots only the closing price of each period. This chart type ignores the High-Low-Close data points.
Important note: When defining swing highs and lows for this strategy, we rely only on the Line On Close chart.
For those of us who are used to OHLC charts (like bar and candlestick charts), it’s easy to feel insecure at first. But as you’ll see, focusing on the closing price increases the clarity of your analysis.
On top of that, we have the opportunity to enjoy the best of both worlds (charts). You’ll appreciate this aspect in the trading examples below.
Next, let’s load the Bollinger Bands on our chart with the following settings:
- Lookback period: 20
- Standard deviation multiple: 2
The resulting chart is clean and makes for easy analysis.
Identifying The Double Bottom (W Signal)
Now, let’s learn how to identify the W signal (or double bottom). Bear in mind that the double bottom is a bullish pattern.
Its basic form includes two swing lows around the same price level. On top of that, we will add a few other conditions.
Take a look at the chart below. It shows a double bottom.
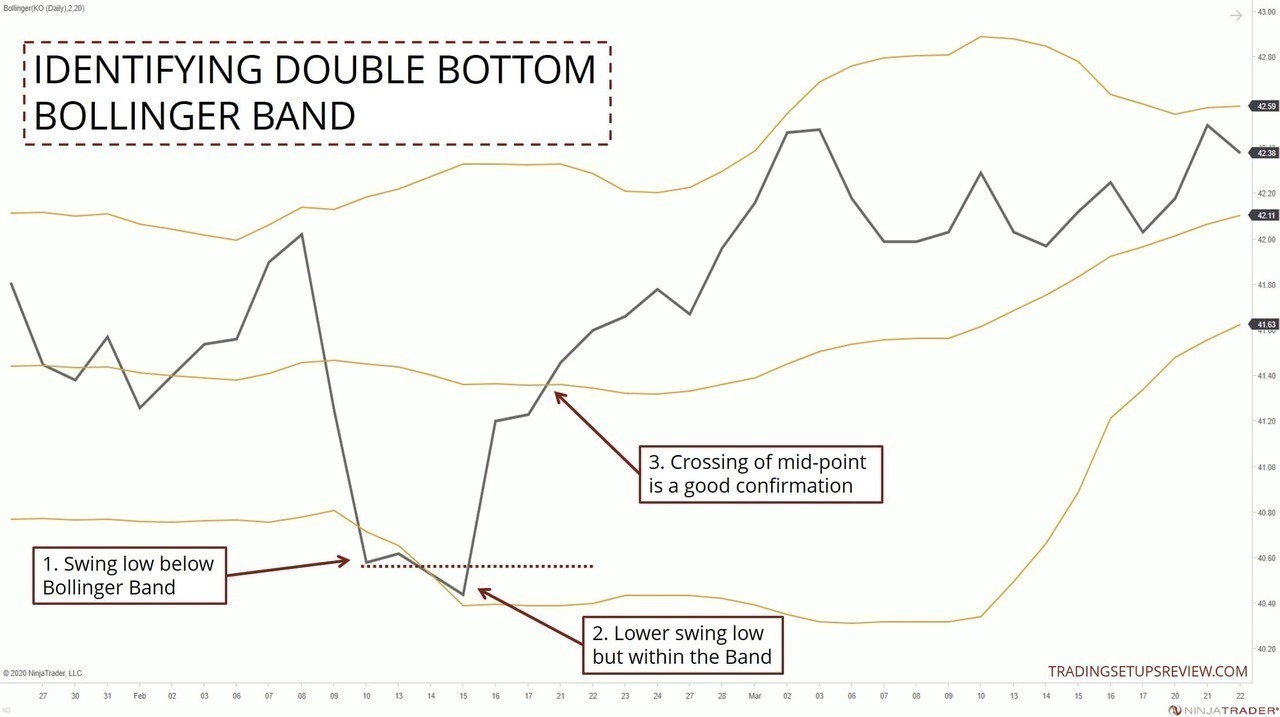
- The first swing low exceeds the Lower Bollinger Band.
- The second swing low is lower than the first swing low but is within the Bollinger Bands.
- Falling below the Bollinger Middle Line is a possible confirmation signal.
A crossover below the Bollinger Middle Line is not always a good confirmation signal. In particular, you should not rely on the Middle Line crossover if the Bollinger Band is narrow.
Identifying The Double Top (M Signal)
The double top or M signal is a bearish pattern.
As the chart below shows, it is the inverse of the W pattern.
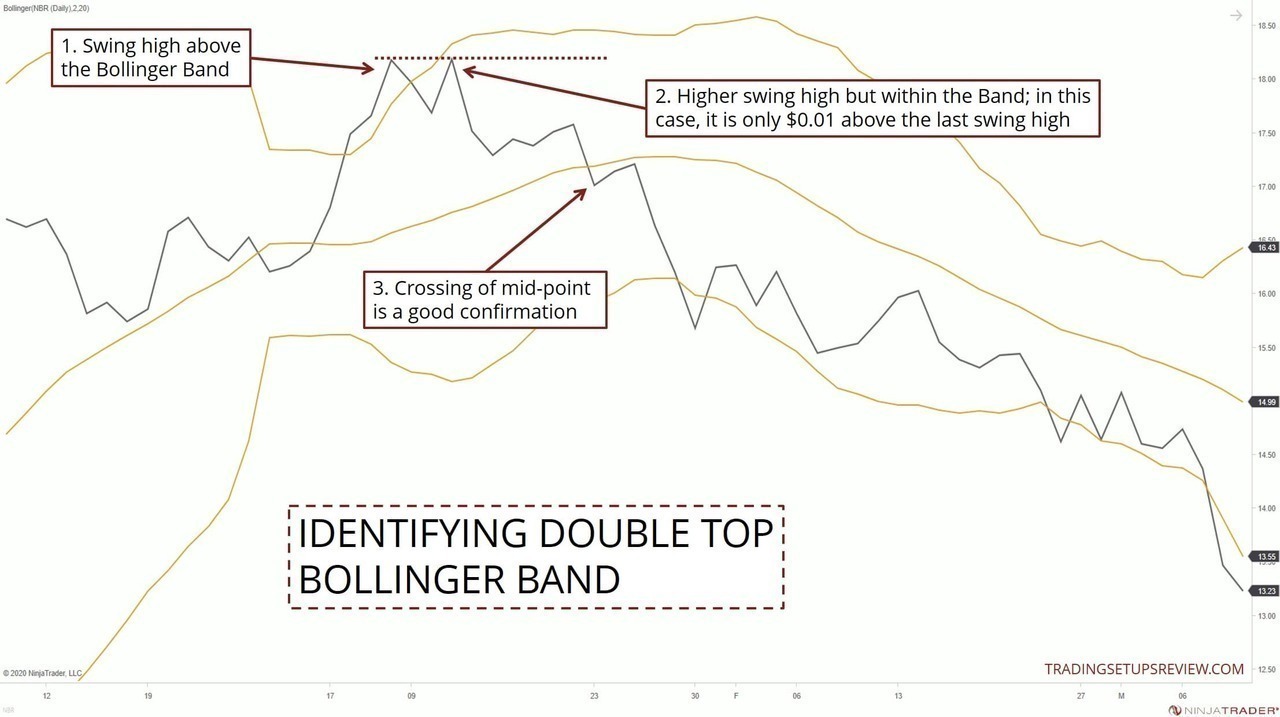
- The first swing high is above the Bollinger Bands.
- The second swing high is above the first swing high but stays within the Bollinger Band. (In this case, the swing high is just $0.01 higher than the first swing high. And that’s okay for our approach.)
- The Middle Line crossover can be taken as a confirmation signal.
Trading Examples
Now, let’s see this strategy in action.
When trading, we should not rely solely on the Line On Close chart as it lacks the full price details.
Hence, after spotting a double top or bottom, it’s prudent to switch to an OHLC chart to refine your entry.
For each example below:
- First, we will look at the Line On Close chart. With the help of the Bollinger Band, we can identify the chart pattern quickly.
- Then, right below the Line On Close chart, we will dive into the full-detail candlestick chart. The candlesticks will offer another perspective for a rounded analysis.
Trading Example #1: Basic Double Bottom
Let’s use the first example to explore the basic concepts behind this setup.
Below, you’ll find a Line On Close chart tiled above a candlestick chart. They show the same market and period with different levels of detail.
This setup allows you to compare them and follow along with the annotated analysis.
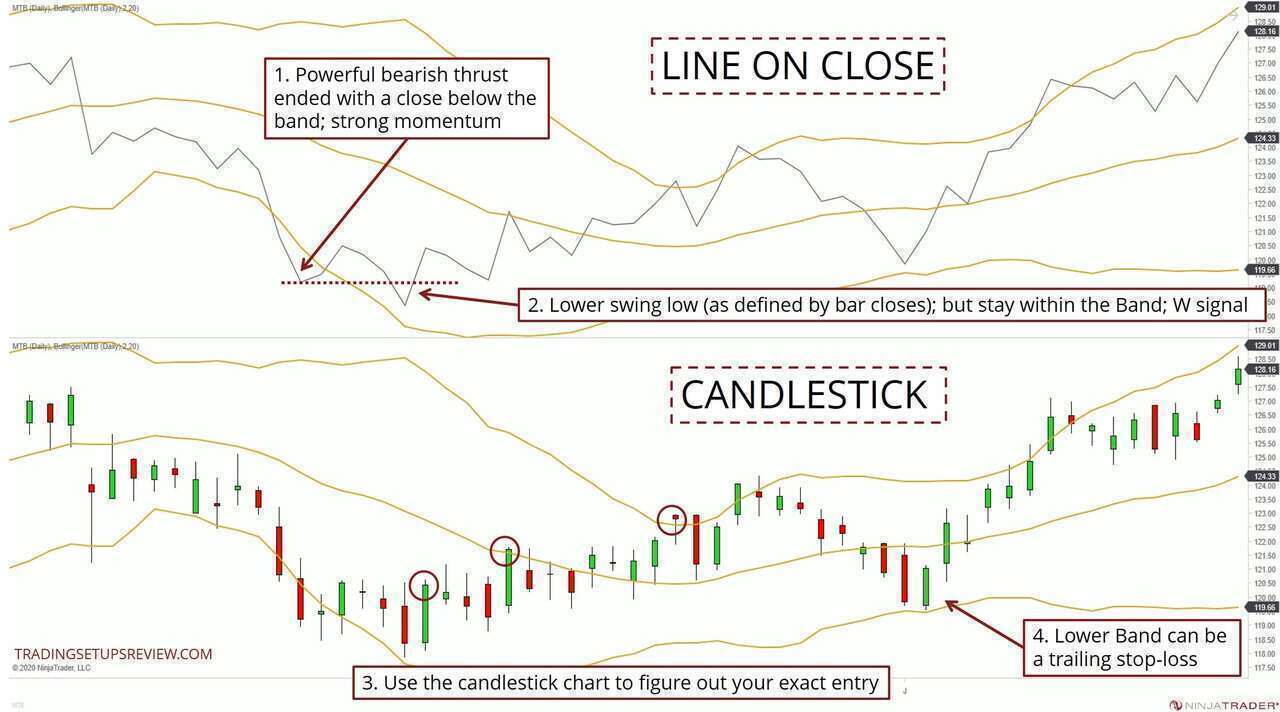
- This strong bearish thrust pushed below the Bollinger Band. It formed the first swing low - a sign of momentum.
- A lower swing low formed here, but it could not push beyond the Bollinger Bands. It means that its magnitude is not catching up with the volatility expansion. With Bollinger Bands and Line On Close charts, we can spot such differences easily.
- You’ll find the candlestick chart helpful for picking your exact entry point.
- For a bullish setup, you may consider using the Lower Band as a trailing stop-loss. But it’s often too wide to be optimal, so consider tightening it once the trend takes off.
The three circled points are the possible entries:
- Upon the formation of the double bottom
- A bar close above the Middle Line
- A bar close above the Upper Band
You can also look for any bullish price patterns for entry. But I did not find any high-quality pattern in this example.
Trading Example #2: Double Top (Failed Breakout)
This example shows a failed breakout that ended as a double top pattern.
As mentioned, once you confirm the double top, revert to the candlestick chart for closer analysis.
Let’s take a look at an example featuring a double top (M signal).
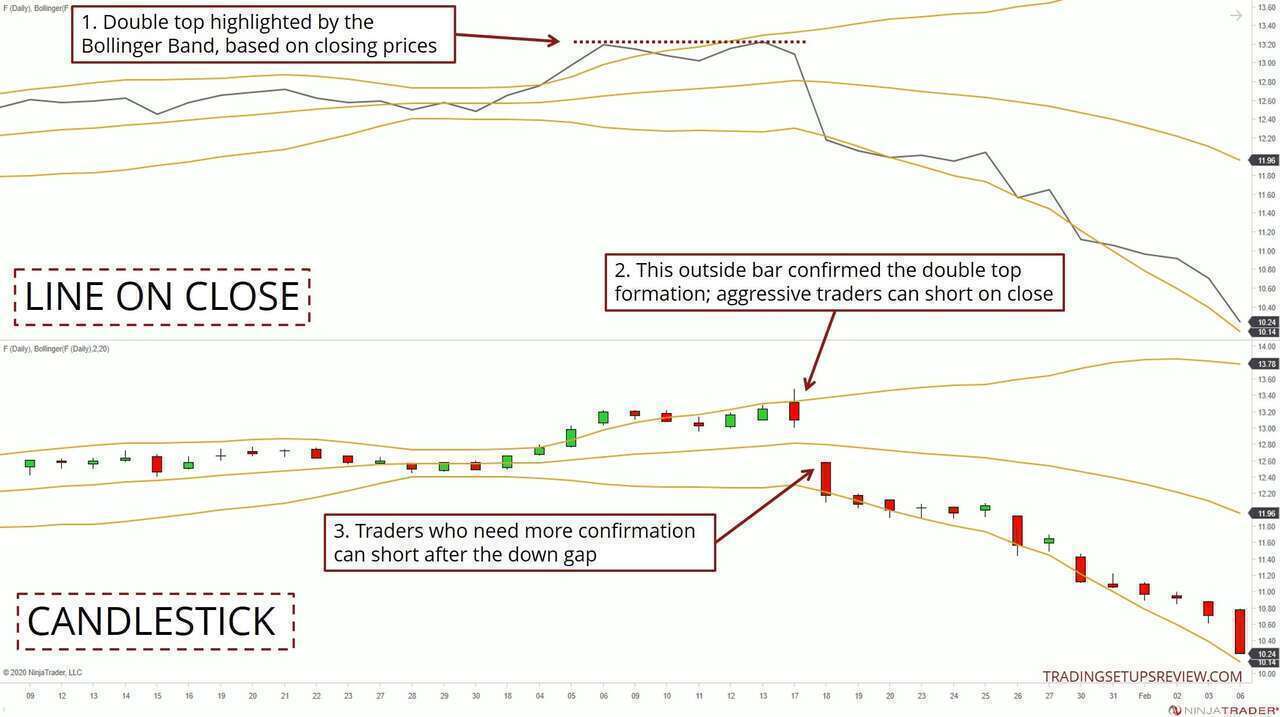
- The double top was apparent on the Line On Close chart. One swing high beyond the Band followed one swing high within the Band. (The second swing high exceeded the first by just $0.03.)
- Looking at the candlestick chart, we see that the market did push above the first swing high. However, the bullish attempt failed and ended as a bearish outside bar. This confirmed our bearish expectations. Aggressive traders would consider entering a short position here.
- For traders who want to wait for confirmation of a reversal, this down gap offered a second chance.
Observe the constricted price action just before the double top pattern. The tight trading range is also known as a Bollinger Squeeze. Hence, the double top was also part of a failed breakout from the Bollinger Squeeze.
Trading Example #3: Double or Triple Bottom?
As you gain experience, you’ll learn that the exact form of the chart pattern is secondary.
Instead, we are only interested in identifying a loss of momentum that might precede a reversal. And this loss of momentum can manifest as many different patterns.
Let’s drive this point home with this final example.
Here, we see that it does not pay to fixate on finding double bottoms. Given the right conditions, it’s fine to trade triple or even quadruple bottoms.
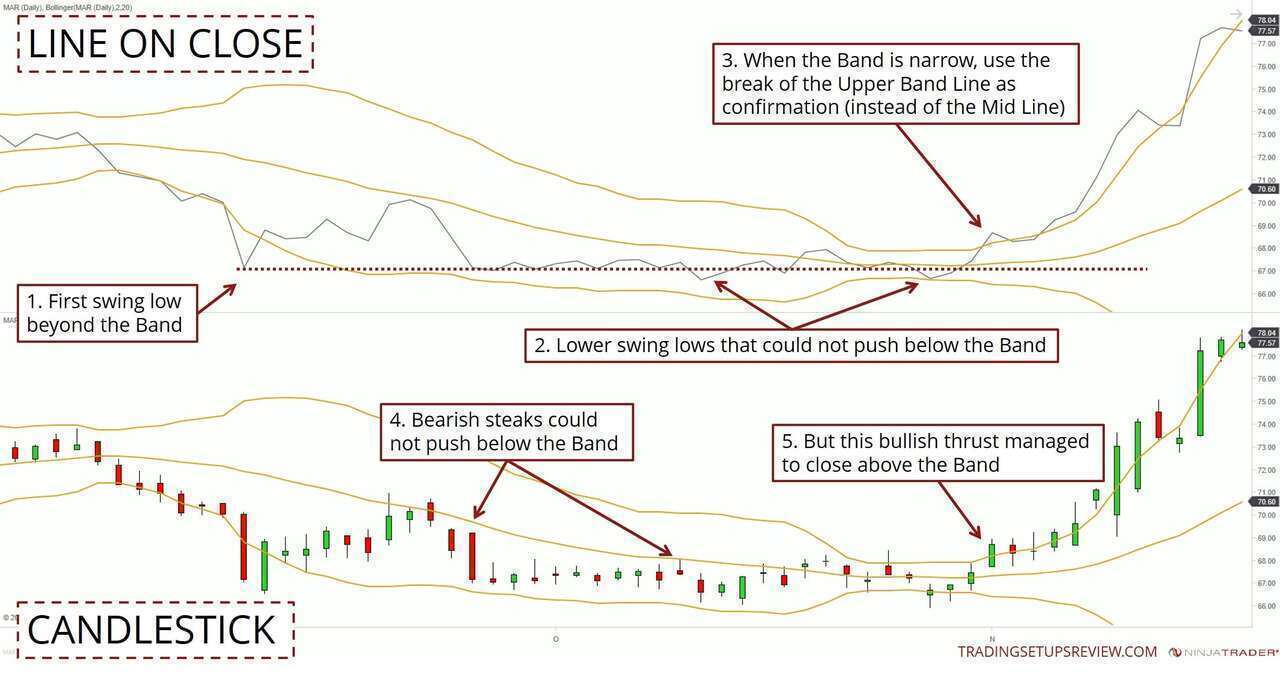
- First, let’s focus on the Line On Close chart. This swing low went below the Bollinger Band and caught our interest. This swing pivot would be our benchmark for judging the later pivots.
- Subsequent price action did descend below this first swing low. Yet, there were no closes below the Bollinger Band. It was a clear sign of momentum loss.
- Earlier, we mentioned that a crossover of the Middle Line could serve as confirmation. However, when the Bollinger Band is narrow, like in this case, it’s prudent to use the Upper Line instead.
- Now, let’s look at the lower candlestick panel. These two streaks of bearish candles did not push the market out of the Bollinger Band.
- But this bullish thrust managed to close above the Bollinger Band. This stark difference confirmed that the market tide had turned bullish.
Entering a long position as the market closed above the Bollinger Band led to a fantastic trade.
Conclusion
Let’s end this article with a few points to note regarding this approach.
First, you will still need to exercise your trading discretion. Although the rules above offer a systematic framework, there’s room for subjectivity.
The tricky part is this. Yes, in the case of a double bottom, the second swing low should be lower than the first one.
But both swing lows should not be too far apart both in time and price.
You will need to judge what is too far.
The reason is simple. Swing pivots that are too far apart (in time or price) cannot be analyzed as part of the same context. And this is a dealbreaker for the double top or bottom pattern.
Next, we are using Bollinger Bands to find reversal patterns based on closing prices. In other words, this strategy relies heavily on closing prices.
Daily closing prices have a fundamental impact because we use them to mark the value of assets each day. Hence, closing prices on daily charts have more informational value than those in intraday charts.
For this reason, I recommend using this approach on daily charts.
Finally, if you’re familiar with divergence strategies, you might’ve noticed some similarities. Here, in essence, we are looking for a divergence between price action and its interaction with the Bollinger Band.
Here are some divergence strategies you might want to check out:
- RSI Divergence (reversal)
- MACD Hidden Divergence (pullbacks)
Also, learn more about improving price action analysis with Bollinger Bands: