A Simple Inside Bar Day Trading Strategy Using YM Futures
By Galen Woods ‐ 5 min read
Learn a simple strategy for the Dow Jones E-mini YM futures. All you need is a simple moving average and a bar pattern called inside bar.
To day trade successfully, we need a market that is volatile and liquid. S&P 500 E-mini (ES) and NASDAQ-100 E-mini (NQ) futures are popular day trading markets. Beyond them, the E-mini DOW (YM) futures contract is also a great choice. Among equity index futures, the trading volume of YM futures ranks right after ES and NQ futures.
Like ES and NQ, YM futures is also an electronically traded contract. Its underlying is the Dow Jones Industrial Index. For a one-point movement in the index, its value changes by $5.
If you are completely new to futures, you should spend some time browsing CME’s website.
Read on for a simple inside bar day trading strategy with examples from the YM futures market.
Time-frame For Day Trading YM futures
The 5-minute time-frame is a common choice among day traders. But that is just a convention.
Instead, I use the Price Action Time-frame Index (PATI) to find time-frames that are tradeable. It finds the smallest time-frame that is tradeable for a price action trader. As long as you are trading above the minimum tradeable time-frame (MTT), price action analysis is possible. But note that the MTT changes over time as market price action changes.
For the YM futures market, its current MTT is the 4-minute time-frame. Trading using the MTT offers the highest number of trading setups. Hence, we will be using the 4-minute time-frame.
If you prefer fewer setups or longer intervals for ongoing analysis, increase your time-frame.
(The concepts of PATI and MTT are explained in my course - “Day Trading with Price Action”.)
Trading Rules - Simple Inside Bar Day Trading
These rules attempt to capture the first low-risk pullback in a new trend using an inside bar. We define the trend with the help of a 21-period simple moving average (SMA).
Bullish Inside Bar Trading Setup
- From below the SMA, the market rises completely above it. A price bar must clear above the SMA.
- Wait for the first bullish inside bar.
- Place a buy stop order a tick above it.
(Why use a stop order to enter the market?)
Bearish Inside Bar Trading Setup
- From above the SMA, the market falls completely below it. A price bar must clear below the SMA.
- Wait for the first bearish inside bar.
- Place a sell stop order a tick below it.
Simple Inside Bar Day Trading Examples
The charts below show the YM futures market using 4-minute candlesticks. The orange line is a 21-period SMA.
Winning Trade - YM Futures Bearish Inside Bar
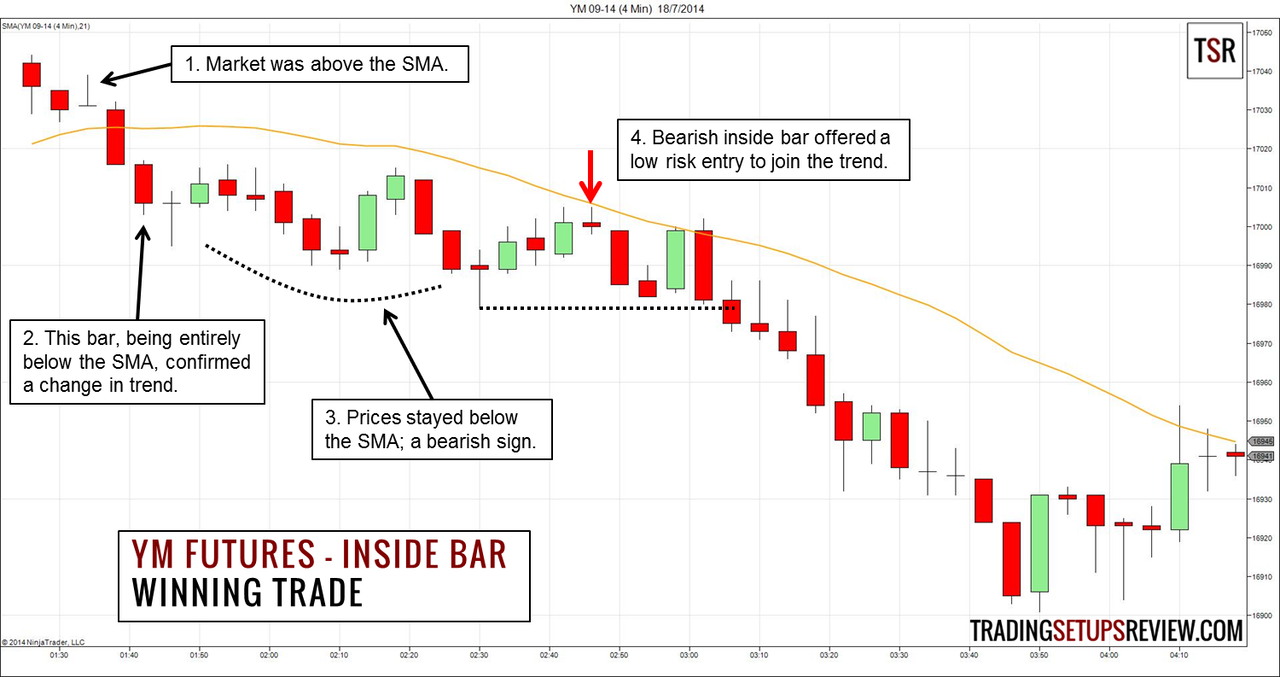
- The market was above the SMA.
- This bar went below the SMA and signaled a change in trend. We started looking out for bearish inside bars.
- After YM pushed below the SMA, it did not prompt any significant bullish response. None of the candlesticks manage to test the SMA above it.
- At the end of its third attempt to rise towards the SMA, a bearish inside bar formed. We sold a tick below it.
There are many options for exiting. As we expected the trend to continue, the most conservative target is at the last extreme low. (horizontal dotted line)
Even with this conservative target, this trading setup gave us a 2:1 reward-to-risk ratio. Hence, it was a setup of high positive expectancy.
Losing Trade - YM Futures Bullish Inside Bar
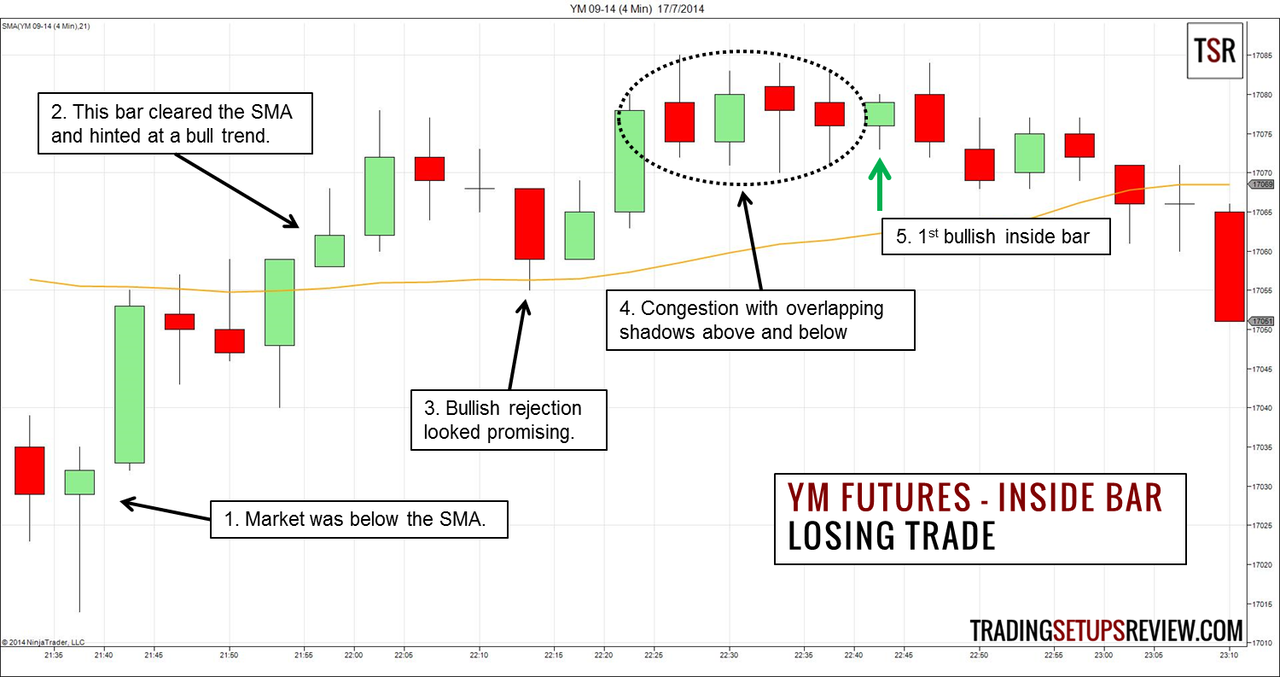
The first bar on this chart is also the first bar of the session.
- This session started below the SMA.
- Within half an hour, YM managed to clear above the SMA.
- The SMA rejected the first test by the market from above, giving hope to bullish sentiments.
- However, as the market made a new session high, it started congesting. The candle bodies contracted and prices moved sideways.
- Within this congestion, a bullish inside bar formed. We bought above this bar and got stopped out immediately.
Review - Simple Inside Bar Day Trading Strategy
In an active market, using the right time-frame, inside bars offer great trading windows. It is a tool to control our risk and time our entries in a trending market.
While we used YM futures in this example, you can use this strategy in other liquid and volatile markets.
This trading strategy is simple as you only need a SMA and knowledge of inside bars. But there are two points to take note of when employing this trading strategy.
First, look for new trends. This is because retracement trades early in a trend has higher chance of success and more room for profit.
Second, avoid congestion areas. This is crucial for inside bar trading. This is because inside bars are often found in congestion patterns. The trick here is to distinguish between an inside bar in congestion and one that is not. You will suffer whipsaws if you assume that the trend will continue when the market is actually in congestion.
Look at the two examples again. In the winning example, YM was clearly drifting upwards and the top shadows were more prominent. It was not congesting. But in the losing example, the price bars were meandering sideways with both top and bottom shadows. It was definitely forming a congestion pattern. Hence, we should have avoided trading the bullish inside bar.
With regards to target placement, you should at least aim for the last extreme of the trend. When the momentum is clear, you can aim further. You can use support/resistance areas projected using past swing pivots and price thrusts. Another good option is the high or low of the last trading session.
Read: 10 Ways to Take Profit
In all, this YM futures strategy is a solid starting point for building your own simple trading method.