Inside Day NR4 (ID/NR4) Pattern Trading Guide
By Galen Woods ‐ 8 min read
The ID/NR4 pattern combines an inside bar with an NR4 pattern to create a low risk trading setup trigger which is effective for both swing and day trading.
Toby Crabel, a pioneer in systematic trading, did some serious work on volatility patterns found in price action. In his splendid work, “Day Trading with Short Term Price Patterns and Opening Range Breakout,” he discussed his research of many volatility-based price patterns, including the Inside Day/NR4 (ID/NR4).
What is the ID/NR4 Pattern?
This bar pattern combines two popular price action concepts:
- Inside Day
- NR4
If you are already familiar with them as individual patterns, you can quickly grasp this volatility pattern.
Inside Day (or Inside Bar)
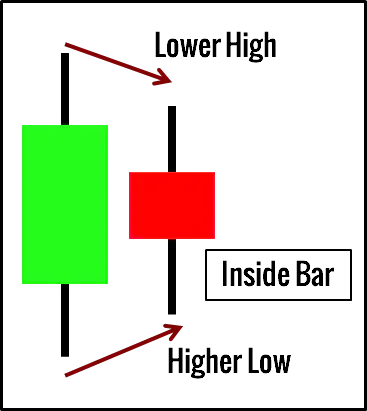
An inside day (or inside bar) has a lower high and higher low than the previous bar. This means that it is nested entirely within the range of the bar immediately preceding it.
It tells us that the market is becoming less volatile (smaller range) and is staying within an established range (defined by the previous bar).
The diagram below shows an inside bar.
NR4 Pattern
An NR4 pattern is a bar with the narrowest range (NR) out of the last 4 bars.
Unlike the inside day, the NR4 may push higher or lower than previous price bars. Hence, it does not guarantee sideways action. However, it helps to contextualize the decreased volatility by examining a few bars back in time.
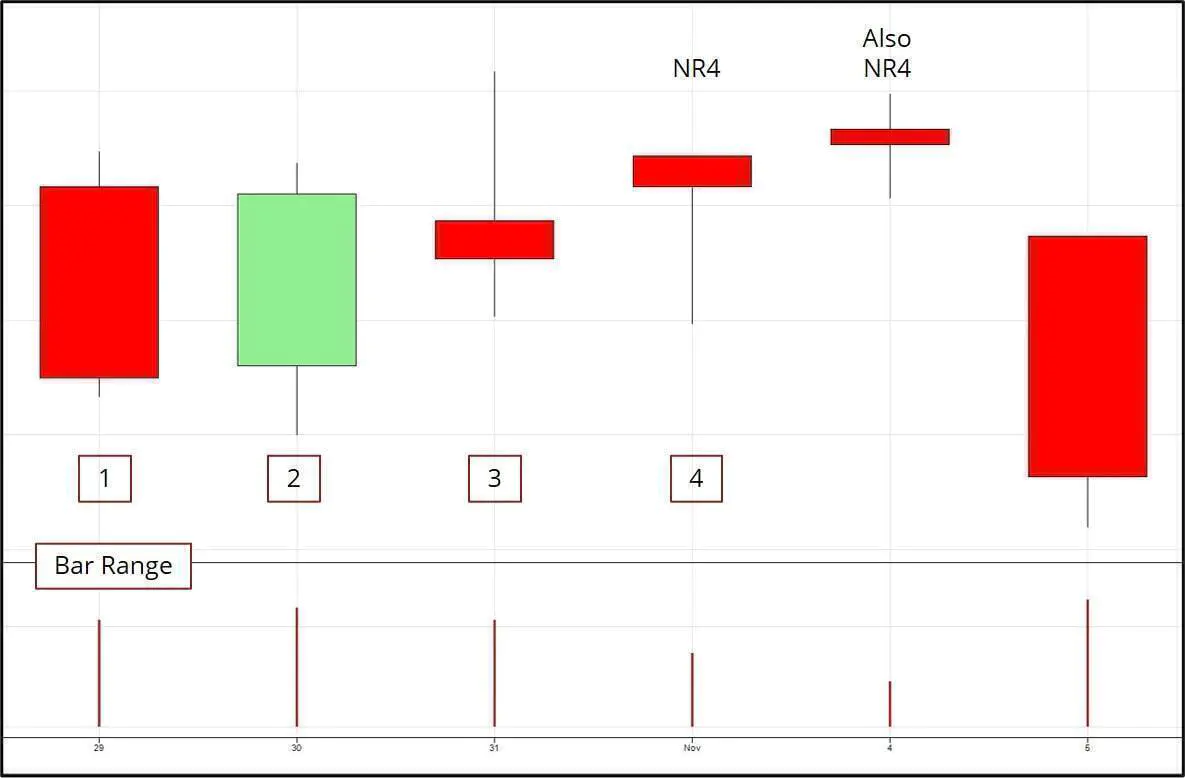
As you can see in the chart above, in any set of four bars, if the last bar has the smallest range in the set, it presents an NR4 pattern.
Combining Two Volatility Patterns
As you can see, inside bars and NR4 are common standalone patterns.
However, by combining the two concepts, we get a less frequent pattern that works well for identifying days of decreased range and volatility.
Once we find an inside bar that is also the narrowest bar in the last four bars, the standard approach is to stay patient and trade the breakout as volatility resumes.
Trading Rules for ID/NR4
The trading rules below focus on identifying the pattern and using it to enter the market.
You can use the pattern for both retracement and reversal entries. Hence, the rules assume that you have a method for analyzing the context and determining the market bias.
Rules For Long
- Find an inside bar with the smallest range out of the last four bars.
- Place a buy stop order above the high of the bar.
- Wait for a breakout to trigger the order.
Rules For Short
- Find an inside bar with the smallest range out of the last four bars.
- Place a sell stop order below the low of the bar.
- Wait for a breakout to trigger the order.
Guidelines
On top of the rules above, consider these guidelines to find the best setups with limited risk.
- If the bar immediately following the ID/NR4 bar does not trigger the entry order, cancel the order and wait for the following pattern.
- Place a stop-loss order at the opposite end of the ID/NR4 bar.
Trading Examples for ID/NR4
The examples below cover a variety of scenarios, including pullback and reversal, winning and losing trades.
In Example #1 and #4 below, you’ll find more patterns marked out as I’ve applied our Price Action Pattern Indicator for better visuals.
Example #1: Catching a Breakout
The chart below shows how the ID/NR4 patterns helped with our context analysis.
The patterns are marked with green and red arrows, depending on which side of the moving average they fall on.
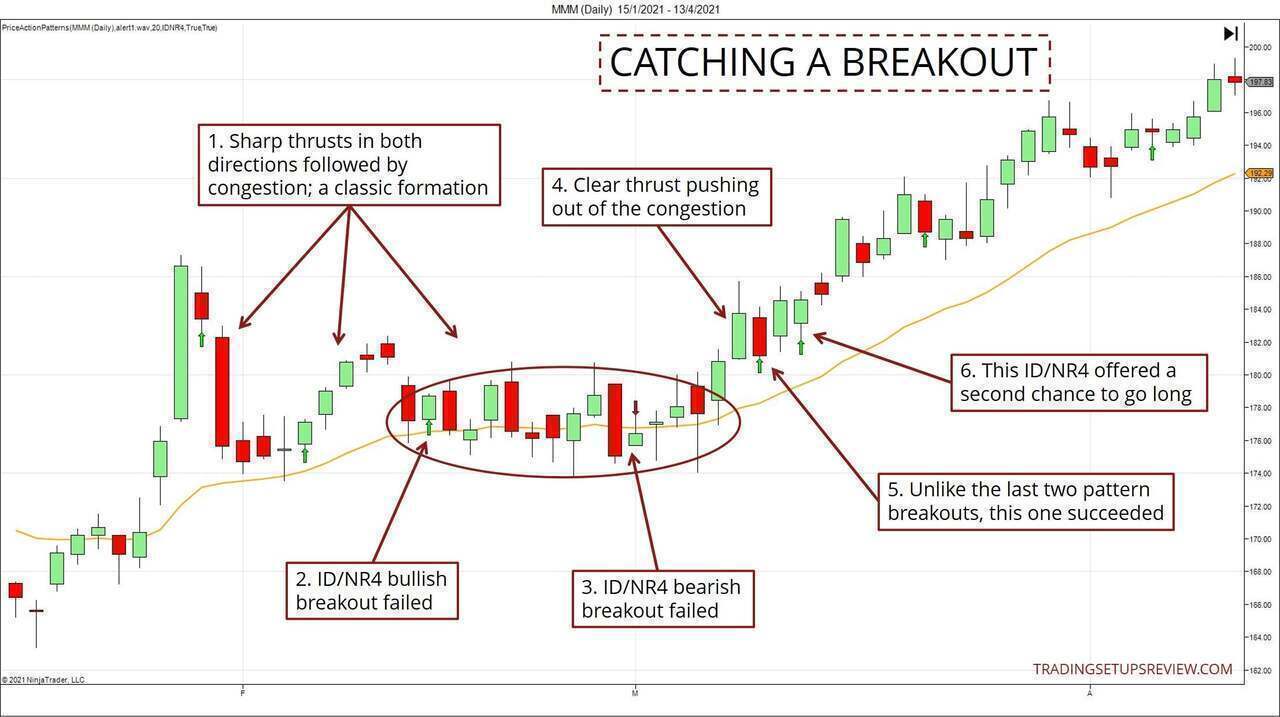
- After a dramatic push to a new high, the market started on a classic formation. It formed sharp thrusts in both directions before moving into a tight range. Think of the tight range as a result of exhaustion on the part of both the bulls and the bears.
- Within the circled congestion, a bullish ID/NR4 breakout failed. This marked a change in context, as the two preceding ID/NR4 breakouts enjoyed follow-through.
- The bearish breakout failed to take off as well. It is not surprising as breakouts tend to fail within a trading range.
- At last, the market showed a clear thrust away from the congestion.
- Unlike the last two patterns, this ID/NR4 had a healthy breakout bar that closed above its high.
- If you missed the first chance to go long, this second ID/NR4 offered another chance to do so. Also, note that both patterns were entirely above the moving average, implying a solid bullish bias.
Example #2: Pattern with Pivot Support
This chart shows the daily prices of EUR/USD. The green arrow marks an inside day with the smallest range out of the last 4 bars.
We placed a buy stop order at the high of the ID/NR4, and it was triggered the next day. Prices went up for the next few days.
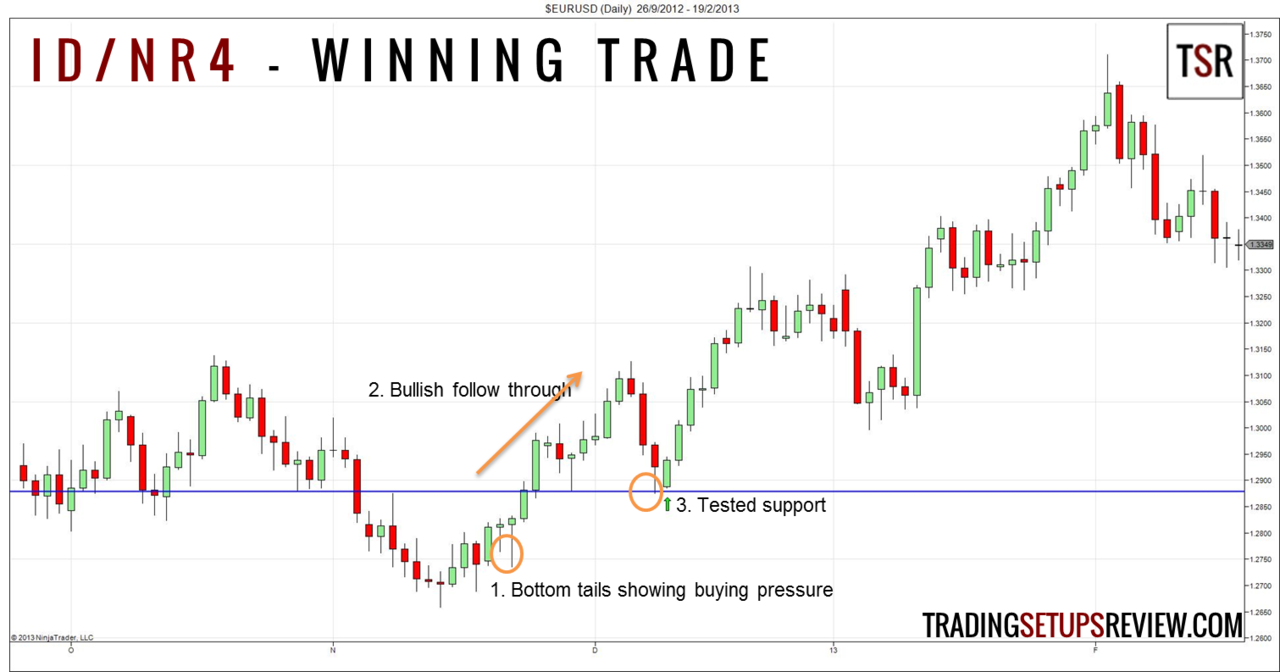
The previous bullish price action was ideal for this long position:
- The outside bar with an extended bottom tail points to buying pressure.
- The buying pressure was sustained, looking at the bullish follow-through. (Look at the two streaks of consecutive five to six bullish bars.)
- The three bearish bars before our signal bar were powerful. However, the support from the previous swing low (blue line) held up. The bar that tested the support showed an extended bottom tail which implied bullish pressure. The ID/NR4 pattern formed right after the test of the support and led to a nice bull run.
Example #3: Losing Trade
For a balanced discussion, let’s look at a pattern that didn’t work out.
This daily chart of chemical giant DuPont listed on NYSE shows an ID/NR4 marked by a green arrow.
We entered the next day as prices broke the high of the ID/NR4 bar. Prices moved sideways for a few days before stopping us out by breaking below the ID/NR4 pattern.
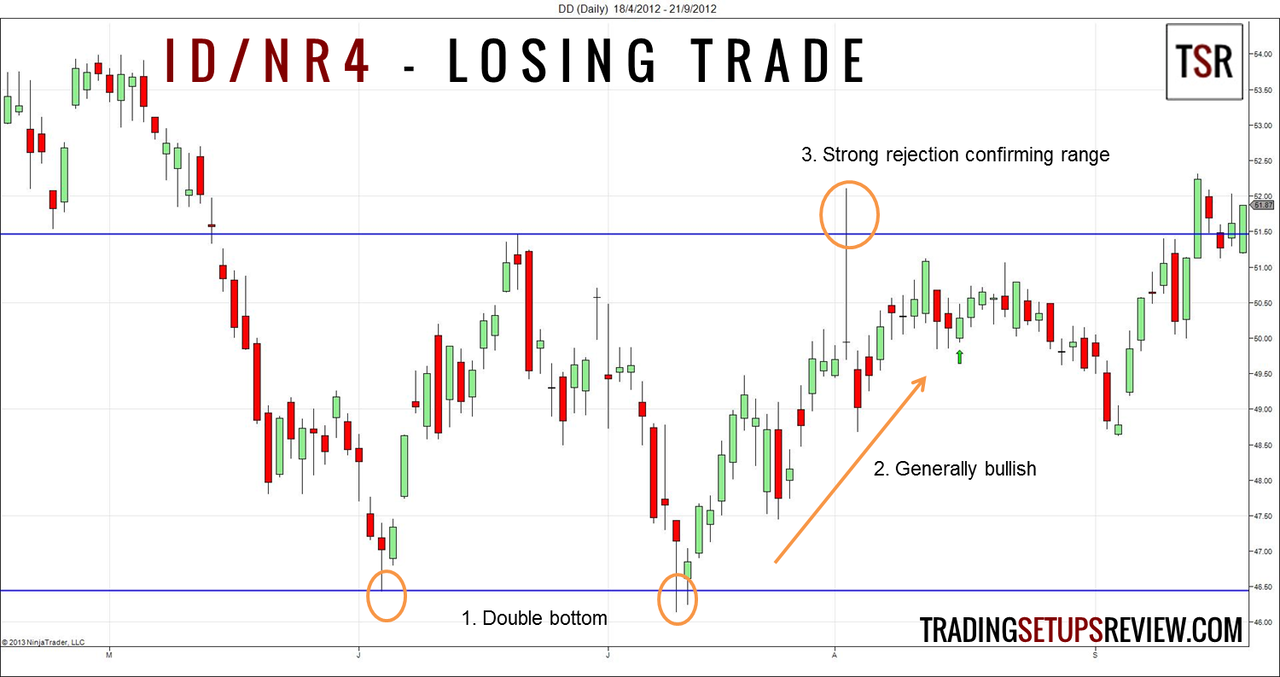
The market was trapped in a trading range. In a meandering market, we should sell near the top of the range and buy near its bottom. Hence, the ID/NR4 buy signal at the top of the range did not bode well.
Let’s zoom in on the exciting price action features in this chart.
- After the breakdown of prices, the market formed an apparent double bottom.
- The market bounced off the double bottom with bullish strength.
- This remarkable Gravestone Doji confirmed that the market was trapped in a range. This single candlestick should deter most traders from going long until more bullish action unfolds beyond the range (marked by the two blue lines).
The ID/NR4 pattern here formed shortly after the Gravestone Doji and before the price action cleared up.
Example #4: Catching a Reversal
This example shows the pattern serving as a low-risk entry setup for a reversal trade.
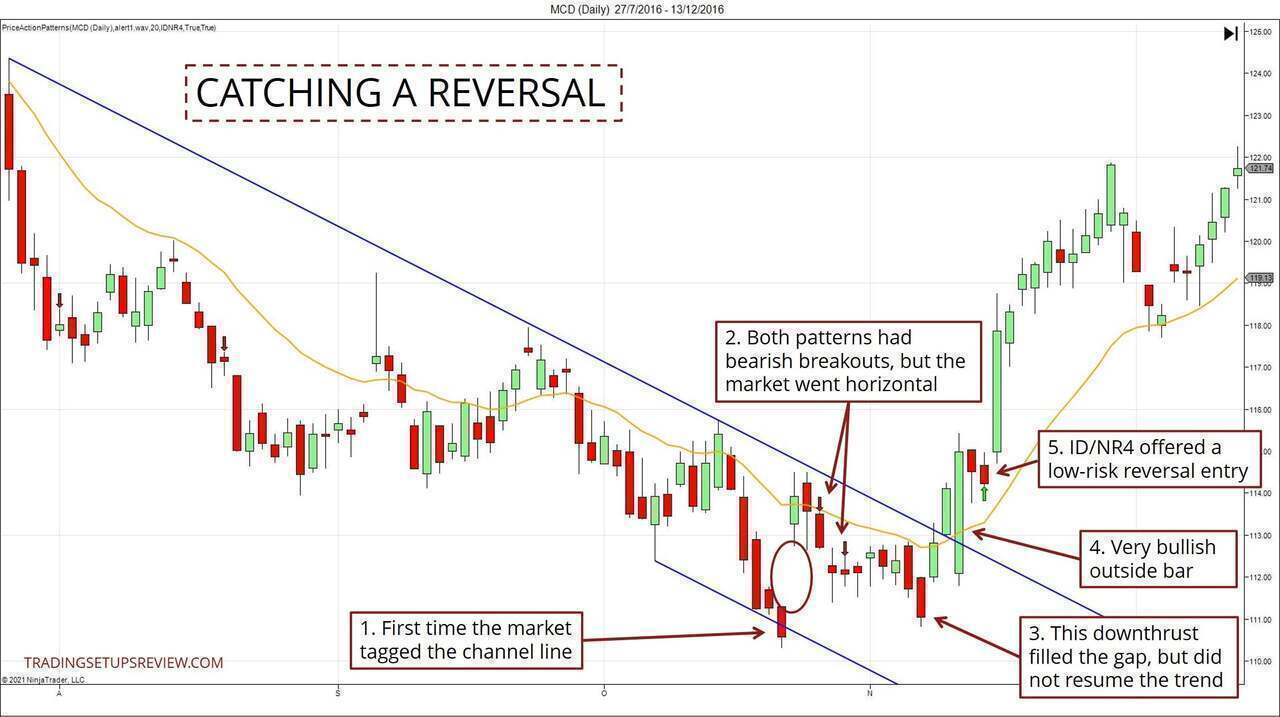
- As the trend progressed, this channel had been adjusted three times from the same anchor pivot. This was the first instance of the market tagging the channel line. This tag hinted at possible bearish exhaustion.
- A bullish gap followed the channel line tag. We observed two ID/NR4 patterns after that. Both were triggered on the bearish side but did not lead to much movement.
- This downthrust filled the bullish gap and presented a significant development. We expected the bears to follow through and continue pushing to a new trend low, but that did not happen. The failure to meet this bearish expectation is in itself bullish.
- This powerful bullish outside bar broke the bear trend line and bolstered the bullishness observed earlier. We were ready for a bullish reversal trade if there’s a suitable trigger.
- This ID/NR4 pattern served as a low-risk trigger for joining the new bull trend.
The key here is that the reversal has nothing to do with the ID/NR4 setup.
Instead, it was the context that pointed to a possible reversal. And this context is made up of other price action features that preceded the entry pattern.
Review - Inside Day NR4 Pattern
This unique pattern highlights days with low volatility and a small range.
Unlike the Bollinger Squeeze, which identifies a drop in volatility over a period, the ID/NR4 pattern indicates a decrease in volatility over several bars.
Accordingly, ID/NR4 is a short-term volatility pattern.
Hence, it is crucial to look at the context before taking any trades with the ID/NR4. It is not a pattern you should trade in isolation.
Experiment with a trend filter like a moving average and pay more attention to the market context. You might be tempted to place bracket orders to catch breakouts in both directions. But I find it less confusing and more effective to have a well-defined market bias and look for breakouts only in that direction.
(Need help finding the pattern? We have something for you.)
The examples above show that, with the proper context, this pattern is a solid low-risk trigger.
However, if the market is in a range, the ID/NR4 pattern might be part of prolonged congestion. The inside bar might even be a trap.
Although I did not cover any intraday trading examples, you can look for this pattern in day trading. They work well for joining a fast-moving runaway market with defined risk.
But importantly, avoid crowded markets as pattern failures are expected when the market is moving sideways. For intraday trading, you can do this easily by avoiding the duller hours of the trading session.
I highly recommend Toby Crabel’s book - Day Trading With Short Term Price Patterns and Opening Range Breakout if you find this pattern fascinating. It offers a wealth of ideas for identifying short-term bar patterns.
Also, for more trading patterns that make use of volatility (changes in bar range), check out:
The article was first published on 31 January 2013 and updated on 29 April 2021.