A Simple and Complete Trend Line Trading Strategy For Price Action Traders
By Galen Woods ‐ 8 min read
Trend lines are great trading tools that are effective for tracking market bias and clarifying price action. Learn a simple trend line trading strategy
Trend lines are fascinating trading tools for analyzing price action. It is not the Holy Grail. But it does force you to focus on price action and help you align with the market bias.
By combining trend lines with price patterns, you can also use it to pinpoint trade entries. This versatility explains its popularity among traders and investors alike.
This goal here is to familiarize you with a stripped-down trend line trading strategy. With a barebones trading strategy like this one, you can adapt it to your timeframe and market with ease.
This trading strategy is complete in the sense that it has clearly defined:
- Entry rules
- Stop-loss placement
- Profit-taking rule
In a nutshell, other than a trade entry, it comes with a complete exit system that caters to both losing and profitable trades. But do note that this strategy is not meant to be traded mechanically.
Content Overview
- Trading Strategy
- Trading Rules
- Trading Examples
- In-Depth Discussion
- Conclusion and Further Resources
The Simple Trend Line Trading Strategy
What I want to offer here is a simple foundation for you to learn and appreciate trend lines as a trading tool. So let’s focus on how trend lines and price patterns work together within a simple framework.
Our strategy targets trend continuations.
It is adapted from my earlier article: Template For A Simple Day Trading Strategy. However, here, we will look beyond day trading setups.
Simple strategies are usually applicable to a variety of timeframes and markets.
This is why you will find both intraday and daily swing trading examples below. I’ve also tried to draw examples from different markets, including stocks, forex, and futures.
On top of that, for a balanced perspective, we will also review one losing example.
Trend Line Strategy Trading Rules
Long Setup
- Draw a trend line by connecting a swing low with a higher swing low.
- Wait for a trend line break. A trend line break signals that the market is approaching the limits of its brief push against the trend. (i.e., oversold)
- Use a price pattern as a trigger. Here, we will use the reversal bar pattern. Place your entry order as a stop order just above the reversal bar.
- Put your stop-loss order a tick below the low of the reversal bar.
- Place a sell limit order to take profit at the last trend extreme. (i.e., the highest price reached before the current pullback)
Short Setup
- Draw a trend line by connecting a swing high with a lower swing high.
- Wait for a trend line break.
- Use a bearish reversal bar pattern as your trade trigger. Place your entry order as a stop order just below the reversal bar.
- Place your initial stop-loss a tick above the high of the reversal bar.
- Place a buy limit order to take profit at the last trend extreme.
You can look for other bar patterns or candlestick patterns as trade triggers. But for simplicity, we will focus on the reversal bar here.
What is a reversal bar?
A bullish reversal bar:
- Trades below the low of its preceding bar
- Closes higher than the closing price of its previous bar
A bearish reversal bar:
- Trades above the high of its preceding bar
- Closes lower than the closing price of its previous bar
For the examples below, we will stick to the trading rules listed above.
After the examples, you’ll find a section that delves into possible enhancements.
Trend Line Trading Examples
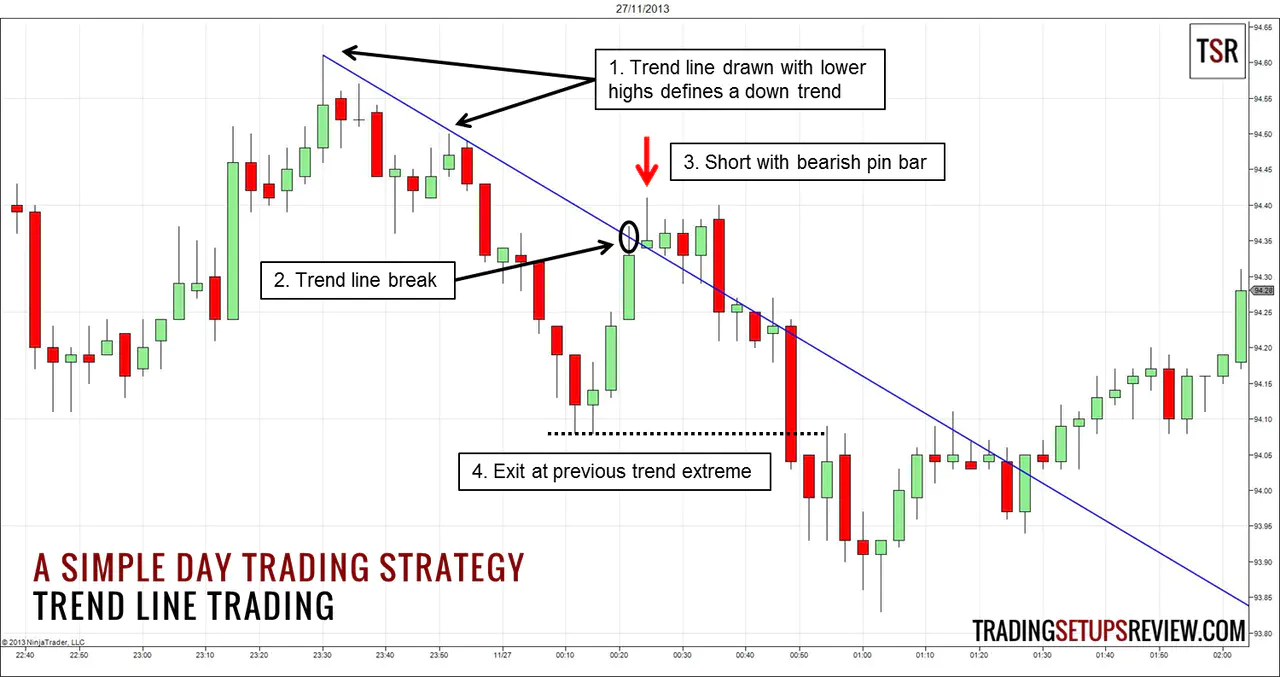
Trading Example #1: Trend Line Swing Trading
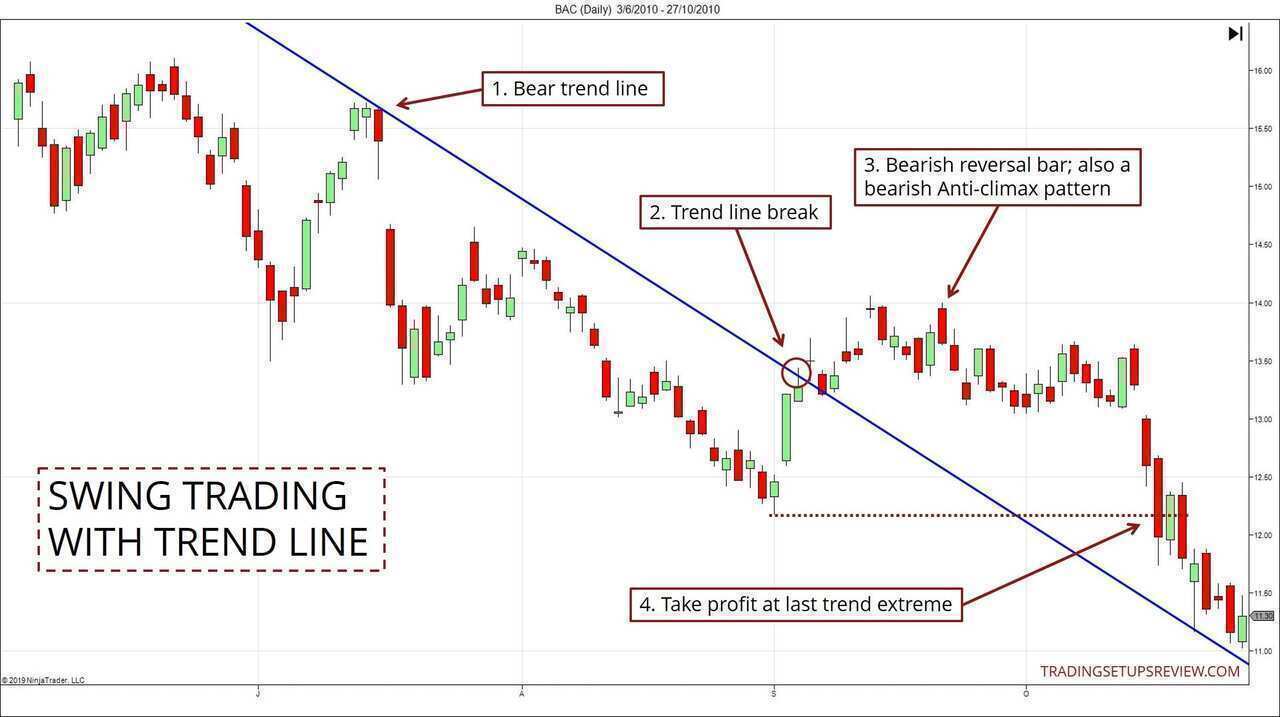
- This is the second pivot of the bear trend line. The first pivot is not shown.
- Here, the market rose and broke the trend line. While aggressive pullback traders might go short here, our trading rules demand patience.
- A bearish reversal bar trades higher than the preceding bar, before closing lower. This reversal bar was also a bearish Anti-Climax pattern. Hence, it was a reliable trade trigger.
- Use a buy limit order here to take profit at the last trend extreme.
Trading Example #2: 4-Hour Forex Trading
This example comes from a 4-hour chart of the GBPUSD currency pair.
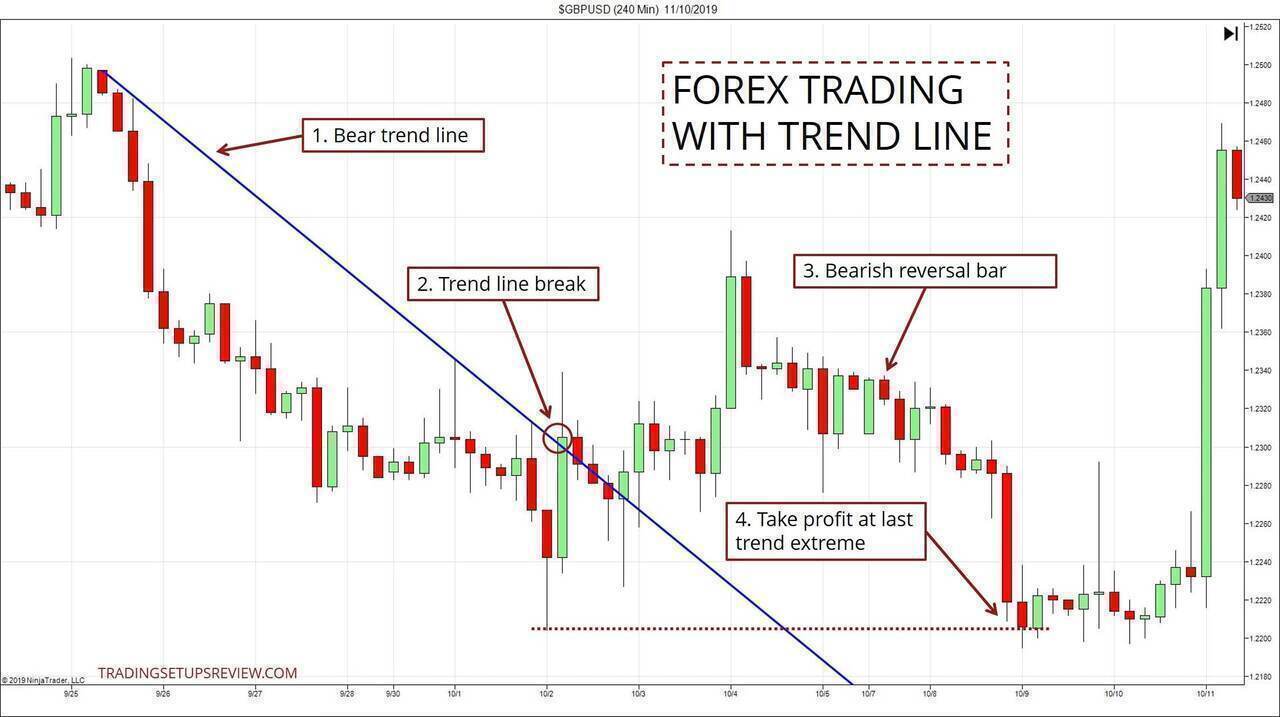
- This bear trend line tracked the market bias. With a bear trend line in place, we were waiting for a trend line break.
- A sharp reversal broke the trend line. It was a signal to look for bearish reversal bars to trigger our continuation trade.
- We placed our sell stop order below this bearish reversal bar. Recall that our initial stop-loss would be above this bar. Given that this bar has a narrow range, our trade risk was relatively small.
- We took profit at the last trend extreme. Note that the market reversed sharply soon after we grabbed our profits.
Trading Example #3: Day Trading FDAX With Trend Line
This example shows the 3-minute chart of the FDAX futures.
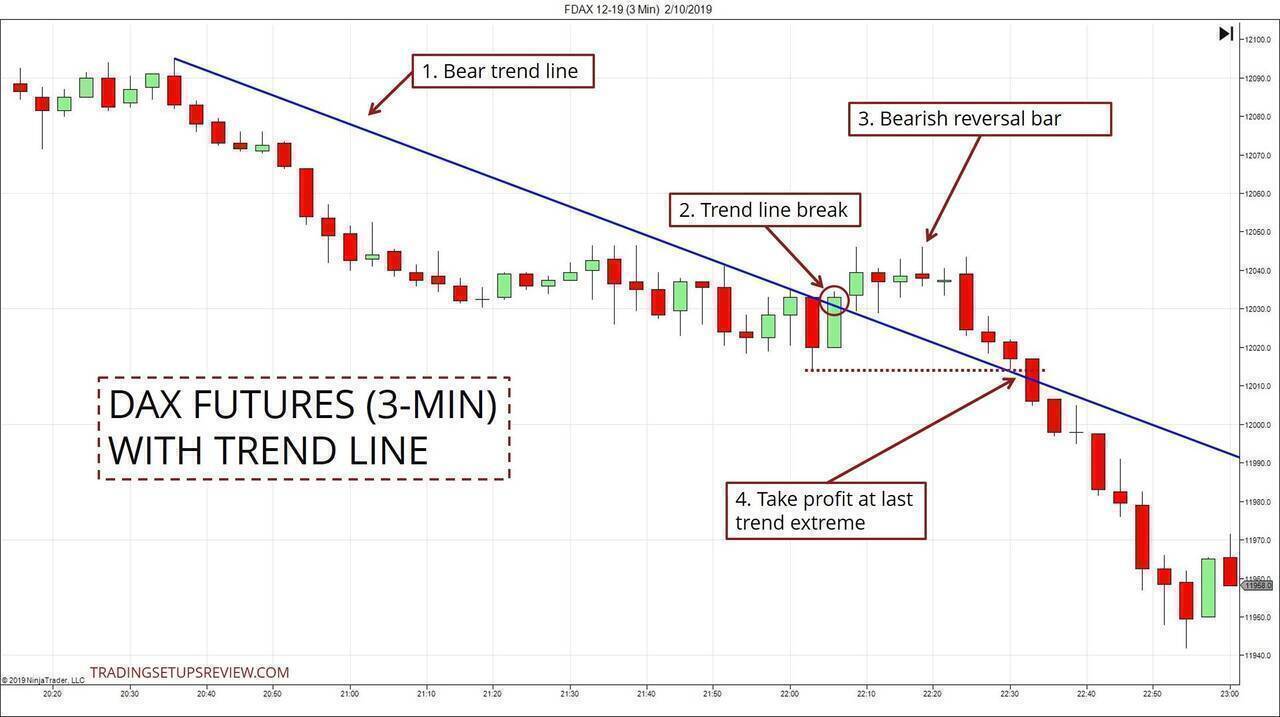
- This bear trend line was tracking the market bias.
- As the market started congesting, price bars got entangled with the trend line. This bullish trend bar broke our trend line, albeit by a small range.
- This bearish reversal bar was also a Pin Bar. It was an acceptable short trade trigger.
- We took our profit at the last trend extreme.
Despite the winning outcome, you must’ve noticed that we missed out on considerable profits.
This example is in stark contrast to Example #2, in which the last trend extreme offered the perfect exit.
So should we have allowed our profits to run?
More on this in the next section.
Trading Example #4: A Loser
After three wins, it’s time for a reminder that profitable trades are never guaranteed.
Let’s review a losing trade below.
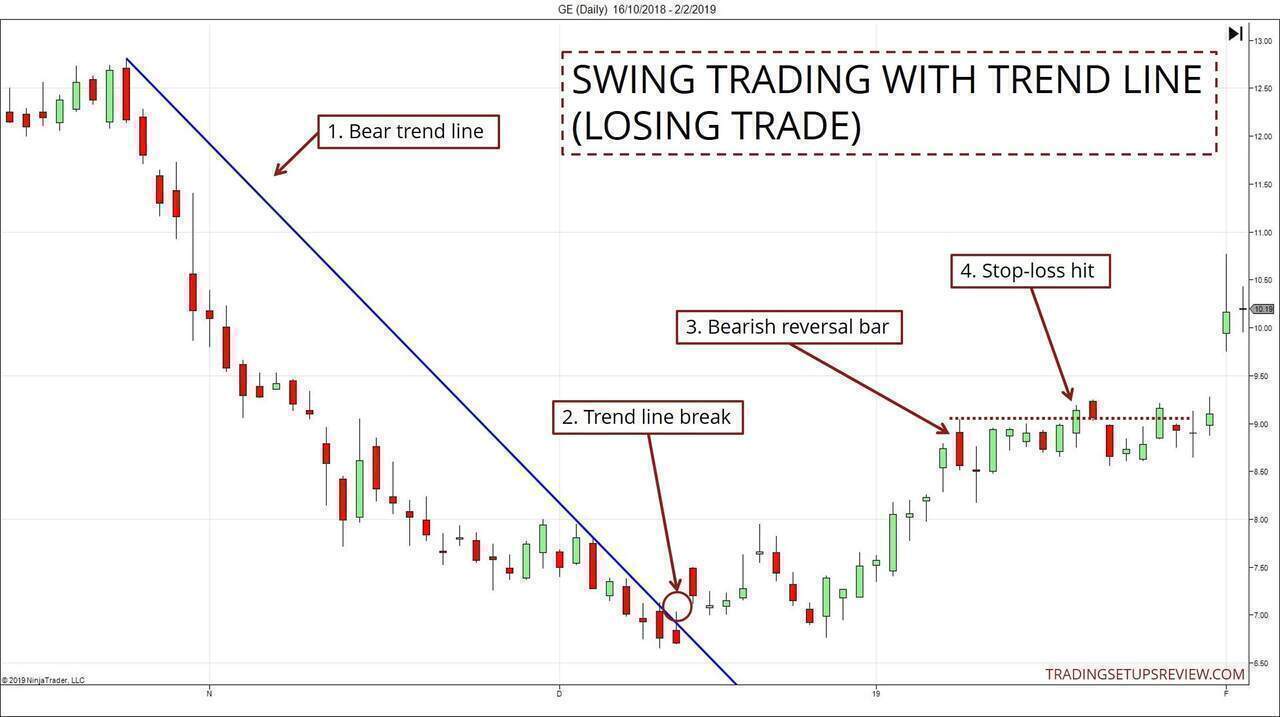
- The first anchor of this bear trend line was just before the market’s plummet.
- The first bar that broke the trend line was hardly dramatic. But the price action that followed showed bullish momentum. (e.g., the streak of eight bullish bars)
- A bearish reversal bar formed here. And the next bar triggered our sell stop order.
- The market did not move much in our favor. Eventually, it hit our initial stop-loss placed above the bearish reversal bar.
(Note for course students - The pullback in this example formed a valid low, which is a mark of bullish market structure. This formation was not found in the three winning cases above.)
Trend Line Strategy In-Depth Discussion
In this section, we’ll discuss two aspects of this simple trend line approach.
- Drawing Trend Lines
- Taking Profits
Trend Line Drawing Framework
We used a trend line break as an oversold/overbought signal to start looking for pullback trades. Clearly, trend lines are critical to this strategy.
Hence, a natural question is:
How do we draw trend lines?
Drawing trend lines can be as straightforward or as complicated as you want it to be. It all boils down to how you define price swings as that will affect the swing pivots you link up to form the trend line.
It is dogmatic to claim that there is only one way to draw trend lines.
But you must avoid drawing trend lines inconsistently.
Inconsistency is commonplace when traders study historical charts manually. It’s effortless to draw perfect trend lines ex-post. However, you are unlikely to be able to replicate them in real-time analysis.
For consistency, create a framework for drawing trend lines objectively. For instance, in the examples above, I drew the trend lines according to the valid pivot concept taught in my price action course.
(Note to course students - For more trading opportunities, you can use basic pivots to draw the trend lines as well. But make sure to check for an acceptable reward-to-risk ratio.)
Profit-Taking Approach
You might think that our profit-taking strategy is not optimal as it leaves too much money on the table.
That is true. So please feel free to experiment with other exit tactics.
However, there is a good reason for choosing the last trend extreme as our profit-taking level. Understanding the rationale will help you appreciate the idea of a strategy’s internal consistency.
Recall that our trading premise is trend resumption.
This premise underpins all trend continuation trades (pullback/throwback trades). We are assuming that the trend will resume; if not, we will not even consider taking a position.
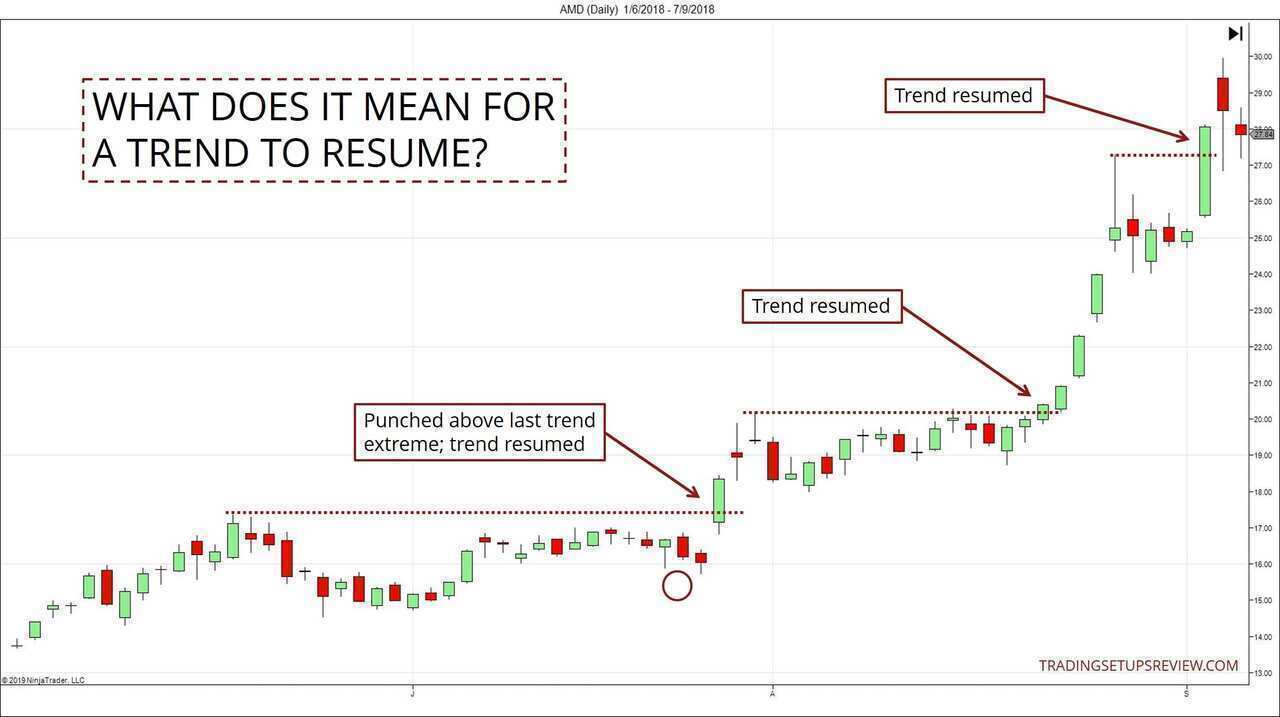
What does it mean for a trend to resume?
It means that it has moved passed its last trend extreme. If it could not even make it past the previous trend extreme, the trend has failed to resume.
Hence, in theory, the last trend extreme is the most conservative target for trend pullback trades.
- If you aim for a smaller target, you are not consistent with your premise for continuation trades.
- If you go for a further target, the probability of the market hitting the target will fall. (Look at Example #2. Aiming further would not have ended well.)
Of course, the trade expectancy can be higher despite placing a target beyond the last trend extreme. If that is your market assessment, go ahead with it.
In any case, the last trend extreme offers a solid starting point for profit-taking.
On top of that, it also bears a practical advantage. With a static and reliable profit-taking level, the reward-to-risk ratio is apparent. Hence, you can quickly assess the expectancy of each trade.
Conclusion and Further Resources
Although this strategy is simple, it offers an excellent start for trading with trend lines. It also serves as a gateway for formulating a consistent and simple trading system.
Finally, I’ve compiled a list of resources for anyone hungry for more trend line trading ideas.
Trend Lines Articles
- Swing Trading With Trend Lines
- ChartSchool Trend Lines Reference
- John Hill’s Trend Line Theory - a unique trend line trading strategy
Channel Articles
Channels are an extension of trend lines. Once you’ve mastered trend lines, moving on to channels is the natural progression.
- Simple Channel Trading
- Exiting Momentum Trades With Channels
- Trading Pullbacks With Trend Lines and Channels
Have fun charting!