Three-Bar Inside Bar Pattern
By Galen Woods ‐ 8 min read
The Three-Bar Inside Bar Pattern is an impressive trade setup by Johnan Prathap. It combines three trading concepts in one to create a winning pattern.
Price patterns have endless possibilities. Once you grasp the fundamental concepts of price action trading, a natural progression is to re-interpret classic bar patterns. That’s precisely what Johnan Prathap did in the Technical Analysis of Stocks and Commodities (March 2012 issue) by introducing the three-bar inside bar pattern.
Introducing The Patterns
Since this approach seeks to enhance the inside bar, let’s recap this basic pattern before moving on to the main star of this guide.
Inside Bar
This is how a standard inside bar looks like.
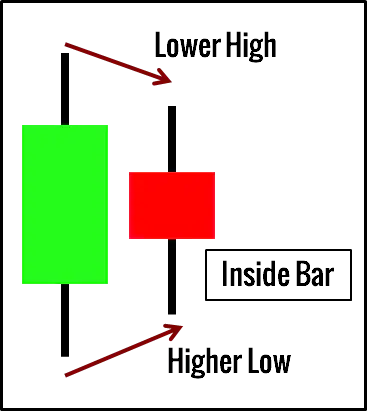
Its range is entirely within the preceding price bar. Simple.
Three-Bar Inside Bar
This is how a _bullish _three-bar inside bar pattern looks like.
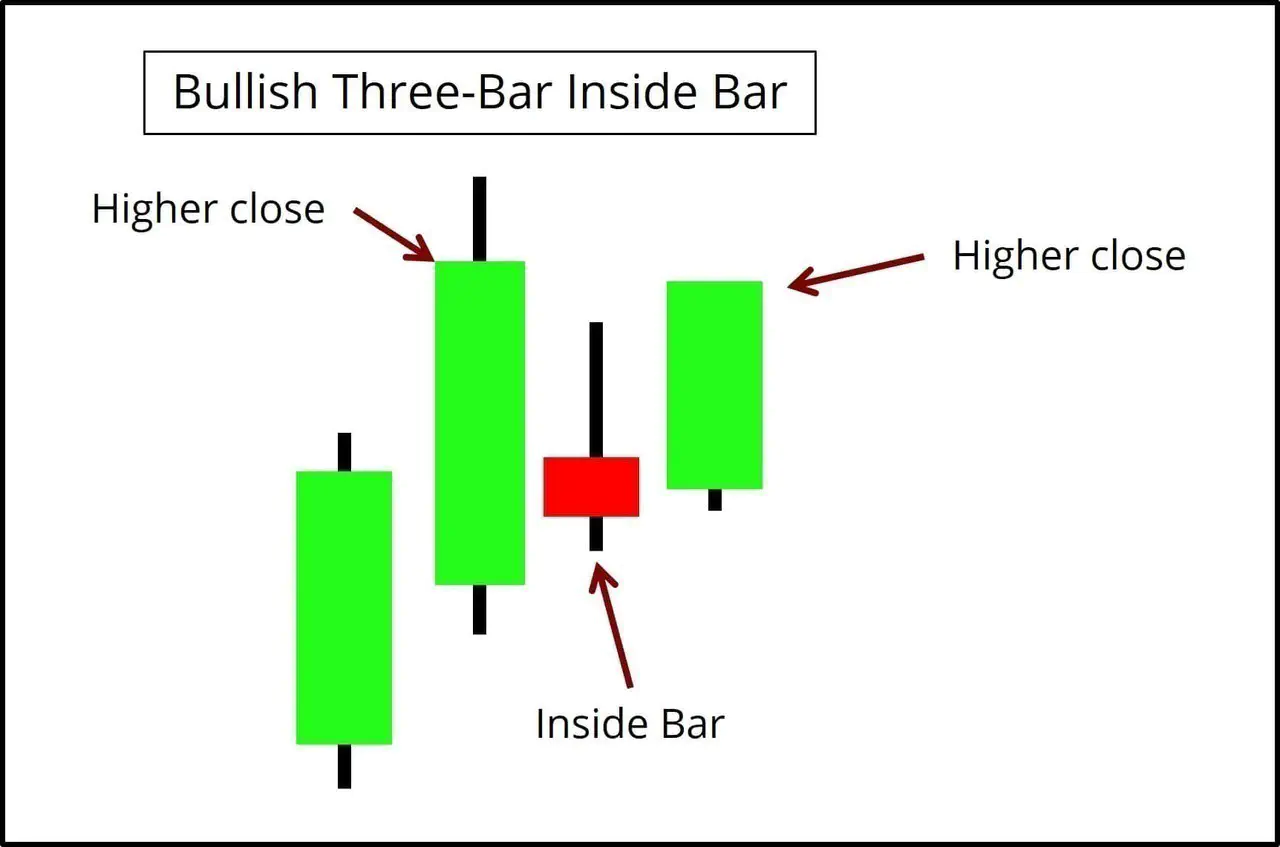
Just a few points to note, and we are good to go.
- A higher close means a bar close is higher than the closing price of the previous bar. In a nutshell, we compare the current close to the last close.
- Look for an inside bar, and if it is surrounded by bars with a higher close, we got a bullish pattern.
- Conversely, if an inside bar is surrounded by bars with a lower close, that is a bearish pattern.
Take a moment and ponder on the design of the three-bar inside bar pattern. Essentially, it enhances the standard inside bar break-out trade by adding:
- A trend context; and
- A follow-through confirmation.
Trading Rules For Three-Bar Inside Bar
Once we know how to spot three-bar inside bar patterns, its trading rules are straightforward and focus on the closing prices of the bars.
This pattern requires three price bars, and the criteria for each of them are listed below.
Bullish Pattern for Long Entry
- Higher bar close (right before an inside bar)
- Inside bar
- Higher close (right after the inside bar)
The standard entry is to buy at the close of the third bar.
Bearish Pattern for Short Entry
- Lower bar close (right before an inside bar)
- Inside bar
- Lower close (right after the inside bar)
The standard entry is to sell at the close of the third bar.
Three-Bar Inside Bar Trading Examples
In the examples below, we study the pattern through various trading timeframes and in markets from around the world.
Example #1: Winning Trade
This example shows a weekly chart of the Straits Times Index, the barometer of the Singapore Stock Exchange.
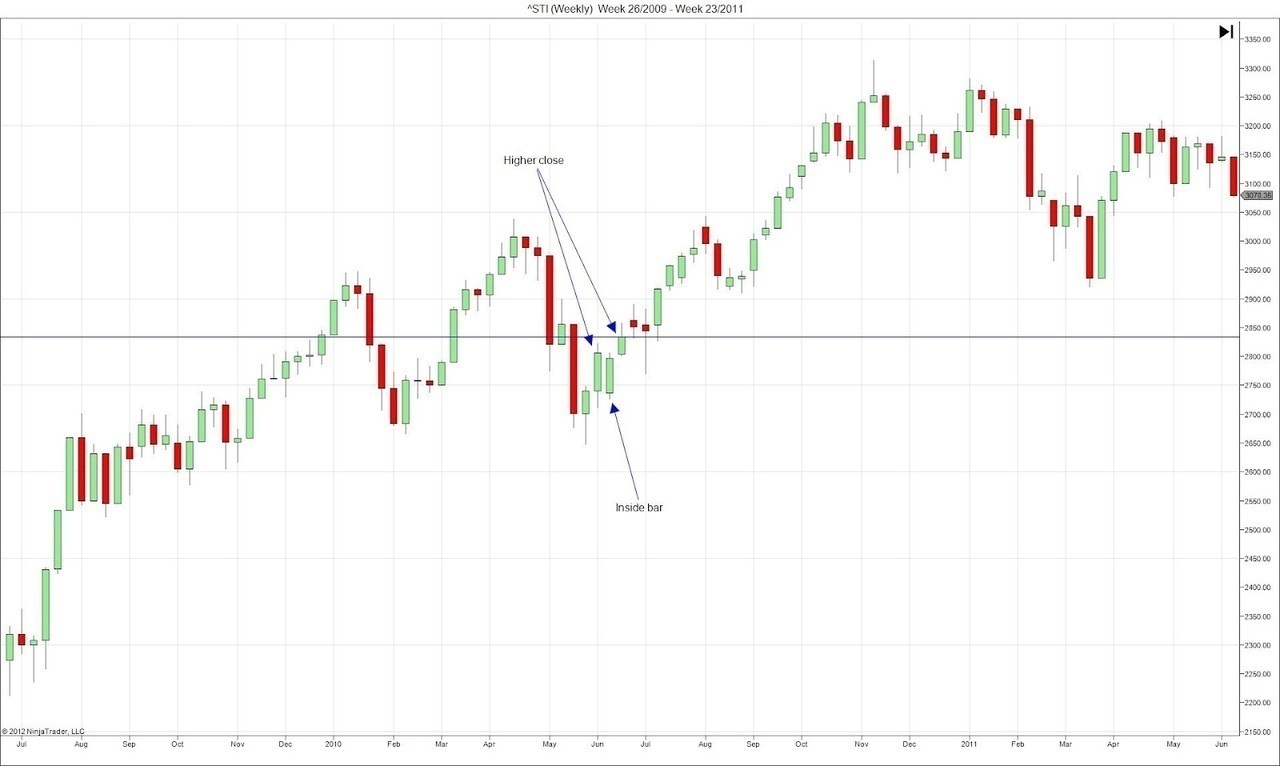
- We observed a higher bar close followed by an inside bar pattern. The market then broke above the inside bar before ending with a higher close. This met our trading rules, and we made a long entry together with the second higher close.
- The blue horizontal line marks out the entry price. After our entry, the market continued its upward trend.
- Look at the two long bearish bars in the downswing before our setup. They showed that the market made two serious attempts to go lower. However, the price found support at the previous swing low and formed a bullish reversal bar just before our setup. Hence, the context was great for long positions.
- Moreover, the inside bar gapped down before trading up to finish the week as a bullish bar. That was as bullish as an inside bar could get. This also means that all three bars of the pattern were bullish, which is not always the case, even for bullish patterns.
Example #2: Comparing Patterns
This chart shows the 4-hour candlesticks of the EURUSD spot market.
I applied the Price Action Pattern Indicator to mark out the three-bar inside bar patterns, with the trend filter disabled. The arrows point out two bearish patterns and one bullish pattern.
Recall that the last bar of the pattern serves to confirm the inside bar breakout. Thus, in our analysis below, we will compare the last bar of each pattern to assess their quality.
To be clear, the arrows in the chart below point to the last bar of each three-bar inside bar pattern.
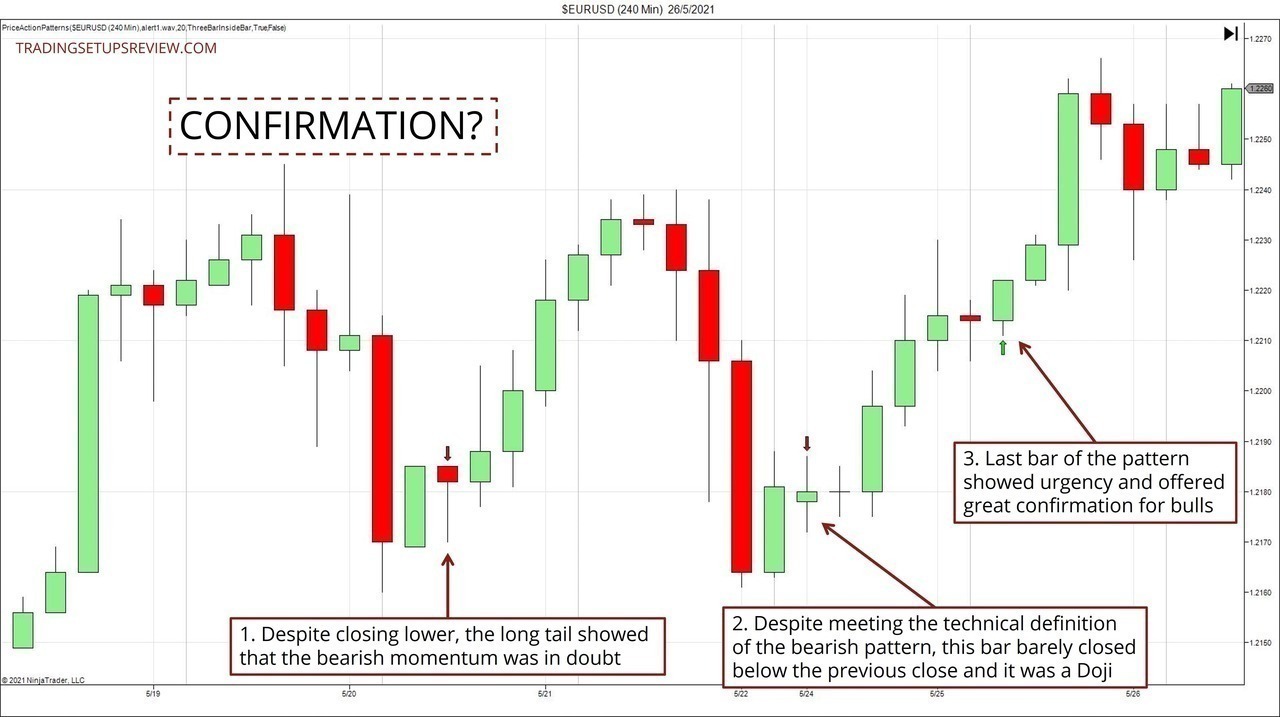
- Despite closing lower than the inside bar, this bar did not confirm the bearish momentum. Instead, its long lower shadow was a bullish hint.
- This second instance again met the technical definition of the three-bar inside bar pattern. However, if you look at the last bar of the pattern, it was a Doji and again did not confirm the bearish momentum.
- This bullish pattern was different. Its final bar closed above the entire inside bar and confirmed the urgency of the bullish breakout. Hence, it led to a much better trade outcome compared to the bearish patterns.
This example shows the value of examining a pattern manually with its underlying concepts in mind. While it’s helpful to mark out price patterns with the help of software, it’s crucial to analyze them manually for more insights.
Based on the observations above, we might want to update our criteria to look for a more aggressive final bar. One idea is to demand that the breakout bar closes beyond the range of the inside bar.
Example #3: Losing Trade
This example shows a daily chart of Vanguard’s REIT Index ETF listed on the NYSE.
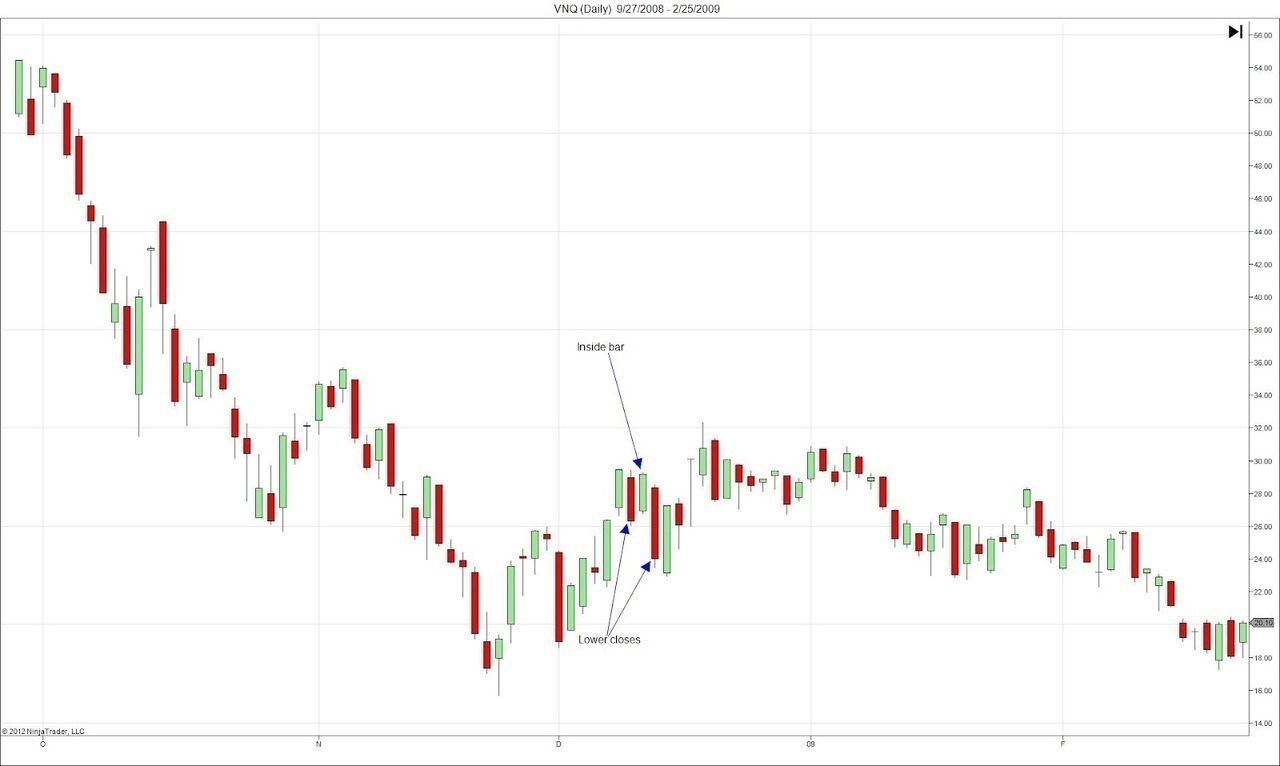
- It shows a bullish inside bar pattern after a lower bar close. The lower close after the inside bar completed the pattern, so we went short at the close of the day.
- Unfortunately, the market went against us the next day and proceeded to take out the high of this pattern, which was the level of the typical pattern stop.
- As this was a short setup, the existing bear trend was advantageous. Although this upwards pullback was complex and retraced more than previous pullbacks, the trend was still pointing down. Hence, looking for shorts was reasonable.
- However, the bullish inside bar was a warning to us. Look at the two bars before and after the inside bar. Notice that the bar polarity was alternating. Some choppy trading was definitely going on, and whipsaws were possible.
We got the market bias correct in this trade, but the exact timing and stop-loss were wrong.
If we had implemented the setup differently with a wider volatility stop, it would have been profitable as the market proceeded to fall after hitting the high pattern. (Alternatively, a re-entry approach would work here too.)
Example #4: Importance of The Market Context
The chart below shows the daily prices of McDonald’s Corp (MCD on NYSE).
In this example, we highlight the market context that contributed to the quality of this setup. Figuring out the market context is always crucial when it comes to trading with price patterns.
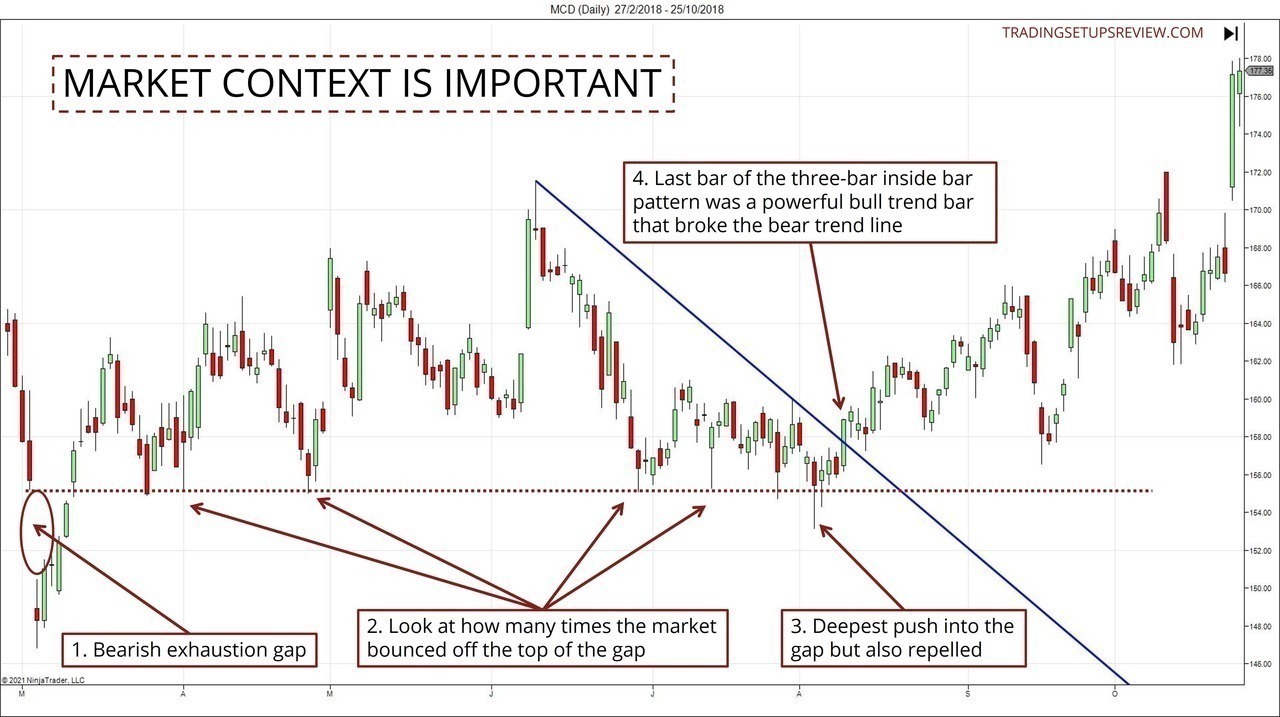
- This bearish gap exhausted the bear market, and prices rose immediately after the gap.
- The gap turned out to be an excellent support zone. Look at the numerous instances of the market bouncing off the top of the gap.
- This bar was the deepest push into the gap support zone, but it was quickly repelled.
- Not only that, it led to the formation of a bullish three-bar inside bar pattern. In particular, the last bar of the pattern was a robust bullish trend bar and broke the bear trend line decisively.
This context here was excellent for long setups, as the market verified the prowess of the gap as a support zone.
(Course notes: The bear trend line in this example was drawn with the first valid high since the exhaustion gap. This short-lived bear trend line was good news for the bulls. This concept is elaborated in Volume 2, Chapter 5.2.5.)
Conclusion - Three-Bar Inside Bar Pattern
The three-bar inside bar pattern enhanced the conventional inside bar pattern. It is impressive as it combined three trading concepts.
In the context of a bullish pattern:
- Making sure that the trend is your friend with the first higher close.
- Finding a pullback and decreased volatility with the inside bar.
- Confirming the breakout with the last higher close.
This trade setup serves to illuminate these concepts. These ideas are helpful not just for this setup but for assessing any trading strategy.
For these reasons, this pattern has a good recipe. However, as we saw in the examples above, it does not guarantee profitable trades. For a setup to work out, the market bias and the entry/exit tactics are crucial as well.
If you want to be more selective, consider:
- Paying attention to the inside bar. Broadly speaking, a bullish inside bar is better for a long setup, and a bearish one is better for a short setup.
- Looking for the third bar to close beyond the range of the inside bar.
It is common to add more rules to the pattern to reduce the number of losing trades. However, don’t get obsessed with it, or you might fall into the trap of the Holy Grail search.
Ultimately, there is no perfect price pattern. Instead, each profitable price action trading strategy results from a consistent trading plan with many moving parts that work well together. These parts include the price pattern, the entry method, exit methods, and the market bias analysis.
More resources
This three-bar inside bar pattern is not the only pattern designed with the inside bar as its basis. Check these out:
To automatically plot the three-bar inside bar pattern, these links might be helpful:
The article was first published on 13 May 2012 and updated on 15 July 2021.