Bull Flag Price Action Trading Guide
By Galen Woods ‐ 8 min read
The bull flag price pattern is a popular continuation pattern. Learn a set of guidelines to help you identify the ideal bull flags to join a rising market.
The bull flag is a classic price action pattern for trading pullbacks. You’ll find it on every list of essential chart patterns. And over time, it has evolved from a rigid pattern form into a trading concept.
If you search online, you will find that the examples of bull flag patterns are varied. Some show deep pullbacks with multiple legs, while others are shallow with just a few price bars.
Many traders use it as an encompassing label for any bullish continuation pattern. (Like wedges, pennants, rectangles, etc.)
So you might be confused when searching for trading examples to learn more about bull flags.
Fortunately, labels are not critical. As you gain experience, you’ll find that there’s no need to be pedantic over the form of a chart pattern and what to call it.
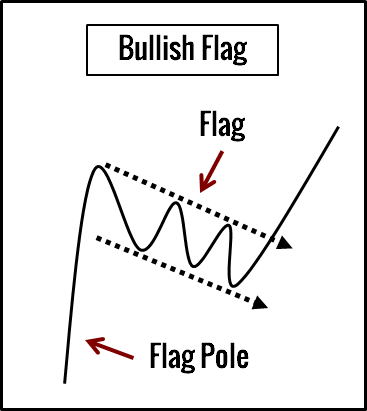
Nonetheless, there are three principles that bull flags tend to follow:
- There must be an existing bull trend.
- It is possible to draw a credible counter-trendline along the top of the bull flag.
- The bull flag does not retrace so much that it casts doubt on the bullish market structure.
Based on these principles, I’ve designed a set of guidelines to find bull flags systematically.
Identification Guidelines for Bull Flags
Note: The bull flag guidelines here are more specific than those in this chart patterns guide, which offers a broad overview.
Guidelines for ideal bull flags:
- The market must be above the 20-period exponential moving average (EMA).
- The pullback must form at least one swing high on its way down.
- No price bar should form a bar high that is below the 20-period EMA.
Mostly, we are less concerned with the exact shape of the flag and more concerned with the:
- Strength of the trend
- Feasibility of pinpointing a breakout point
- Degree of the pullback (shallow or deep)
Trading Guidelines For Bull Flags
After you identify a bull flag, how do you trade it?
Here are a few guidelines to get you started:
- Buy when a candlestick closes above the counter-trendline. We use this to confirm a bull flag breakout.
- If a bar breaks above the counter-trendline but closes below it, adjust the line to accommodate the break as the pullback continues. (The line will become shallower.)
- Place a protective stop order just below the nearest swing low.
- Project a target using the thrust before the bull flag. You can start the projection from the base of the flag or the breakout point.
Guidelines, Not Rules
Remember that these are guidelines.
While they provide an excellent starting point, there will be instances when you can consider ignoring these guidelines. But be prepared to justify any deviations.
For a realistic study, we will look at not only bull flags that conform to our guidelines, but also those that do not.
Bull Flag Trading Examples
Example #1: Stock Swing Trading
Let’s use the first example to illustrate the trading guidelines.
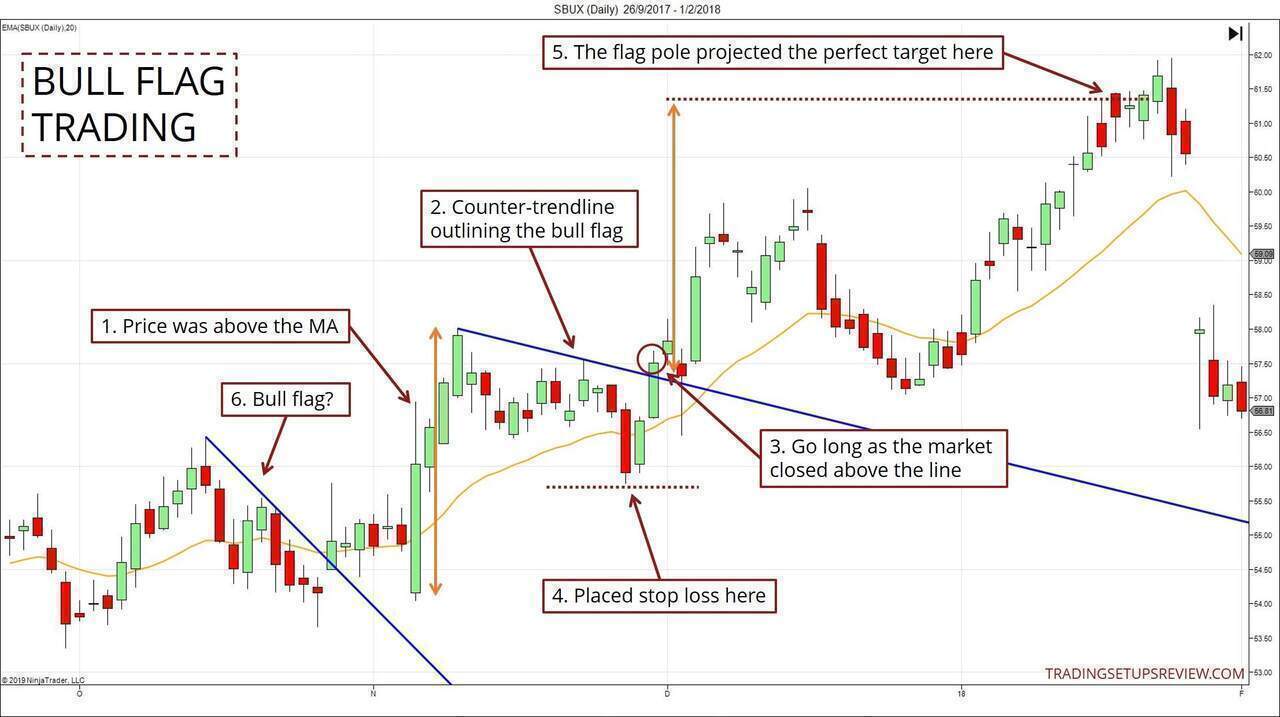
- The market was above the 20-period EMA, meeting our technical bullish bias rule.
- Swing highs formed as the market pulled back down. With this swing high, we drew a counter-trendline to outline the top of the bull flag.
- This bullish day close was our signal to go long.
- We placed a protective sell stop order here, just below the most recent swing low.
- You can project a price target with the bull flag using the thrust that precedes it (flag pole). Look at the orange markers above.
- Is this a bull flag? The pullback formed bars entirely below the EMA. So it does not fit our identification guidelines.
Should we exercise discretion here and ignore guidelines?
Although the flag breakout led to a bull run, I would not.
The EMA guideline guards against pullbacks that cast doubt on the bullish market bias. Here, the pullback indeed retraced a large part of the bullish thrust preceding it. The market bias became unclear at that point.
Example #2: Bitcoin Swing Trading
The field of crypto-trading is quickly adopting tactics from technical analysis. The influence flows both ways. Hence, many traders are looking to cryptocurrencies for more opportunities too.
Here is a BTCUSD example showing two instances of the bull flag chart pattern.
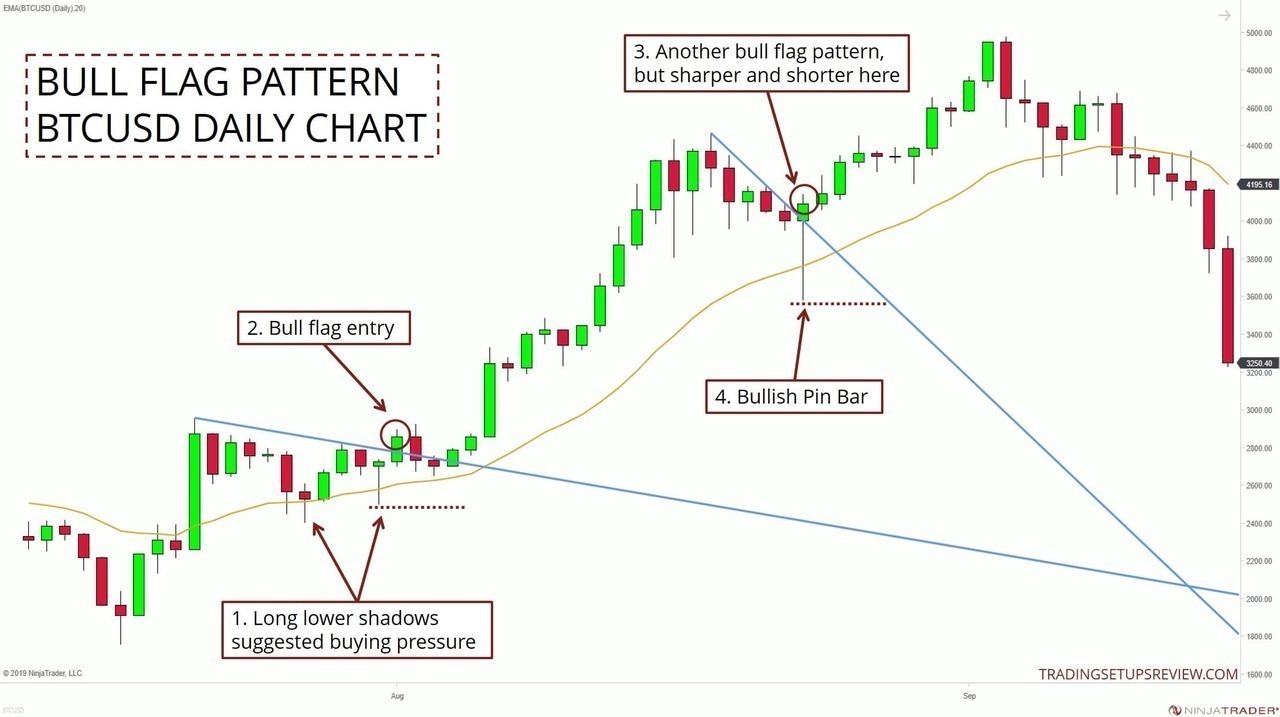
- In the first bull flag pattern, there were long lower shadows at the bars ending each bearish leg. They suggested buying pressure.
- This bar close was our entry signal. You could place a stop-loss at the most recent swing low as marked out by the dotted line.
- This second bull flag pattern had a different form. It was a sharper pullback and is made up of fewer bars. Nonetheless, it also met our bull flag identification guidelines.
- Moreover, its entry bar was a fantastic bullish Pin Bar. The low of this Pin Bar was our stop-loss level.
Consider the second bull flag pattern in the chart above.
Different traders might identify the flag pole differently. Hence, the projected target differs.
But regardless of which length you use to project the target, the market would have fallen short. An important lesson lies here.
The projected target from a bull flag serves only as a reference. Do not use it blindly.
While you can consider it for setting an initial target order, stay flexible when it comes to taking your profits.
Example #3: Intraday Bull Flags With A Losing Trade
This example shows the 3-minute chart of the DAX 30 futures.
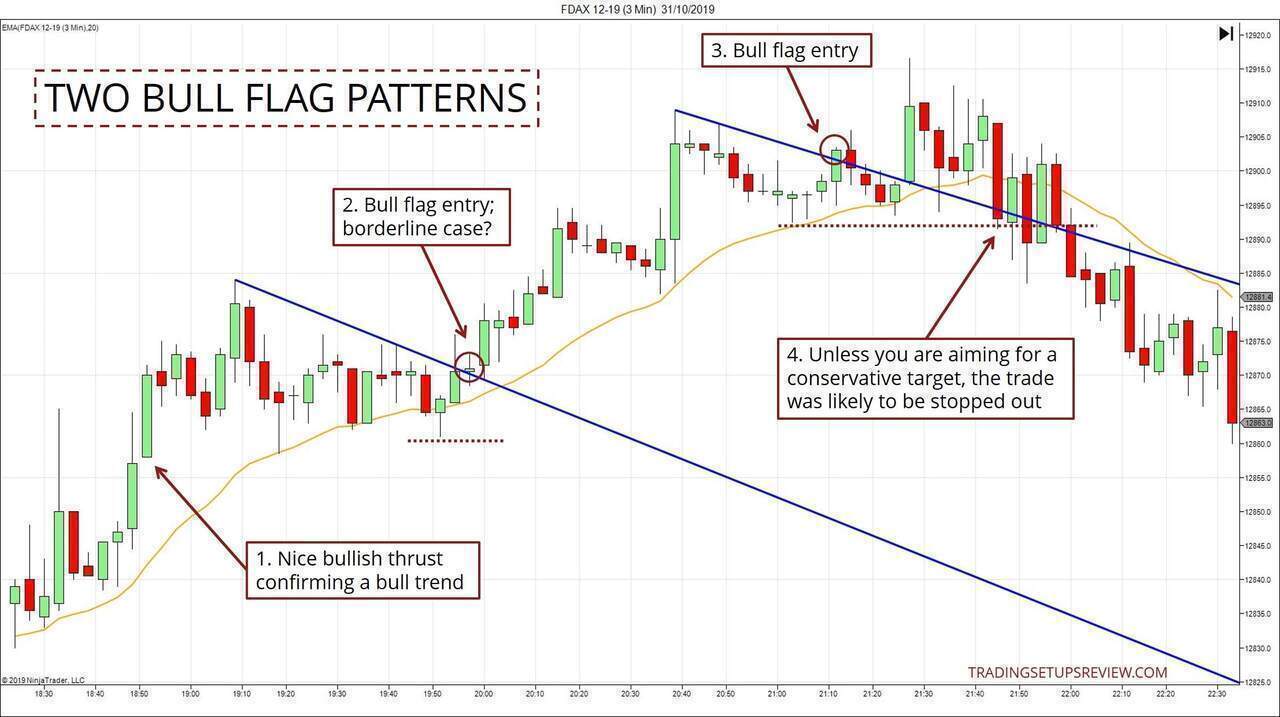
- The market bias is critical. The more confident you are of the bullish bias, the more likely you would trade a bull flag breakout. This thrust confirmed the bullish trend.
- This bar had a narrow range and barely closed above the counter-trendline. Some traders might wait for the following bar to close above the line before buying.
- This bar marked the breakout of the second bull flag. Although the market fell after the entry, the initial downswing did not hit our stop-loss.
- However, unless you aimed conservatively, or acted nimbly to exit, this trade was likely to end in losses.
No price pattern is perfect.
Here, if you had traded both bull flag breakouts with sound risk management, you could still end up in the green.
But it’s just as easy to lose control of your trade management process and end up with a net loss.
This is why price patterns and entry points are not the only determinants of your trading performance. What is critical is how your entire trading plan comes together.
Example #4: Bear Flag Pattern
For clarity and ease of understanding, this trading guide focuses on bull flags.
But after the examples above, you should be familiar with our bull flag guidelines. So you can apply the same concepts to identify bear flags.
Simply invert the rules. For instance, now you need to look for swing lows in the pullback up instead of swing highs.
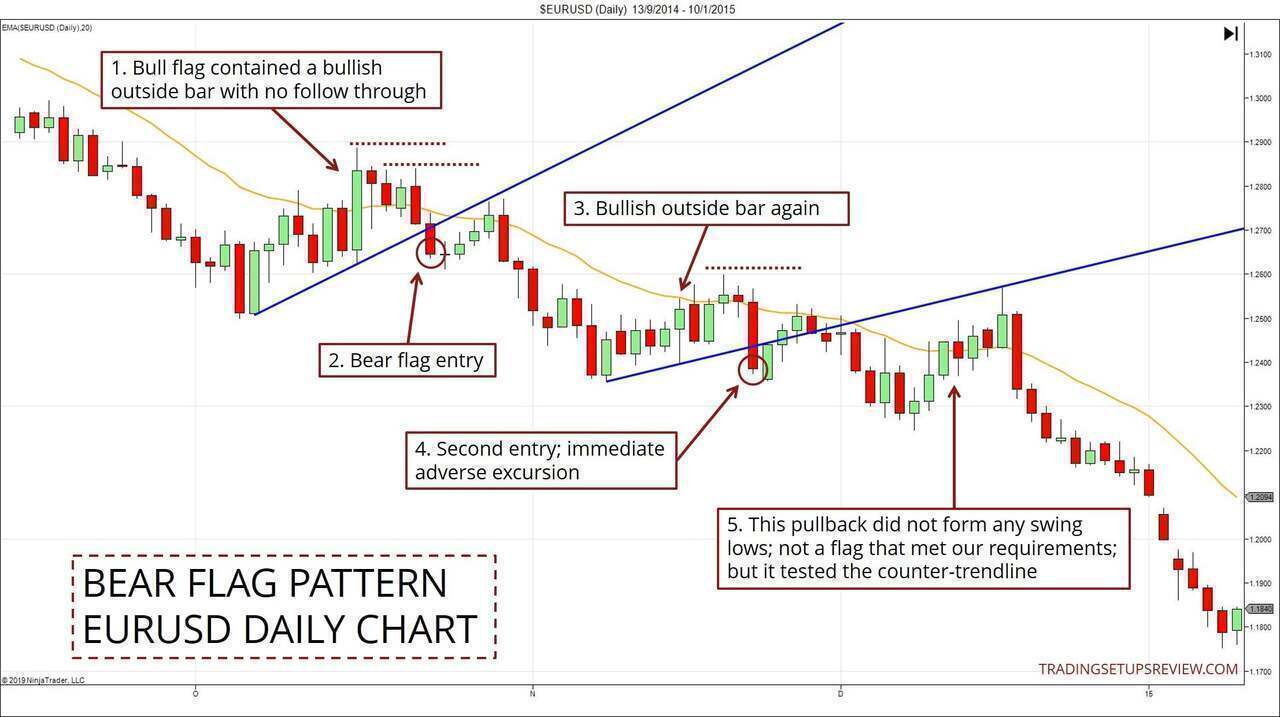
- This bear flag met our requirements. The bullish outside bar was noteworthy as the market failed to push past it. It boded well for the eventual bear flag breakout.
- The close of this bar was the bear flag entry signal. There were two pattern stop-loss levels available.
- The second bear flag contained a bullish outside bar too. It broke out of a minor congestion zone (which lasted five bars). But it failed to push the market higher. It was an outside bar failure.
- This bar closed below the counter-trendline and offered a short signal. However, the market rose for several days right after the entry. This phenomenon is common. This is why our trading guidelines place the stop-loss at the recent swing high and not the entry bar high.
- This pullback did not form any swing low on its way up. Hence, it did not meet our requirements. However, it was a test of the broken counter-trendline as a resistance. You could trade it, but you need to figure out the exact entry point separately.
Clarification Notes
In this guide, we’ve defined the bull flag pattern broadly. This approach covers generic multi-legged pullbacks.
Hence, we did not distinguish among conventional chart patterns. These formations include triangles, pennants, rectangles, etc.
However, other sources might make finer discussions about these different continuation patterns. S0 here are some nuances and terminology you might find helpful when you encounter them.
Bull Flag vs. Pennant
Flags form a channel with a stable width, but pennants produce narrowing channels (i.e., triangle).
The instances in Example #1 are traditional bull flags. The first instance in Example #3 is more akin to a pennant.
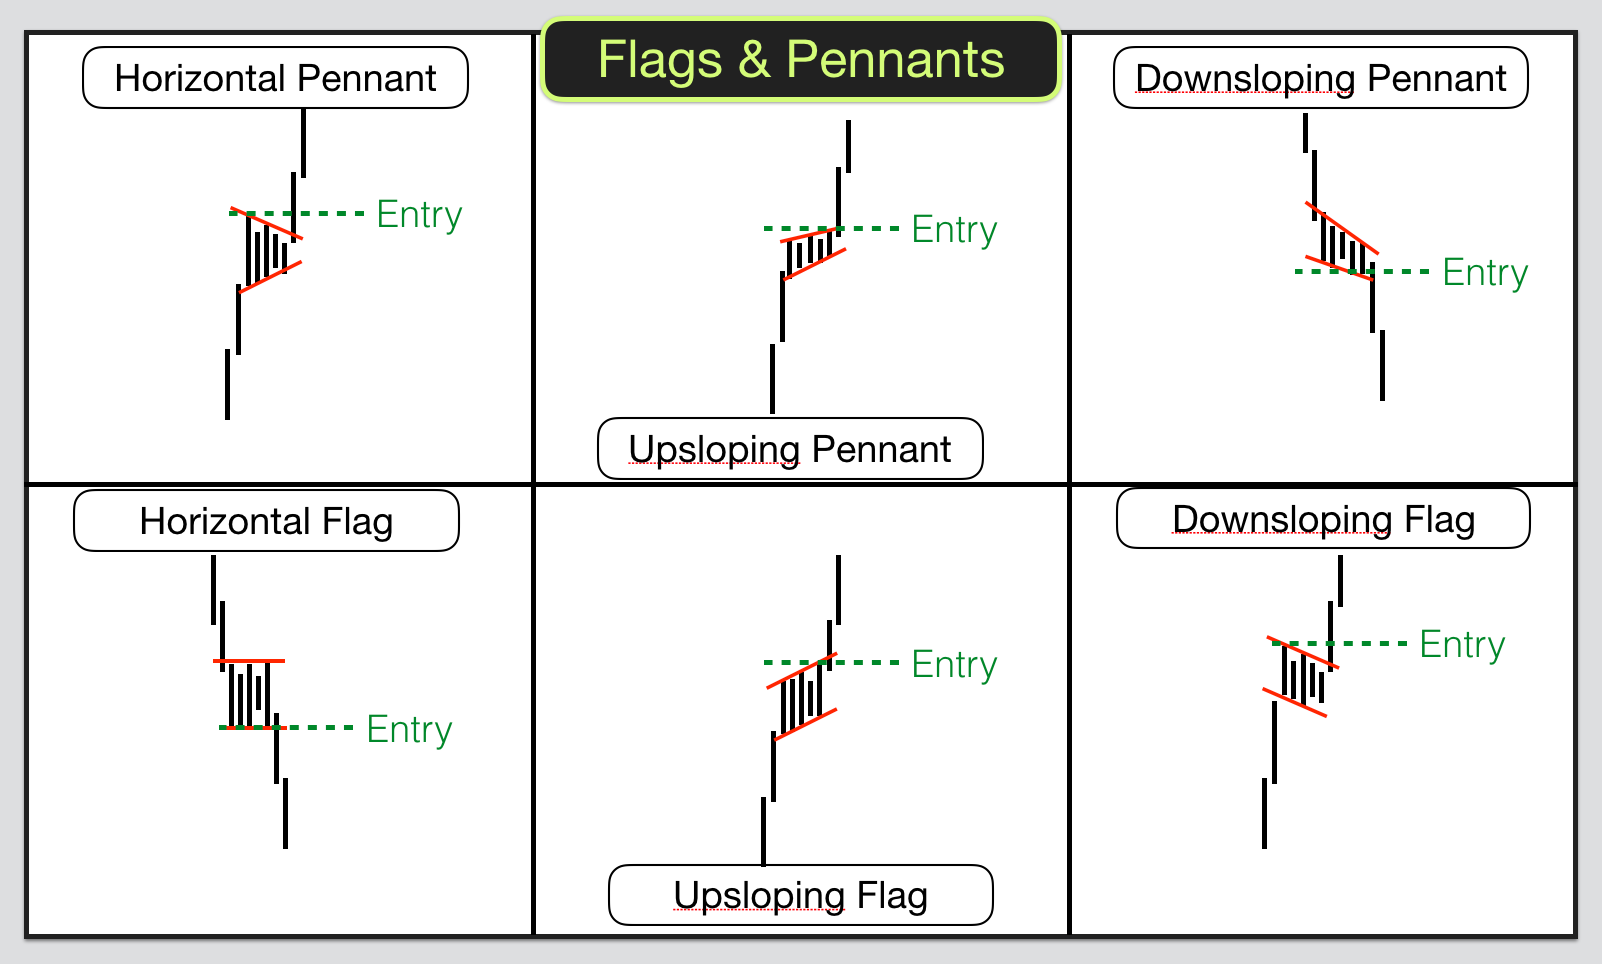
Ascending Bull Flag
This is a particular case of the bull flag in which the line along the top of the bull flag slopes up. We were not looking for such flags.
You can see an example here. (Second row, middle panel)
I avoid ascending bull flags as they usually offer an inferior reward-to-risk ratio.
Conclusion - Bull Flag Trading Guide
Mechanical traders like rigid rules for chart patterns so that they can automate their strategy. Discretionary traders find price patterns based on their experience.
I prefer a hybrid approach. First, I design a systematic way to identify price patterns of interest. Then, I zoom in on the instances to perform discretionary price analysis.
This is the approach we took in this bull flag trading guide.
The simple bull flag guidelines here accommodate a wide range of continuation patterns. Hence, they provide plenty of opportunities for closer analysis.
For instance, in the examples above, we’ve pointed out:
- Pin Bars
- Signs of buying pressure (lower shadows)
- Outside Bar Failures
These observations help us to find the ideal bull flag formations.
Most importantly, the guidelines above are not definitive. Tweak them to form your system of identifying bull flag patterns.
If you want to learn more, check out the articles on related concepts below.
The bull flag strategy in this tutorial is similar to Al Brook’s two-legged pullback approach. However, here, instead of counting the number of legs, we focused on the breakout of the counter-trendline.
Price channels offer another way to evaluate bull flags as many flags fit into counter-trend channels. Such patterns tend to form deeper pullbacks than the ones we reviewed here. Click here for more examples.