The 20-Period Moving Average As Your Only Day Trading Tool
By Galen Woods ‐ 9 min read
Day trading with a moving average is an effective approach for price action traders to pick up intraday trends, pinpoint entries, and manage trades.
Day trading is a fast and furious game with many facets. Hence, the best approach is to keep your trading method simple to ensure effective trading. In this article, rather than adding indicators, let’s look at how to make the most out of a single indicator - the moving average.
You might think that restricting yourself to one indicator limits your analytical options. But less is often more.
For day traders looking for simplicity, mastering one versatile indicator is the way to go. And the moving average (MA) is the Swiss Army knife you want.

In particular, here, we will focus on using a 20-period moving average as a day trading tool for trend pullback trades.
No, 20 is not a magical number. It is also not the best-kept secret among successful traders.
You can use any intermediate lookback period for your moving average when you day trade. Our considerations are:
- A long moving average(e.g., 200-period) lags too much and does not help day traders to be nimble.
- A short moving average (e.g., 3-period) is almost like price itself and adds little to your analysis.
As for the type of moving average, we are going with exponential. But a simple moving average will work fine too.
The key here is consistency. Choose a type and stick to it. Do not keep changing the period or kind of your moving average.
This approach requires you to interpret how price action interacts with the moving average. So employing a consistent moving average is crucial.
We will explore three functions of the moving average:
- How To Analyze Market Context
- How To Find Trade Entries
- How To Trail Stop-Losses (Exits)
#1: How To Analyze The Market Context With A Moving Average
The market context depends on how prices are behaving.
Is price action pushing consistently in one direction? Or is the market bouncing within a price range?
Figuring out the market bias is a crucial puzzle for any trader. And to do that well requires discretion and experience.
Let’s see how a moving average can help here.
Here are some questions to help you clarify price action with a moving average.
- Are prices above or below the MA now?
- How did the market get there?
- Have prices been overlapping with the MA?
- What is the slope of the MA?
- Has the slope been changing often?
With these questions, you can push yourself to analyze price action with respect to the moving average. This approach is excellent for amplifying the effectiveness of a moving average.
Before we move on to the examples below, bear in mind that you should not interpret the answers to the questions above in isolation. You need to integrate them to form a holistic market analysis.
Let’s look at two examples to see how we can do that.
Example #1
This is an example with a 5-minute chart of NQ futures. It shows the first 20 bars of the session.
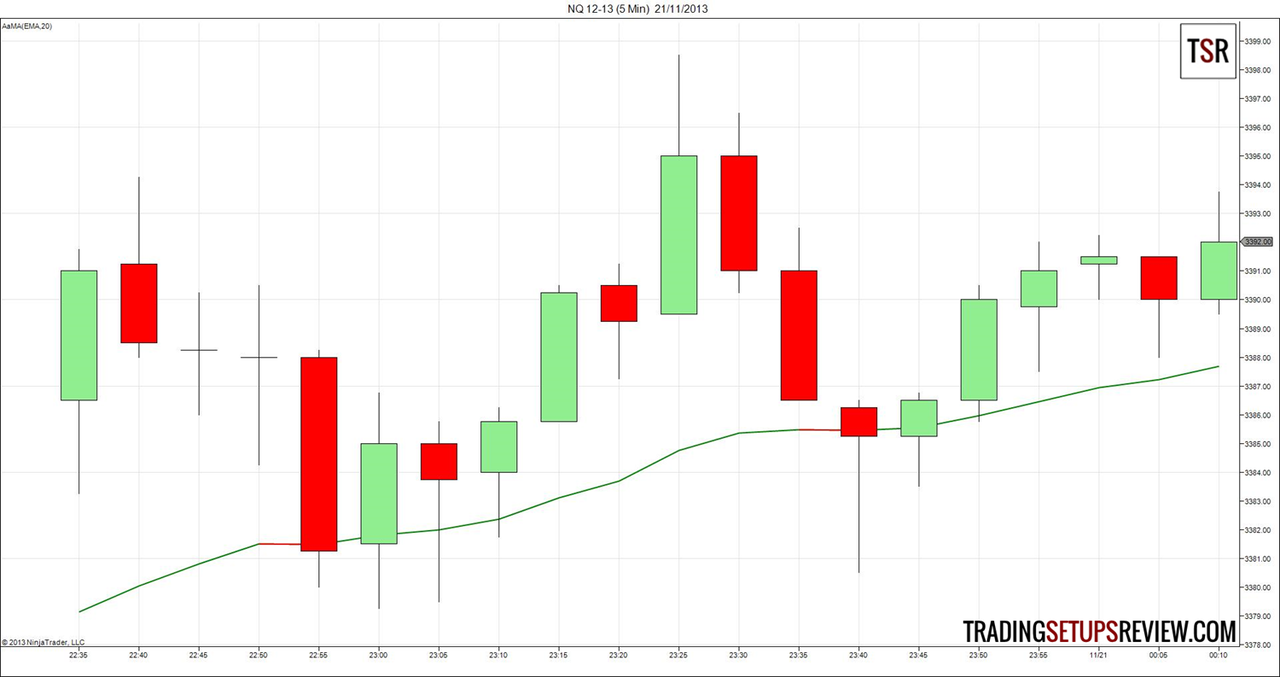
Let’s answer the five questions listed above.
- Price is now above the MA.
- It got there after a bounce off the MA. However, it has not exceeded the last swing high.
- Seven out of the past 20 bars overlapped with the MA. The bars that overlapped had long bottom tails. The bars that did not overlap the MA were all above it.
- The slope of the MA is positive but not overly steep.
- The slope of the MA turned down momentarily at two instances.
Prices were mostly above the moving average and bounced upwards from it. These signs show that the trading session has been bullish.
However, the slope of the moving average was not steep and had turned negative in two instances. So, despite the bullishness, the market was not in a runaway trend.
Example #2
Let’s review another example. This chart shows 20 five-minute bars from the ES futures market.
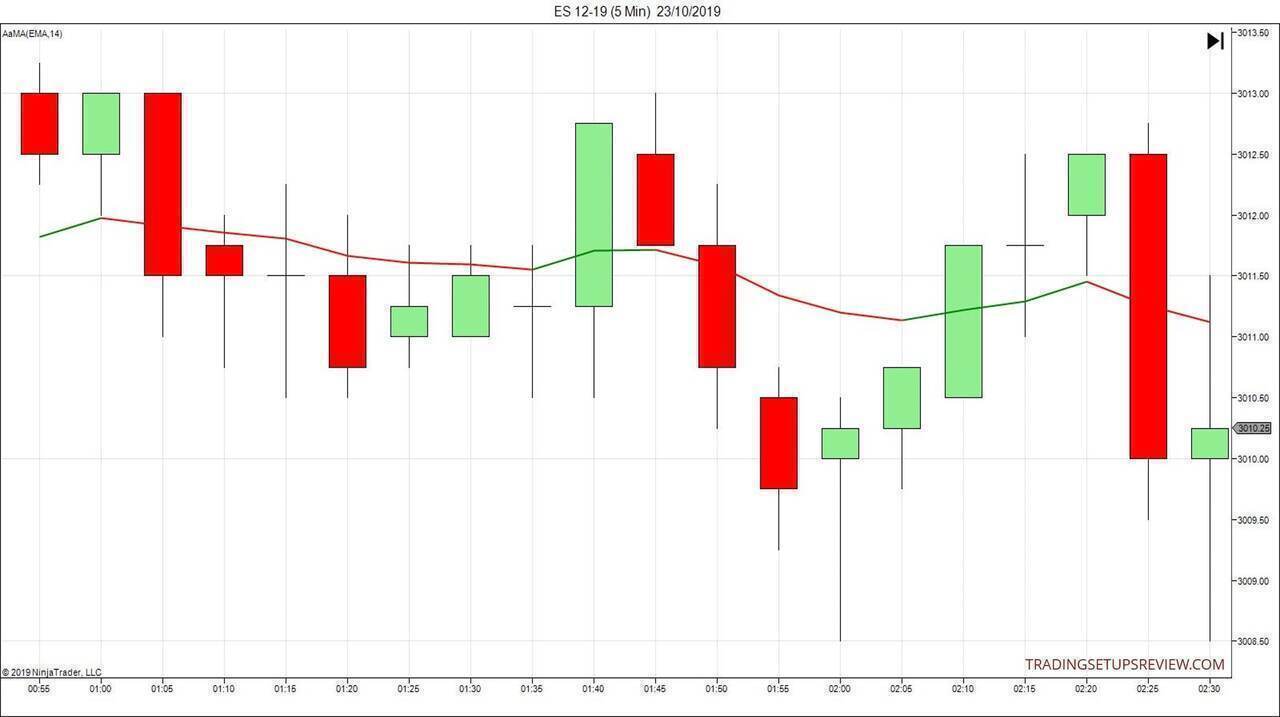
Again, concerning the list of questions above:
- The price is now below the MA. But the current candlestick overlaps with the MA.
- It got here following a bearish thrust in the form of an outside bar.
- Thirteen bars overlapped with the MA. Three bars were close to the MA.
- The slope is slightly negative.
- The slope has changed direction five times within these 20 bars.
Most price bars here overlapped with the moving average. The sideways price action was apparent.
On top of that, consider these:
- The consecutive bars (fourth to ninth) overlapped with the MA but closed below it each time.
- The thrust below the MA made more headway than the attempts to rise above.
If you have to choose a side, it would be bearish. Hence, overall, the market was trapped in a range with a slight bearish bias.
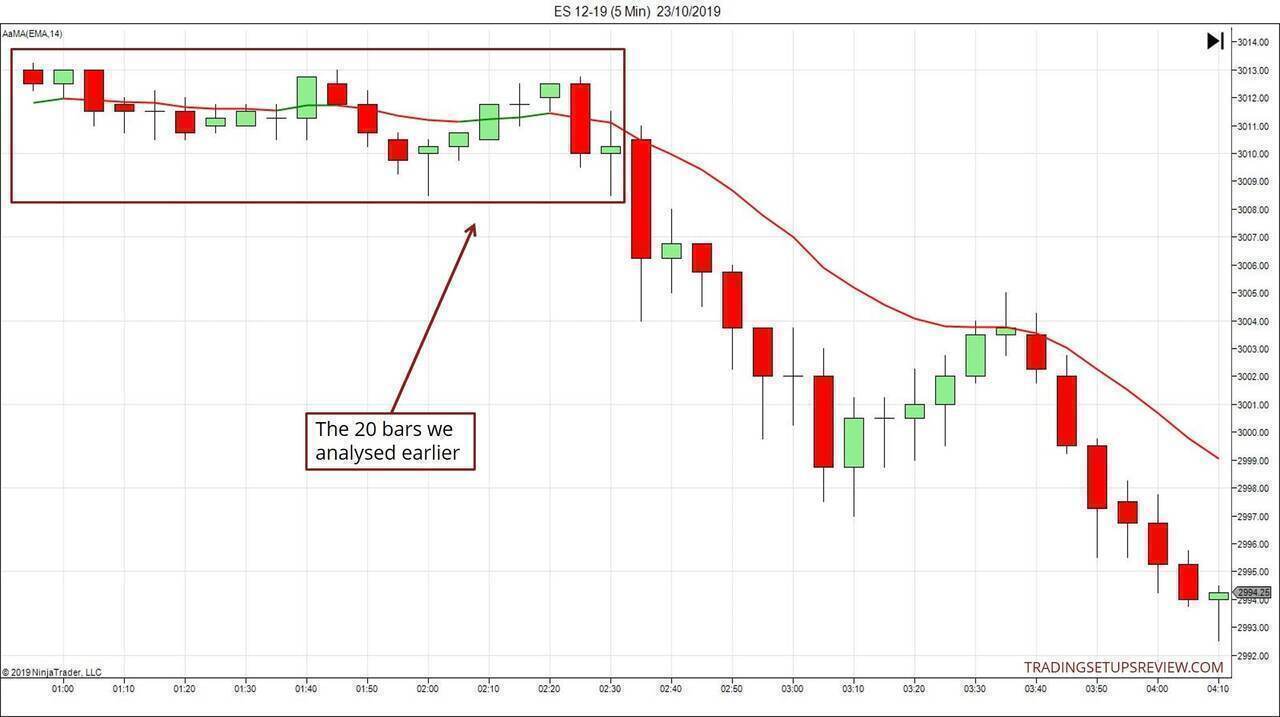
As shown below, the market eventually broke out into a bearish trend.
#2: Moving Average Day Trading Setups
After analyzing the market context, the next step is to look for trade setups. Trade setups determine our exact entry timing.
Let’s see how the moving average helps us with finding trade entries.
First, know that the moving average will not offer you the best entry for each trade. No indicator can do that. But it can provide you with a constructive micro-framework to help you decide.
Once you’ve nailed down the market bias, you can technically enter the market at any time. However, depending on your confidence level, you will choose entry strategies with different levels of aggression.
With the help of a moving average, you can discern three levels of aggressiveness for pullback trade entries.
- Before the pullback reaches the MA
- Right when the pullback hits the MA
- After the pullback crosses the MA against the trend
I picked the ES trading session below to illustrate the different entries.
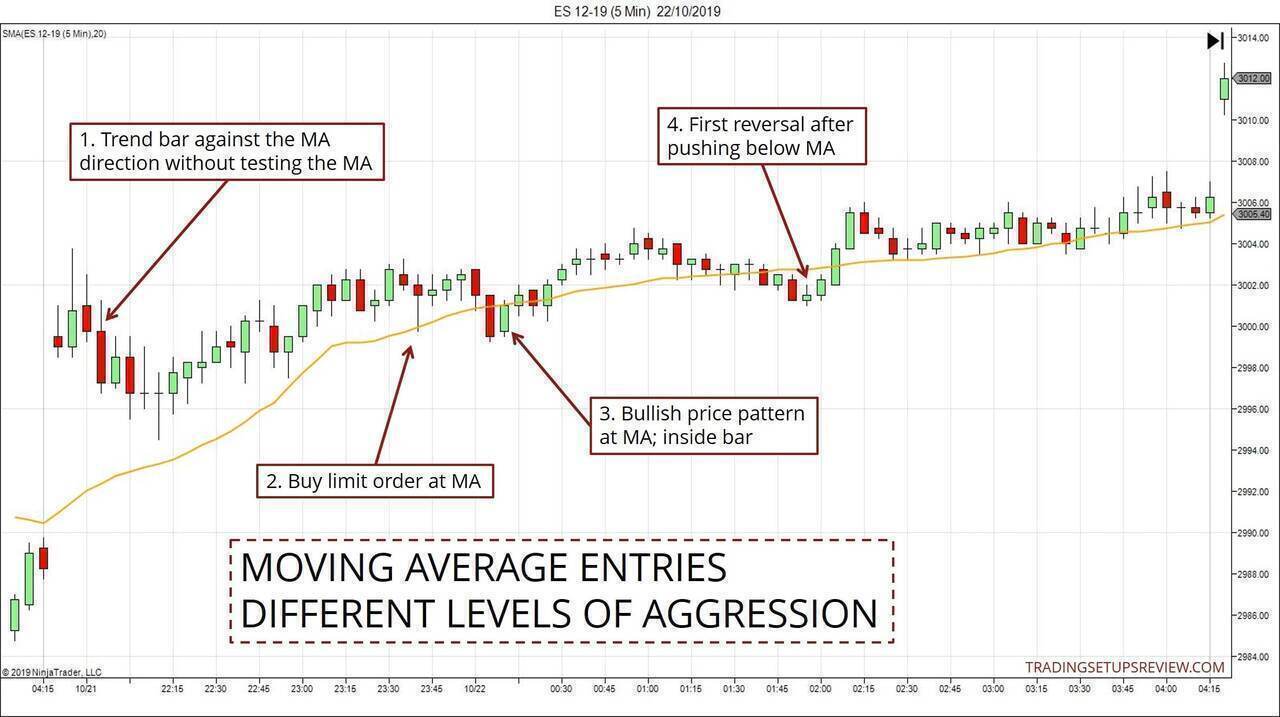
The four entries in the chart above (from left to right) decrease in the level of aggression.
- In a strong trend, you do not expect the market to test the MA. Hence, a trend bar against the moving average is a reasonable entry.
- If you expect the pullback to end around the moving average, there are two ways to enter. Placing a limit order at the MA is the more aggressive approach.
- When you need more confirmation before taking on a position, wait for a price pattern around the MA before entering with a stop order. (Read: Candlestick Patterns With Moving Average)
- With a mature trend that’s prone to deeper pullbacks, consider entering only after the market breaches the moving average. In this case, wait for the first reversal after the market has fallen below the MA. Among the pullback entries shown, this is the most conservative one.
Of course, the typology above is not exhaustive. I designed it to show how you can create a price action trading system with the help of a moving average.
You can and should try to create a framework based on your market understanding and experience with using moving averages.
#3: Trade Management - Moving Average For Trailing Stop-Losses
By definition, a moving average follows the price trend but lags behind it.
Hence, in theory, a trailing stop based on a moving average has the potential to:
- Lock in profit and;
- Give enough room for whipsaw action.
Let’s see the moving average in action for trailing stop-losses.
Method #1: Trailing Stop-Loss With Moving Average Level
The conventional approach is to adjust your stop-loss order along with the moving average. The moving average level is your stop-loss level.
The example below shows this tactic.
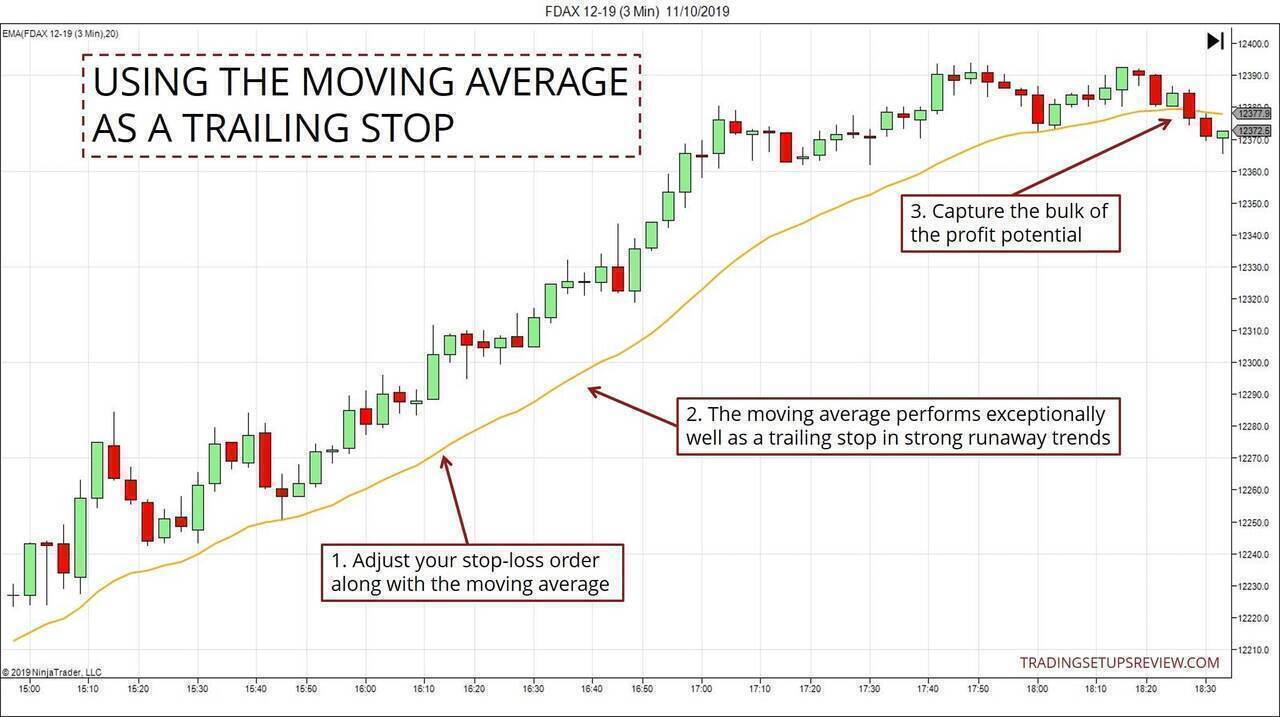
- Adjust your stop-loss order along with the MA. You can do this manually, or program your trading platform to trail automatically.
- In powerful intraday trends, the MA performs splendidly as a way to lock in profits.
- As you can see, in this example, it captured most of the profit potential.
Although this tactic seemed ideal in the example above, it works only in swift trends with minor and shallow pullbacks. Its performance suffers when the trend consists of a series of deeper pullbacks.
When you assess that deeper pullbacks are likely, consider the alternative approach below.
Method #2: Trailing Stop-Loss With Pivots Defined By Moving Average
To keep things simple, we’ll look at an example involving a short trade. The concepts apply to long trades as well.
Guidelines for trailing stop-loss in a short trade:
- When prices rise above the moving average in a pullback, prepare to adjust your stop-loss.
- When the market falls below the moving average and pushes away from it, shift the stop-loss to the highest level reached during that pullback.
A chart really helps here.

Assume you are already in a short position.
- Once the market goes above the MA, consider tightening your stop-loss. But do not adjust your stop-loss order yet!
- When the market pushes below and away from the MA, adjust the stop-loss to the price level in Point 1. This is also the highest level reached by the pullback at that point.
- Again, this is another potential stop-loss level.
- Shift your stop order only when you observe a clear push away from the MA, in the direction of the trend.
Here, we are not relying solely on the moving average level. Instead, we are using the moving average to:
- Find reliable pullbacks for trailing our stop-loss
- Time exactly when to adjust our stop-loss
As you can see, this approach involves more price action analysis than the first one.
Conclusion: Day Trading with Moving Average
Day trading with a moving average is a simple approach for capturing intra-day trends.
More importantly, it is a valuable tool for traders who are learning price action.
The main reason is that you plot a moving average on the price chart itself. Hence, it allows you to observe how it interacts with price action.
When you look at a moving average, you have to look at price action as well. It does not distract you from the market structure.
Most of the concepts we discussed in this tutorial are valid for analyzing daily charts too. So please feel free to apply them beyond your intraday trading sessions.
Open a chart now, and put on a 20-period moving average.
With sufficient practice, it might be the only indicator you need.
The article was first published on 11 December 2013 and updated on 24 October 2019.