4 Effective Ways to Trade a Channel
By Galen Woods ‐ 8 min read
Do you trade with a channel? Channels are powerful trading tools for all kinds of trade setups. Learn how to make the most out of your channel trading.
Price channels are helpful indicators for maintaining focus. Unlike many other trading indicators, they plot directly over price action. Instead of distracting you from the price action, channels offer a useful framework for analyzing market movement.
There are many flavors of price action channels out there. But their recipes boil down to two ingredients:
- A representative line cutting through price action
- A measure of volatility to expand the line into a channel
There are dozens of trading channels including:
Regardless of your favorite channel tool, there are four ways to trade them.
In this tutorial, let’s explore the four different approaches to make the most out of this versatile tool.
- Trading Trends
- Trading Reversals
- Trading Ranges
- Trading Break-outs
These four approaches align with the basic types of trading setups.
#1: Trading Trends with Channels
Channels are perfect for pullback (continuation) trades. These are setups that you look for in a trending market.
Ideally, look for a channel that is sloping at a healthy angle (not too steep or too flat). This characteristic confirms that the market in a sustainable trend.
In the examples below, we will use the classic trend line channel. With practice, you can use this simple price action tool to:
- Confirm the market trend
- Identify pullbacks and entries
- Time your exits
Trading Example
Let’s go through this channel trading example.
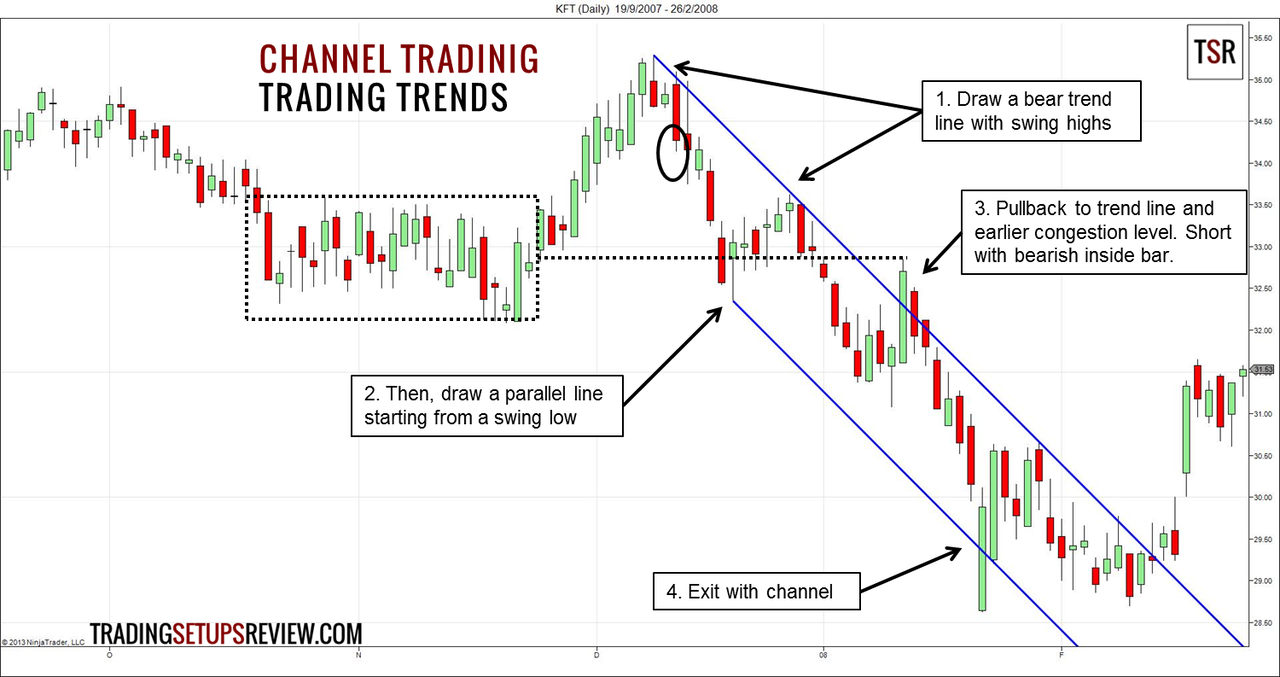
- With these two swing highs, you could draw a downward sloping trend line.
- Then, to complete the price channel, anchor a parallel line to this swing low. (This is the channel line.)
- The market rose to test the trend line, which served as a resistance. On top of that, the test also ended at a resistance zone offered by a previous consolidation area. Hence, the context was excellent for a bearish trade. The bearish inside bar presented a nice short setup.
- Here, the channel line provided the perfect price target for this continuation trade.
We could have identified this short setup with only the trend line. However, the channel added value by offering a clear exit point for this trade.
To learn more about trading trends with trend line channels, check out these resources:
- Article with more in-depth trend line channel examples
- Channel Surfing: Riding the Waves of Channels to Profitable Trading Paperback by Michael J. Parsons
#2: Trading Reversals with Channels
The width of a trend line channel sets expectations for volatility. Hence, if a trending market accelerates beyond the channel, you can interpret it as a sign of exhaustion.
This means that when price exceeds the channel trend line, consider the possibility of a climactic move.
Has the trend has exhausted itself?
If your answer is yes, look for reversal trades like the one below.
Trading Example
The chart below shows the daily prices of the SPY ETF.
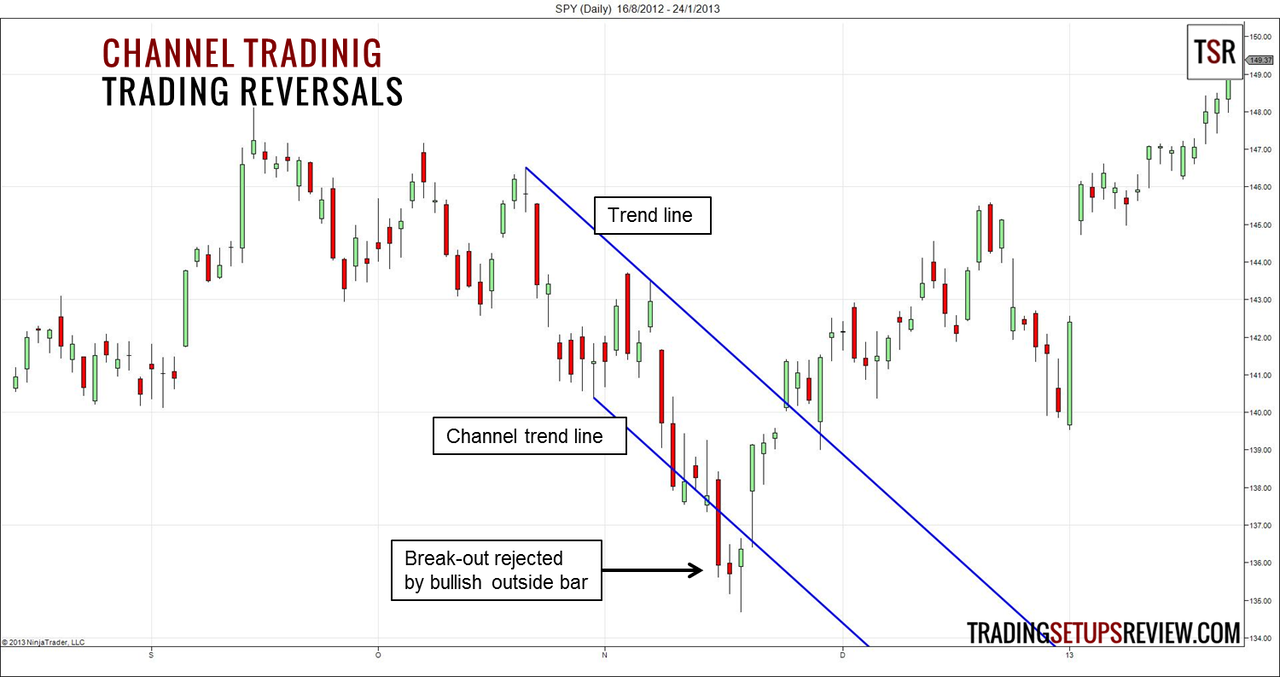
- This was the most recent trend line channel. Unlike computed volatility bands (e.g., Bollinger and Keltner), we need to adjust trend line channels manually by updating them to track the most recent price pivots.
- An entire bar formed below the channel. How did the market respond to this bearish thrust?
- The market rejected it with force, forming a bullish outside bar with a long lower shadow.
In theory, it’s challenging to pinpoint reversal trades. Hence, it pays to be more selective and to limit ourselves to only the best setups.
Here are some guidelines for finding the best reversal trades.
- Ensure that the channel is going against the trend of the higher time-frame. Ideally, you are looking for a retracement of a more significant, more dominant trend.
- Look for reversals when the trend is within steep channels. Steep channels are unsustainable.
- Strong rejection of any significant thrust beyond the channel trend line. (Like the outside bar in the example above.)
#3: Trading Ranges with Channels
Channels are not just for trending markets. They are also useful in highlighting range-bound trades.
In horizontal channels, the natural strategy is to trade without strong directional bias. Look to sell short at the top of the channel, and buy at the bottom.
The Gimmee bar trading setup is a classic example of trading sideways markets with channels. However, in the Gimmee bar strategy, instead of a trend line channel, we apply the Bollinger Bands.
- Bollinger Bands are formed around a moving average, using standard deviation as a volatility measure to envelope price action.
Trading Example
The chart below shows the market entering a meandering phase after a climactic surge.
If you’re not familiar with the Gimmee Bar setup, you might want to take a quick look at the rules in this article before proceeding.
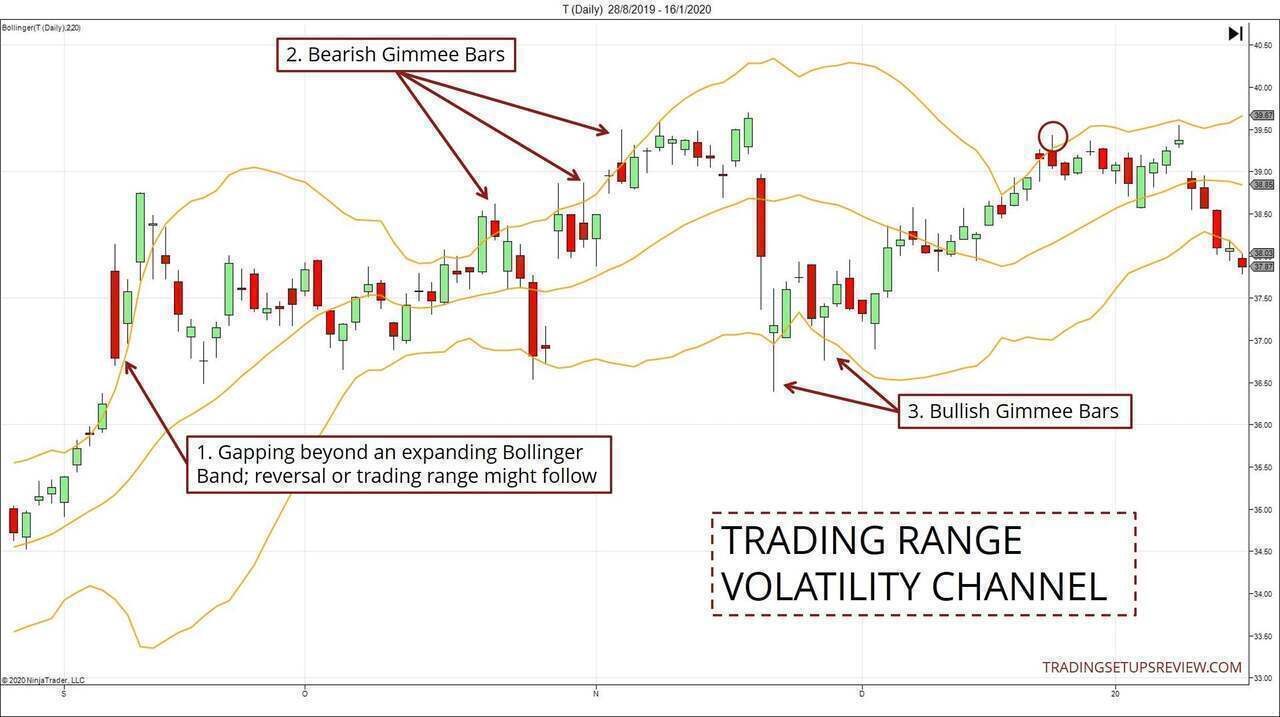
- Here, identifying the beginning of a sideways market is the crux. One way to do so is to look for thrusts beyond an expanding Bollinger Band. It marks unsustainable momentum, after which the market is likely to reverse or go sideways.
- Look at these short Gimmee Bar entries. A bearish Gimmee bar signal forms when a reversal bar overlaps with the Upper Band. (Observe how the market rejects each attempt to rise above the Band. Compare them with the earlier surge. It’s apparent that market behavior has changed.)
- These are the long setups. They were not only overlapping with the Lower Band; they also bounced off the support level formed by the earlier consolidation area.
No trading strategy is perfect. The chart above shows both winning and losing signals. If you manage your risk well, the Bollinger Bands offer sufficient profitable opportunities.
Also, remember that this is a range trading strategy. Hence, keep realistic profit objectives. A good rule of thumb is to exit near the opposite Band.
For more Gimmee Bar trading examples, refer to our review of the Gimmee bar trading setup.
#4: Trading Break-outs with Channels
The earlier strategies assume that the channel will contain price action. Thus, they seek to buy low and sell high within the channel.
What if this assumption fails?
Then, we might have a break-out trading setup. A break-out trade has the potential for quick profits. However, identifying valid break-outs is an art that is hard to master.
Here are some guidelines that traders deploy to find valid break-outs:
- Waiting for confirmation
- Pay attention to volume. Valid break-outs move quickly with increased volume.
- Look out for break-out bars with above-average bar range. (Yum-Yum continuation pattern.)
Break-out Trading Rules
Here, let’s stick to a simple approach using the Bollinger Band.
Bullish Break-out
- Wait for a bullish bar to close above the Upper Bollinger Band. (This is the break-out bar.)
- Place a buy stop order above the break-out bar.
- The bar immediately after the break-out bar must trigger the order. If not, cancel it.
Bearish Break-out
- Wait for a bearish bar to close below the Lower Bollinger Band. (This is the break-out bar.)
- Place a sell stop order below the break-out bar.
- The bar immediately after the break-out bar must trigger the order. If not, cancel it.
Understanding The Rules
- The first rule looks for a technical break-out signal.
- The second rule ensures that we enter only if the market momentum is on our side. This step serves as confirmation.
- The last rule demands immediate follow-through, which is critical for a successful break-out.
Trading Example
This example applies the trading rules above.
It includes untriggered break-out bars and both winning and losing trades.
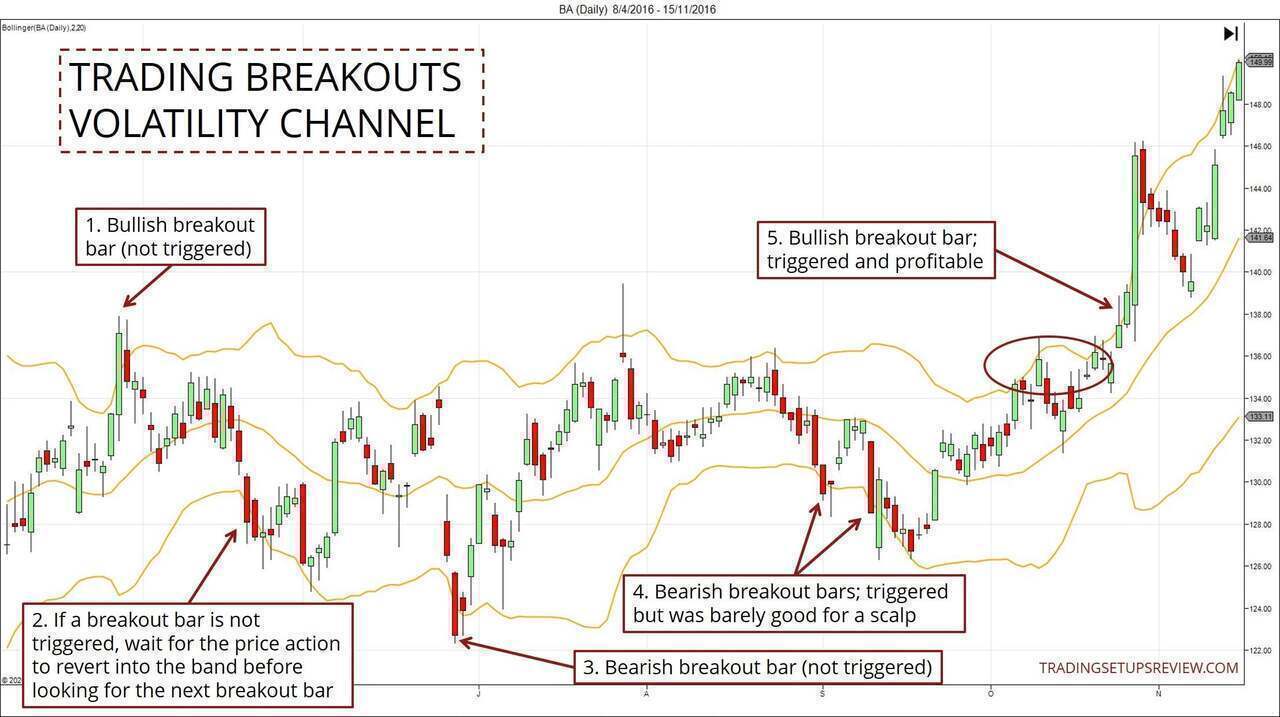
- This bullish break-out bar looked powerful in isolation. But the market did not follow through. Waiting for confirmation helped to avoid fake-outs like this one.
- Two consecutive bars closed below the Bollinger Band. However, we should focus only on the first one. Since it was not triggered, we should cancel our order. Look for the next break-out bar only after the market has reverted into the Bollinger Band.
- Another dramatic thrust with wide bearish gaps and bars. (Like Point #1) However, again, the break-out bar was not triggered here. These convincing (but failed) break-out attempts trapped more traders into the range.
- These two bearish break-out bars were triggered, but the profit potential was limited. (No strategy is perfect.)
- Finally, this bullish break-out bar was the real deal. It led us to a new bullish trend.
In the circled area, two bars seemed like bullish break-out bars. But they were not as they closed slightly below the Upper Bollinger Band. Moreover, they were not triggered.
This example uses simple price action confirmation to find break-out setups. There are many other ways to validate break-outs.
If you want to study other approaches, take a look at:
- Quick Trade using Linear Regression Channel - A classic example of a break-out trade.
- A Simple Day Trading Strategy - It uses MACD to confirm the break-out of Bollinger Bands.
Make the Most out of Trading Channels
Channels are powerful trading tools that highlight trading opportunities for all four types of basic trade setups.
However, for some traders, having too many trading options is a drawback.
- They look for trading setups everywhere.
- They take a retracement trade, and then a reversal trade, and then think that a break-out is imminent.
- All these within a few minutes.
- They are overtrading.
A solution is to draw a more significant channel to analyze the big picture. Then, only take trades in its direction.
For indicator-type channels, you can increase both the look-back period setting and the volatility parameter to create a broader channel to contain long-term price action.
Now that you’re familiar with the versatility of price channels, it’s time to go channel surfing.
The article was first published on 25 December 2013 and updated on 10 April 2020.