Popgun Bar Pattern Trading Setup
By Galen Woods ‐ 8 min read
Learn about the Popgun bar pattern by Jeffrey Kennedy seeks to find trade setups for impulse waves within the Elliot wave structure.
On daily charts, outside bars represent an erratic session and are always worth a closer look. The Popgun pattern is one that incorporates an outside bar as its trigger. I first came across it on Elliot Wave International’s website, where Jeffrey Kennedy wrote a short piece to discuss it. In this article, we’ll study this simple pattern and the market context that makes them useful.
Jeffrey Kennedy designed the Popgun pattern as a way to pinpoint the start of impulse waves within the Elliot wave framework.
For those who are unfamiliar with Elliot waves, it is a form of cycle analysis that focuses on counting price waves. Although Elliot wave is a sub-topic of technical analysis, its depth and complex nuances justify it as a discipline on its own.
You do not need to be an Elliot wave expert to make use of the Popgun pattern. But it’s good to have at least some understanding of this popular theory. Investopedia has a great introduction here.
Identifying The Popgun Bar Pattern
To trade the Popgun bar pattern, you must know the following basic bar patterns:
- Inside Bar
- Outside Bar
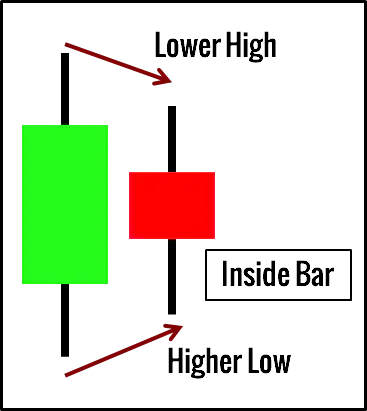
An inside bar is one that is completely engulfed by the bar before it. It represents a contraction in range and a pause in directional market movement.
An outside bar is the opposite of the inside bar. It completely engulfs the bar before it, showing strength in both directions.
Depending on the context, it is a sign of strength or a precursor to erratic movements.
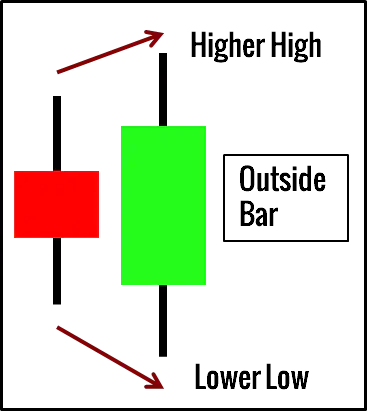
As shown below, the Popgun bar pattern consists of an inside bar followed by an outside bar.

How To Trade The Popgun Bar Pattern
Trading Rules
These are the basic trading rules you must follow.
Long Trading Setup
- A Popgun Bar Pattern
- The outside bar must be bullish (i.e., close higher than open)
- Buy on the close of the outside bar
Short Trading Setup
- A Popgun Bar Pattern
- The outside bar must be bearish (i.e., close lower than open)
- Sell on close of the outside bar
Trading Guidelines
Here are a few trading guidelines you should follow for the optimal setups:
- Take with-trend setups.
- Look for patterns with an outside bar that closes beyond the range of the inside bar preceding them.
- Avoid congested price zones.
Popgun Bar Pattern Trade Examples
Let’s go through four examples to cover a range of trading scenarios involving the Popgun bar pattern.
Example #1: Long Popgun Bar Pattern With Support Zone
This example shows a daily chart of Maxim Integrated Products Inc. listed on NASDAQ.
Observe how areas of earlier congestion acted as reliable support and resistance levels.
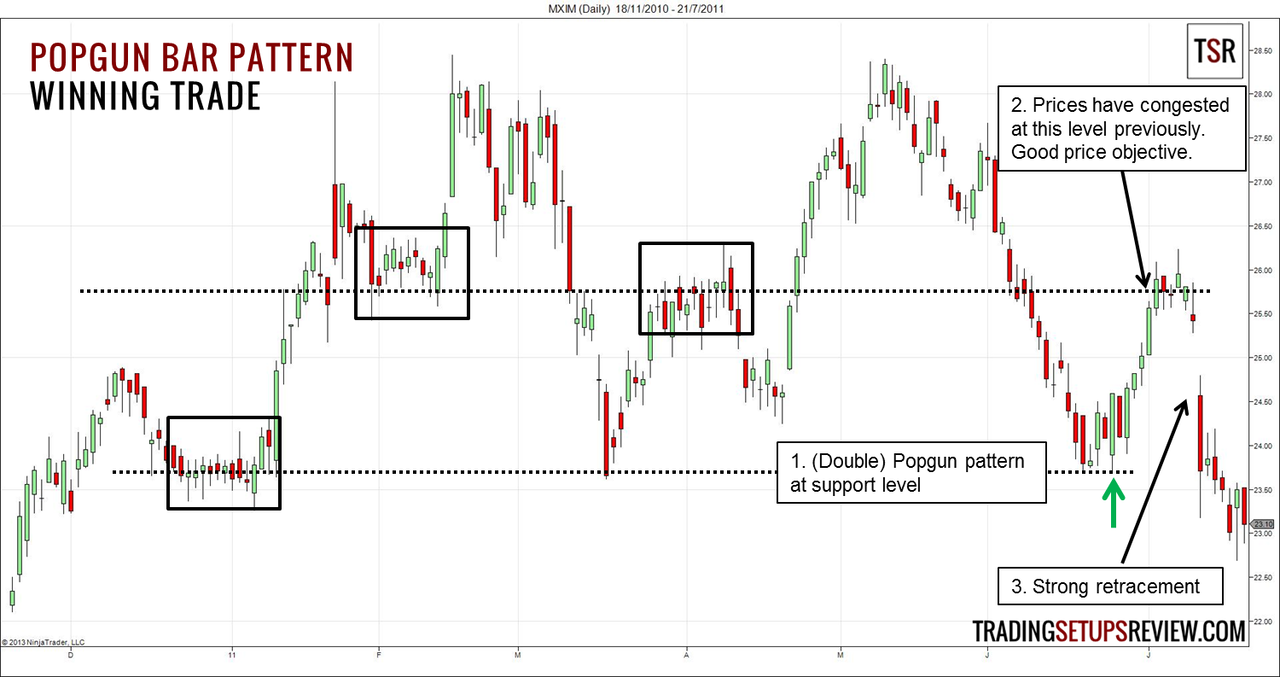
- After a swift decline, a Popgun bar pattern formed around a significant support level. This trade was interesting as we saw two consecutive Popgun trading setups. As a result, it is also an inside-outside-inside (ioi) bar pattern coined by Al Brooks in his price action trading series.
- The resistance area where prices have congested before was the perfect price target for this trading setup. More ambitious targets might have resulted in a loss.
- After moving sideways for a few days, the market reversed down quickly with a wide gap.
Although not marked in the chart, the resistance level (top dotted line) coincides with the 50% retracement of the decline from the top of the trading range.
Jeffrey Kennedy mentioned that this pattern retraces significantly, just like a popgun. Hence, trailing stops might not be the best tool to employ here. Consider taking profits at a logical price target.
Example #2: Inside-Inside-Outside Bar Pattern
This chart shows two instances of a specific form of the Popgun pattern - the inside-inside-outside bar pattern.
Located within the same trend context, they offer a fantastic chance for comparative analysis.
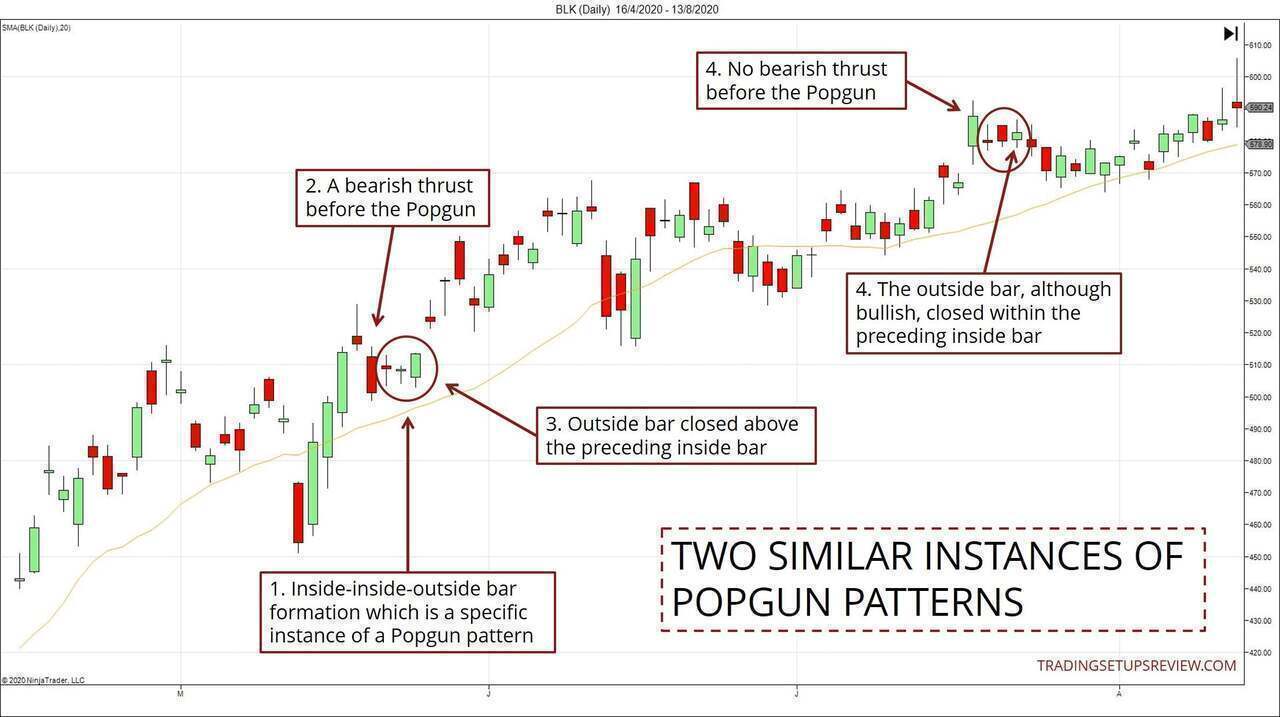
- Both circled patterns contain the inside-inside-outside bar pattern. Essentially, it is a Popgun pattern preceded by an inside bar.
- Let’s start with the first instance. It formed after the market pulled back within a bull trend. The bullish Popgun pattern halted the bearish pullback.
- Furthermore, the final outside bar was a bull trend bar that closed above the inside bar before it.
- Now, let’s turn our attention to the second instance, which did not perform well as a timing device. No bearish pullback preceded this Popgun pattern. The Popgun pattern halted the market’s push to a new high. This development did not fit the ideal price concept we had in mind, which was that the Popgun should pinpoint the start of a bullish impulse wave.
- On top of that, the outside bar here was not as bullish as the one in the first instance. It did not close above the previous inside bar. Its top shadow was longer than its bottom shadow, and it took on the appearance of a doji.
Unlike the first Popgun pattern, the second instance failed to pinpoint the start of a bullish wave. However, the market continued to rise eventually.
In our analysis, it’s good to make a distinction between the market context and the timing device. In this case, while the timing device failed, the bullish market context was still in place.
Having a clear distinction in your analysis will help you decide what to do after a failed trade. Do you look for a re-entry in the same direction? Or do you switch mode and look for setups in the opposing direction?
An interesting note: the inside-inside-outside pattern we observed in this example is akin to a micro triangle breakout. If we zoom down to faster timeframes, we would likely find a triangle chart formation followed by a bullish breakout.
Example #3: Losing Intraday Trade
Let’s try to find an intraday Popgun bar pattern. This is a 30-minute chart of EUR/USD futures on CME.
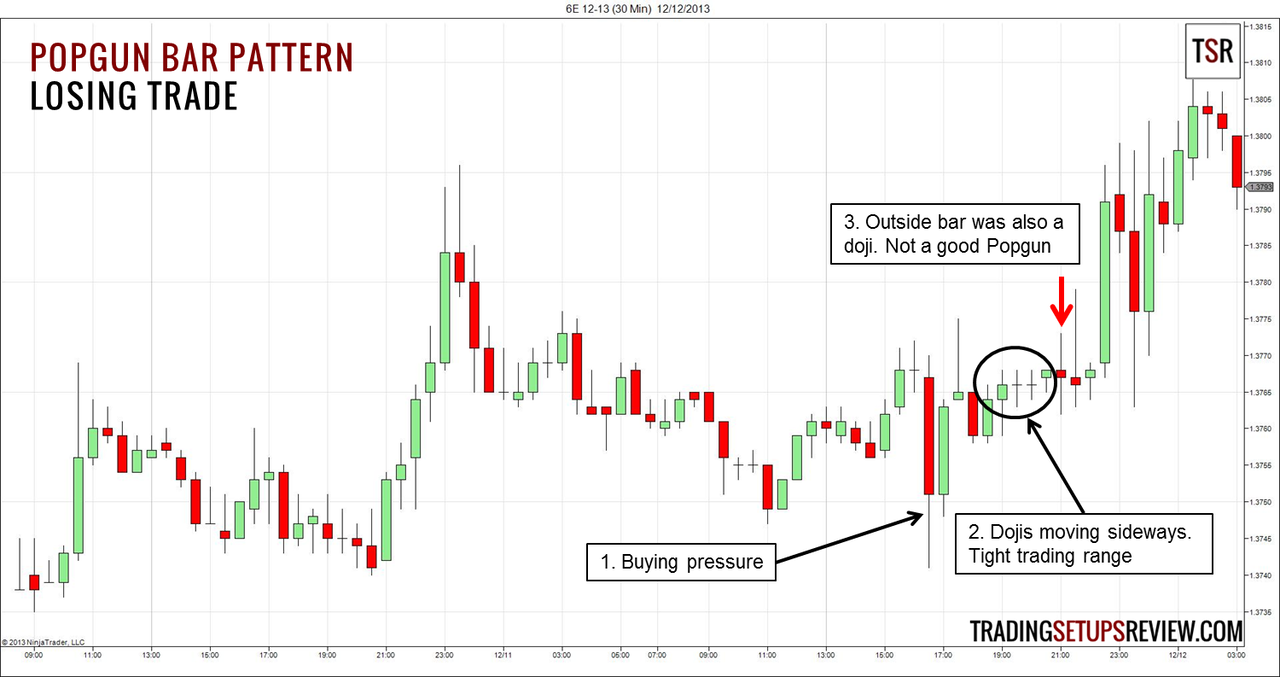
- Despite the healthy bear trend bar, the extended bottom tail hinted at buying pressure. Together with the bullish inside bar that followed, the bear move seemed to lack follow-through.
- At this point, the market started to congest and moved sideways. The series of dojis made the meandering apparent.
- This outside bar completed the bearish Popgun bar pattern. However, the outside bar barely managed to close below its open, and was a doji itself. Hence, it was not surprising that the market ignored it entirely and proceeded to rise.
In this example, the general market bias was bullish. You could see that from two key observations:
- The sustained bullish thrusts that pushed to new market highs
- The most potent bearish bar was rejected almost immediately. (As highlighted in Point #1 above)
On top of that, consider the poor form of the Popgun pattern.
Considering these factors, a prudent trader would have decided against taking this bearish setup.
Example #4: Double Botton & Popgun Pattern Failure
This daily chart from the SPY ETF shows two Popgun patterns.
- The first instance forms the second swing low of a double bottom chart pattern.
- The second shows a failed pattern which a nimble trader could still take advantage of.
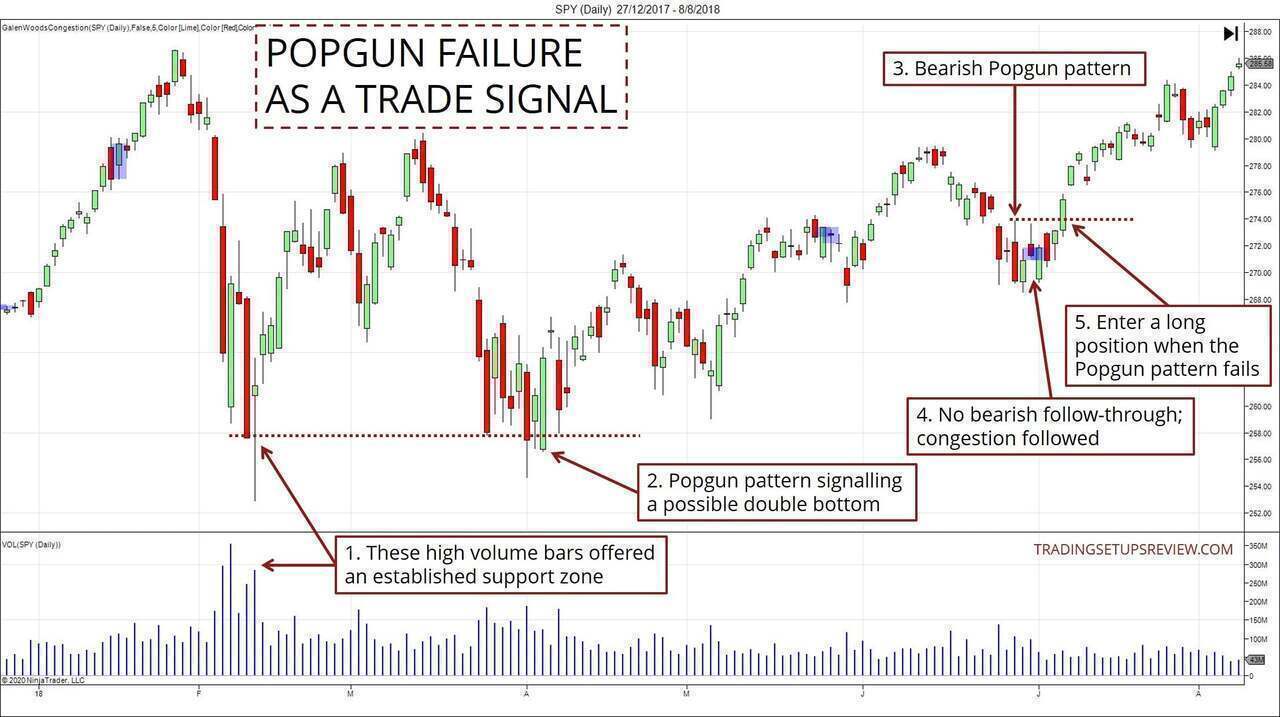
- A salient feature of the market context was the series of high volume bars. They projected an established support zone.
- The arrow points to the outside bar of the Popgun pattern. On top of enjoying support from the projected level, both bars of the pattern were bullish. It was a solid signal for a double bottom bullish reversal.
- A bearish Popgun pattern formed here. However, if you observe the sideways price action at that point, there were far more instances of bullish momentum than bearish ones. Hence, we should hesitate to commit to a bearish position.
- Moreover, the pattern did not enjoy any bearish follow-through. The market threw up a congestion zone immediately, hinting at the pattern’s eventual failure.
- Finally, for traders who were looking for bullish entries, the failure of the bearish Popgun pattern offered a reliable option.
This compact chart exhibits two critical lessons.
- The broader context is critical for a price pattern’s success. Here, recognizing the double bottom gave us confidence in the Popgun setup.
- A failed trading setup can be as helpful as a successful one. In this example, the failure pattern offered a great entry point for bullish traders.
Conclusion - Popgun Bar Pattern
This pattern focuses on the change from range contraction (inside bar) to range expansion (outside bar). It interprets this change as a sign of strength.
With this underlying concept in mind, we should only consider Popgun bar patterns with a clear directional outside bar and not a long-legged doji.
Generally, outside bars are wild creatures. Price action that follows outside bars is likely erratic. Hence, it’s crucial to check the context for confirmation that an impulse wave is underway. When in doubt, wait for more price action to unfold.
Popgun bar patterns that do not take off immediately tend to test the low of the outside bar (for long trades) before moving up. Hence, the low of the outside bar could serve as a support for potential long trades. The reverse is true for short trades.

The article was first published on 19 December 2013 and updated on 3 September 2020.