Candlestick Patterns With A Moving Average
By Galen Woods ‐ 8 min read
Learn how to trade candlestick patterns with a moving average. Pick up a simple and effective trading approach that clarifies candlestick patterns.
Candlestick patterns have little value without the right price action context. If you’ve been studying candlestick formations, you must have heard this principle many times over. You cannot trade patterns in a vacuum.
But what do we mean by context?
It is an overall technical assessment that encompasses:
- The market’s trend
- Support and resistance structure
- Recent price formations
- Volatility
It seems intimidating at first, but a simple trading indicator can help us out here - the moving average.
A straightforward yet powerful trading strategy is to analyze candlestick patterns using a moving average. While candlestick patterns focus on the short-term buy/sell balance, the moving average offers the bigger picture or the trend context.
This tutorial assumes a basic understanding of candlestick patterns.
- Need a refresher? This article covers ten common candlestick patterns with chart examples.
- Need a reference? Encyclopedia of Candlestick Charts (Wiley Trading) by Thomas Bulkowski offers a reliable reference.
Despite their often mystical names like Engulfing and Shooting Star, candlestick patterns are not magical. They are merely distinct price action patterns.
Focus on the price action: high, low, open, and close. Forget the names.
Candlestick Trading Rules
Here, we use a 20-period exponential moving average (EMA) to track the market trend and highlight support/resistance levels.
Nonetheless, you can apply a similar approach using other types of moving averages.
Long Trading Setup
- A pullback down to the 20 EMA
- A bullish candlestick pattern that overlaps with the 20 EMA
- Go long as the market breaks above the high of the last bar of the candlestick pattern
Short Trading Setup
- A pullback up to the 20 EMA
- A bearish candlestick pattern that overlaps with the 20 EMA
- Go short as price breaks below the low of the last bar of the candlestick pattern
Candlestick Patterns with Moving Average Examples
Do not apply this strategy rigidly. Use candlestick patterns together with the moving average to locate a starting point for your analysis.
Then, observe the price action that led up to that candlestick formation.
To appreciate the power of price action analysis, you’ll need to study the market carefully. Here, I’ve included five in-depth trading examples to help you do so.
Example #1: Evening Star Candlestick
The Evening Star is a bearish pattern consisting of three candlesticks.
In this daily chart, you’ll see an example of a favorable context for a bearish setup.
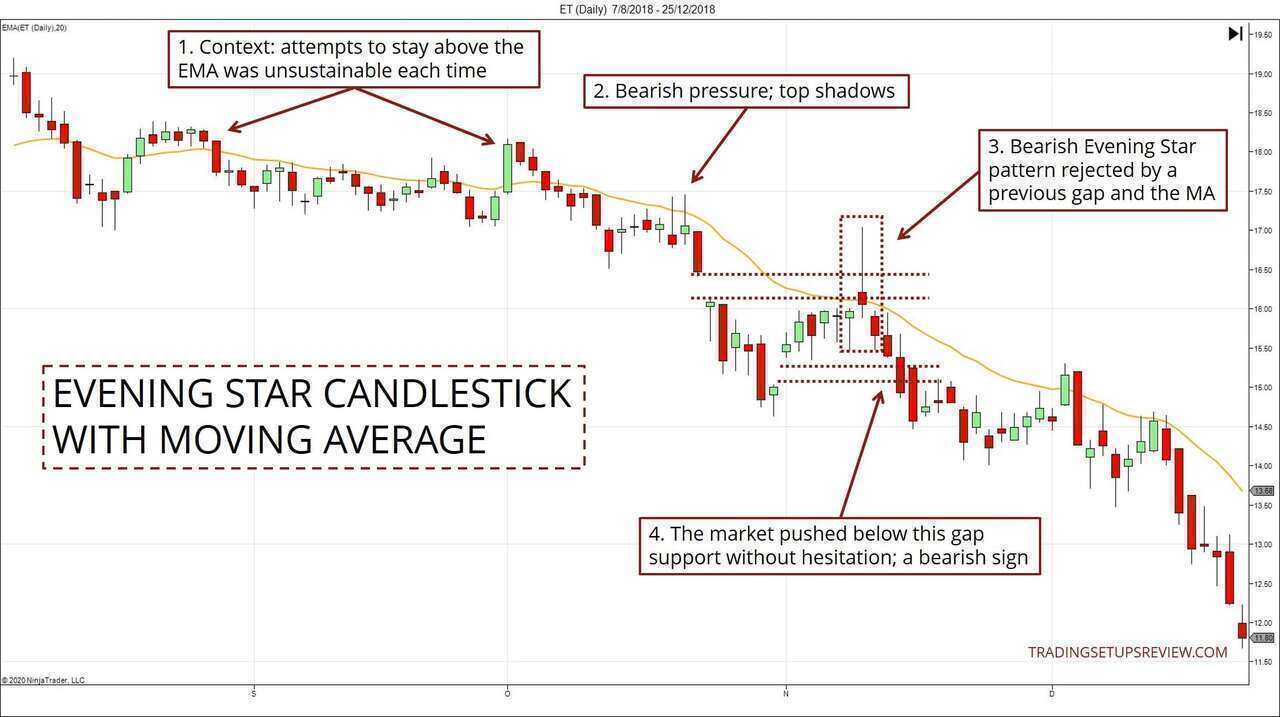
- As the market drifted down, the moving average rejected the market several times. In the two instances where the market managed to push above the EMA, bullish momentum faltered.
- The top candle shadows hinted at more bearish pressure.
- After a bearish gap down, the market retraced upwards. The pullback halted with an Evening Star pattern, which met the resistance offered by the gap and the EMA.
- This short setup might’ve stalled due to potential support from a gap just below our entry. However, the market pushed below the gap zone without hesitation, sealing the deal in favor of the short setup.
Example #2: Bearish Engulfing
This is a candlestick chart of EUR/USD forex. Let’s look for candlestick patterns that overlap with the moving average.
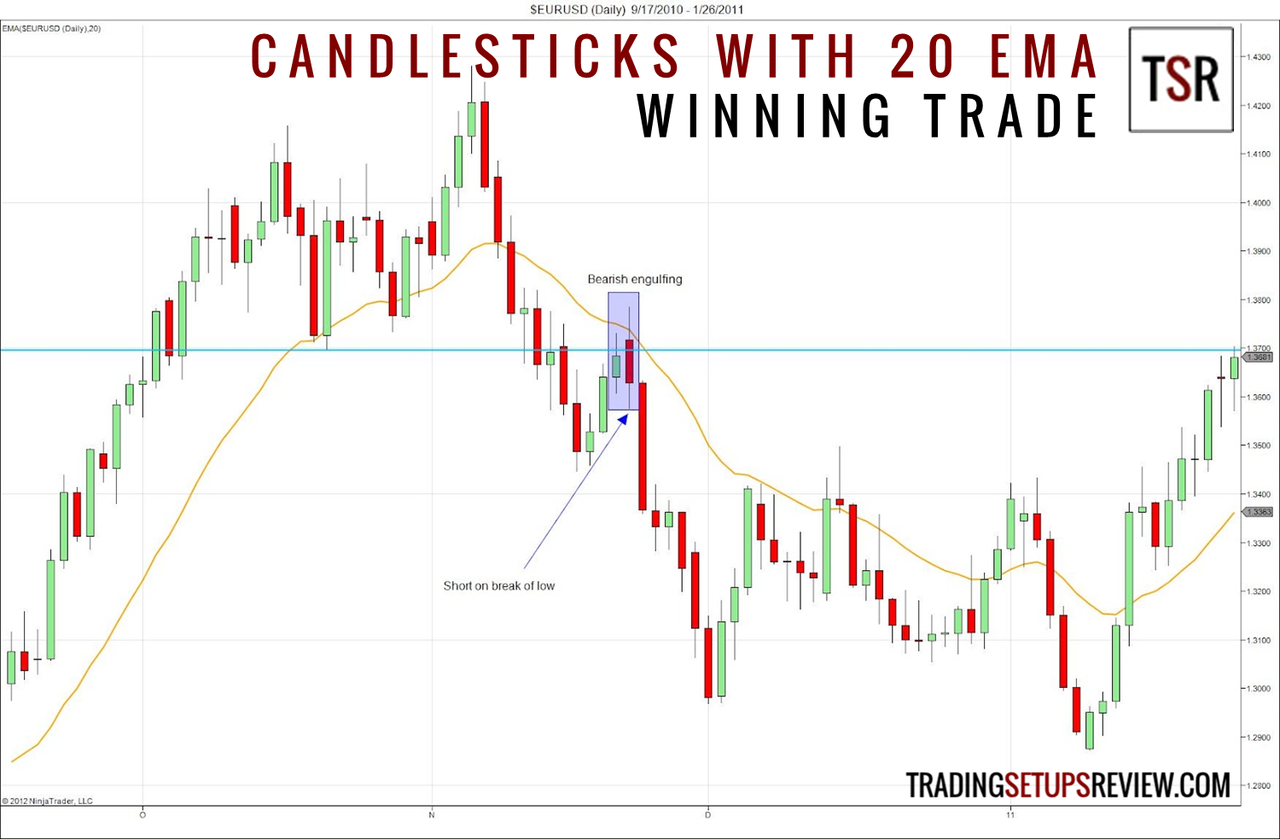
- Look at the top of the chart. After a test of the previous trend high, prices reversed down with strong momentum. Note the three consecutive bear trend bars.
- The pullback upwards tested the 20-period EMA and the low of a prior trading range (the blue horizontal line). A bearish engulfing candlestick pattern formed at the 20-period EMA.
- The bearish Engulfing pattern found strong rejection at these resistance levels. This trade had the potential to catch the beginning of a new bearish trend.
- A healthy bear trend bar triggered our sell order at the low of the pattern.
This trade followed through quickly.
When trading candlestick patterns with a moving average, use the distance between the candlesticks and the EMA to judge the momentum. In this case, the large gap between the candlesticks and the EMA highlighted the bearish momentum.
Example #3: Bullish Engulfing
Candlestick patterns like the Piercing Line and Morning/Evening Star are not common. But you’ll find that the Engulfing candlestick pattern is much more common.
Hence, this example focuses on the Engulfing candlestick as well.
However, its higher frequency is not an excuse for negligent trading. We will need to scrutinize each Engulfing pattern even more to find the outstanding ones for our trading setups.
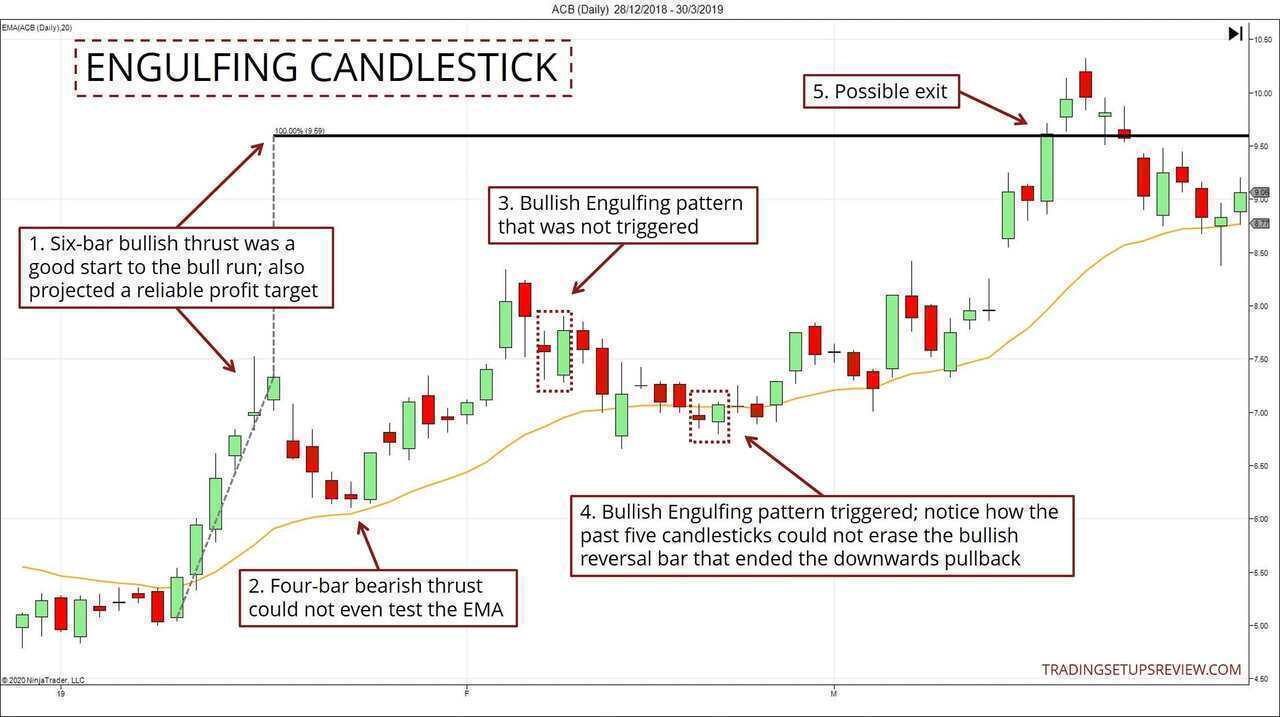
- This six-bar bullish thrust started the new bull trend on the right foot. Also, note its projected target.
- The market tried to push against the rising tide. However, despite four consecutive bearish bars, the market could not even test the EMA.
- After pushing to a new high, the market pulled back. A bullish Engulfing pattern formed, but it was not triggered.
- A second bullish Engulfing pattern overlapped with the moving average. This offered the entry we were waiting for.
- Considering the projected target, this setup presented a great reward-to-risk ratio.
Let’s return to Point #4 to highlight more detail.
- The bullish Engulfing pattern ended a five-bar streak. The string of five small-sized candlesticks could not push below the bullish reversal bar. This failure hinted at the weakness of the bears.
- Note to course students: this Engulfing pattern was also a bullish Congestion Breakout Failure.
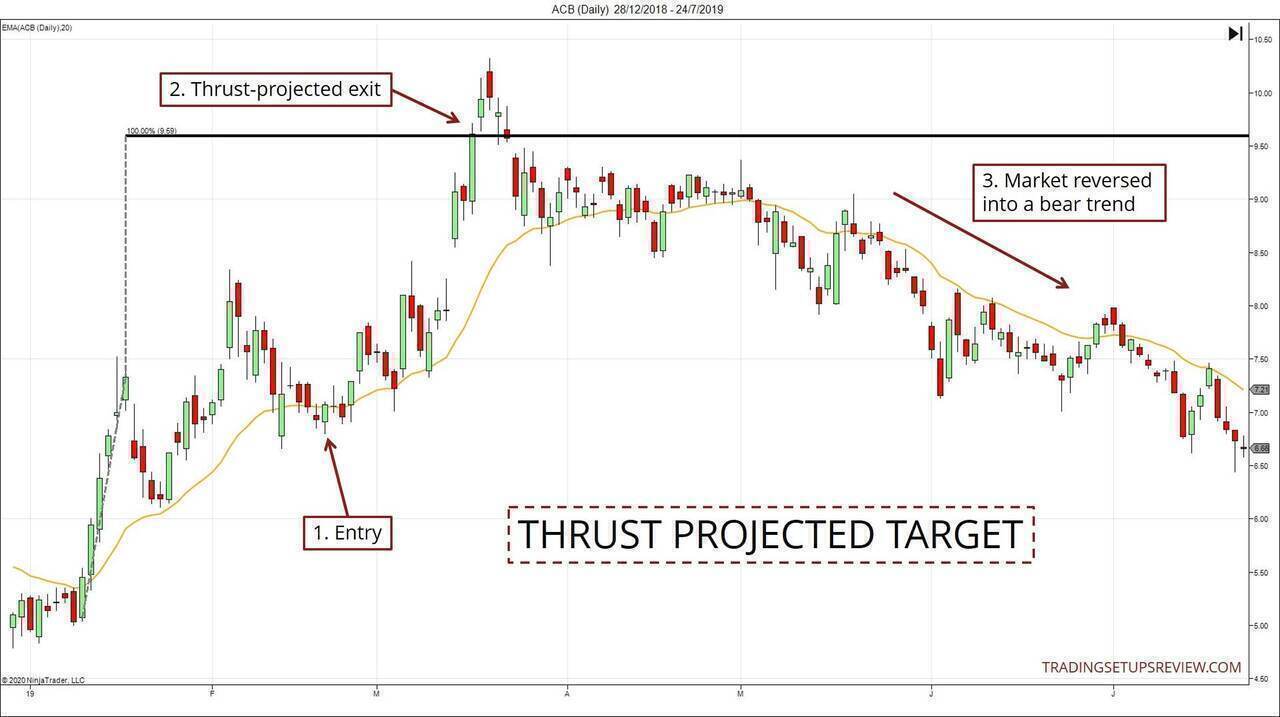
Finally, the projected target worked splendidly here. Projecting a target from a price thrust is a great way to set an initial profit target.
Example #4: Context Matters
Instead of analyzing one particular setup, this example highlights the role of the market context in determining the success or failure of a candlestick pattern.
We will focus on the same candlestick pattern (Morning Star) and observe how its performance is affected by changes in the market context.
Other than the 20-period EMA, the chart below applies:
- NinjaTrader’s default candlestick pattern indicator (to highlight Morning Star patterns)
- Congestion Zone indicator from my price action course (Blue zones)
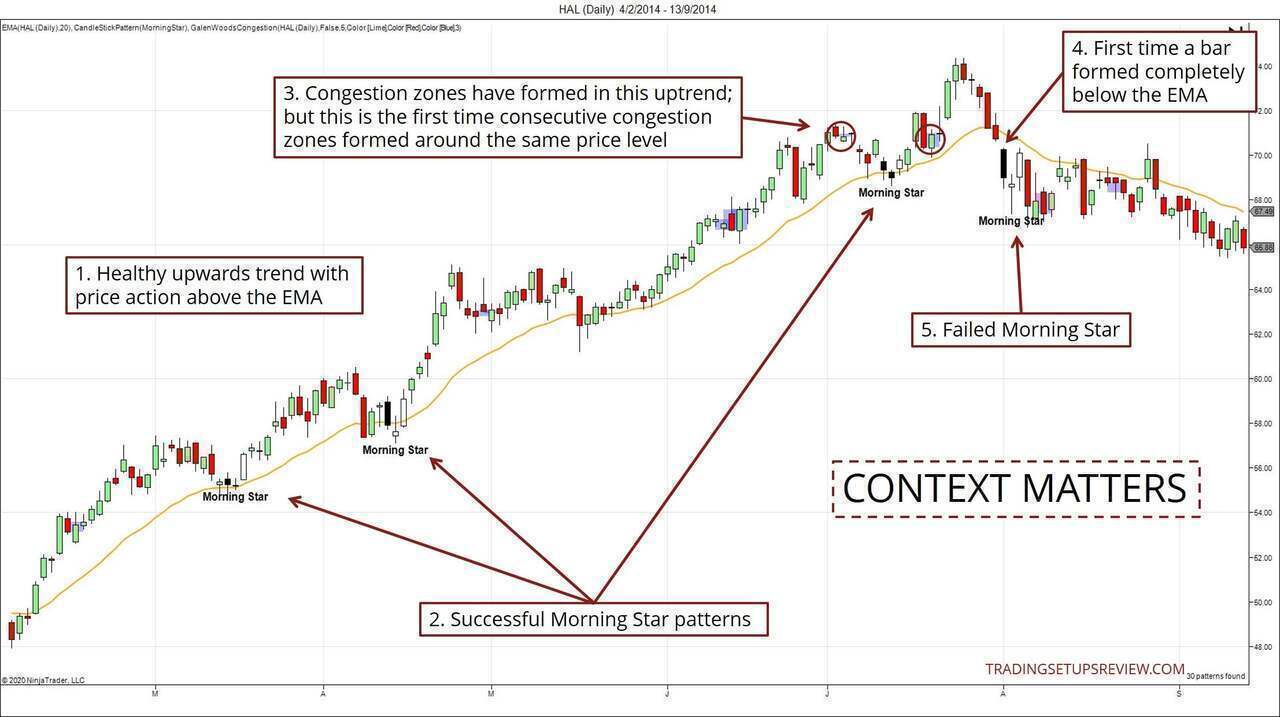
- The market was in a healthy bull trend. Note that not a single candlestick was entirely below the EMA. The EMA managed to support the market each time it retraced.
- With this bullish backdrop, we saw three Morning Star patterns that were successful as long setups.
- Here, we got the first signal that the market has changed. While congestion zones have formed during this bull trend, they have never formed around the same price level. Repeated congestion around the same price level signals that a trend is losing momentum. Has the context changed?
- Soon, we observe a candlestick forming entirely below the EMA. This is another shift away from the price action typical in the healthy bull trend we saw. At this point, we could confirm that the market structure has changed. The nice bullish run might be over.
- Hence, it was not surprising that, unlike the earlier patterns, this Morning Star failed as a long setup.
There is one key lesson here.
Your confidence in the market bias should take precedence over the exact candlestick pattern you’re looking to trade.
Example #5: Losing Setup
This is a daily chart of Marshall & Ilsley Corporation. For a balanced discussion, this last example focuses on a losing candlestick setup.
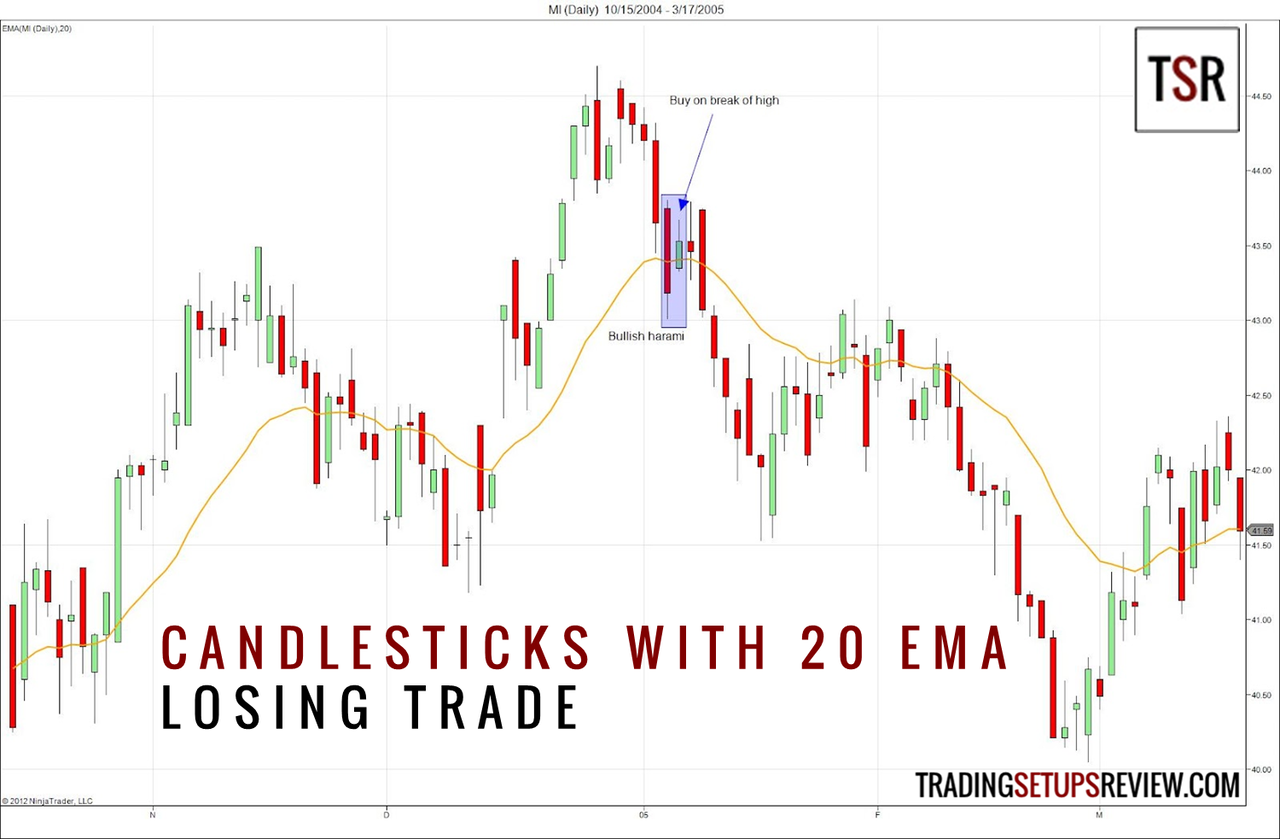
- A bullish harami formed right on the 20-period EMA.
- The next day broke the high of the inside bar.
- We went long, but the trade went against us immediately.
A fundamental candlestick trading principle is to wait for confirmation. The typical approach is to wait for one more candlestick to form in our intended entry direction.
Waiting for confirmation indiscriminately is not a good idea. This is why our default trading rules above did not mention anything about waiting for confirmation.
However, for the weaker trading setups, waiting for confirmation is prudent.
There was apparent downwards momentum preceding the Harami pattern. Look at the five consecutive bearish bars. Also, the final bar in the pullback closed below the EMA with ease.
Given such strong momentum downwards, it was wise to wait for bullish confirmation - which never came.
Hence, an astute trader could have avoided this trade by demanding to see signs of returning bulls. (or by considering a re-entry approach)
Review - Trading Candlestick Patterns With A Moving Average
Candlestick patterns are well-defined pieces of price action with clear underlying market concepts. Hence, beginners will find candlestick patterns useful for picking up price action.
Using candlestick patterns with a moving average helps to clarify the trend. It also provides a framework to help us better assess the potential of candlestick patterns.
Hence, combining candlestick patterns with a moving average is a simple yet effective trading approach.
Our choice of a 20-period EMA in this tutorial is not cast in stone.
You may use other moving average types and vary its parameter. But after a little bit of experimenting to find out which combination works best for you, stick with it.
Every moving average/parameter pair behaves differently. To benefit the most from this trading tool, you need to appreciate its nuances and learn how it behaves under different market conditions. Your ability to use the moving average to clarify price action will be the key to unlocking the potential of this trading strategy.
Remember that candlestick patterns are for clarifying price action.
Do not use them to force a rigid interpretation on price bars, give them mystical names, and expect predictable results.
Focus on the context, understand the nuances within each pattern, and be flexible when trading them.
Candlestick patterns offer a versatile gateway to understanding price action. If this tutorial has piqued your interest, check out the resources below.
Candlestick Pattern Trading Guides
Candlestick Pattern With Other Indicators
- Trading Candlesticks With RSI
- The Sakata Method Review
- Candlestick Patterns With Stochastics
- Candlestick With Pivot Points
More Perspectives
- An experienced trader shares how he trades using candlestick patterns with a moving average.
- Profitable Candlestick Trading: Pinpointing Market Opportunities to Maximize Profits (Wiley Trading)
by Stephen Bigalow, a widely cited candlesticks expert.
 by Stephen Bigalow, a widely cited candlesticks expert.
The article was first published on 18 March 2012 and updated on 12 March 2020.