Andrew's Pitchfork Trading Strategy
By Galen Woods ‐ 5 min read
Drawing channels with Andrew's Pitchfork caught the market plunge of 2008-2009. Read this now, and you might still be in time for the next.
Alan Andrew’s Pitchfork is catchy. It catches your attention with its unusual name and its striking pitchfork appearance. It also catches trends with a channel.
Essentially, Andrew’s Pitchfork is a tool for drawing price channels. While two lines surrounding price are usually enough to draw a channel, the Pitchfork has an extra line. It is the median line or the handle of the Pitchfork.
The median line is central to this trading method. This is why Andrew’s Pitchfork is also known as the Median Line Method.
How To Draw The Andrew’s Pitchfork
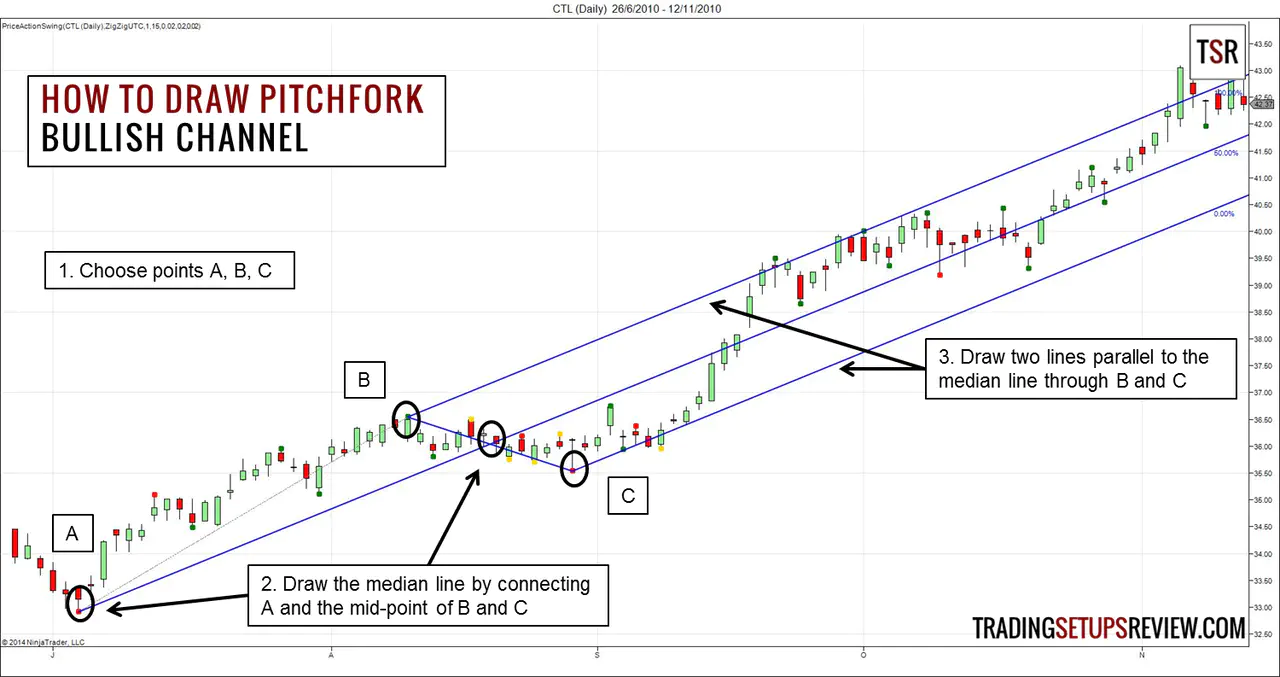
There are three steps to drawing a Pitchfork.
Step One - Pivot Points
You need three points for a Pitchfork.
For a bull channel, label:
- A major pivot low as point A;
- A subsequent higher pivot high as point B; and
- The following pivot low as point C.
For a bear channel, label:
- A major pivot high as point A;
- A subsequent lower pivot low as point B; and
- The following pivot high as point C.
Step Two - Median Line
Draw a line passing through point A. and the mid-point of point B and C. This is the median line.
Step Three - Channel Lines
Project parallel lines to both sides of the median line to form the channel. One line should pass through point B, and the other through point C. The top line is the upper median line and the bottom line is the lower median line.
The median line determines the slope of the channel. This is in stark contrast to the normal trend line channel method in which the angle depends on the trend line.
Read: 4 Ways to Trade a Channel
In charting packages with an in-built Pitchfork drawing tool, selecting the three pivot points is enough for drawing the Pitchfork.
Trading Rules - Andrew’s Pitchfork Trading Strategy
There are many ways to trade using Andrew’s Pitchfork but the basic idea is that price will oscillate around the median line. In this version, we will focus on trading the first re-test of the limiting median line.
Long Trade
- Draw a bull channel with Andrew’s Pitchfork
- Wait for price to fall and test the lower median line
- No bar high should be lower than the lower median line
- Buy a tick above the high of a bull bar at the lower median line
Short Trade
- Draw a bear channel with Andrew’s Pitchfork
- Wait for price to rise and test the upper median line
- No bar low should be higher than the upper median line
- Sell a tick below the low of a bear bar at the upper median line
Andrew’s Pitchfork Trading Examples
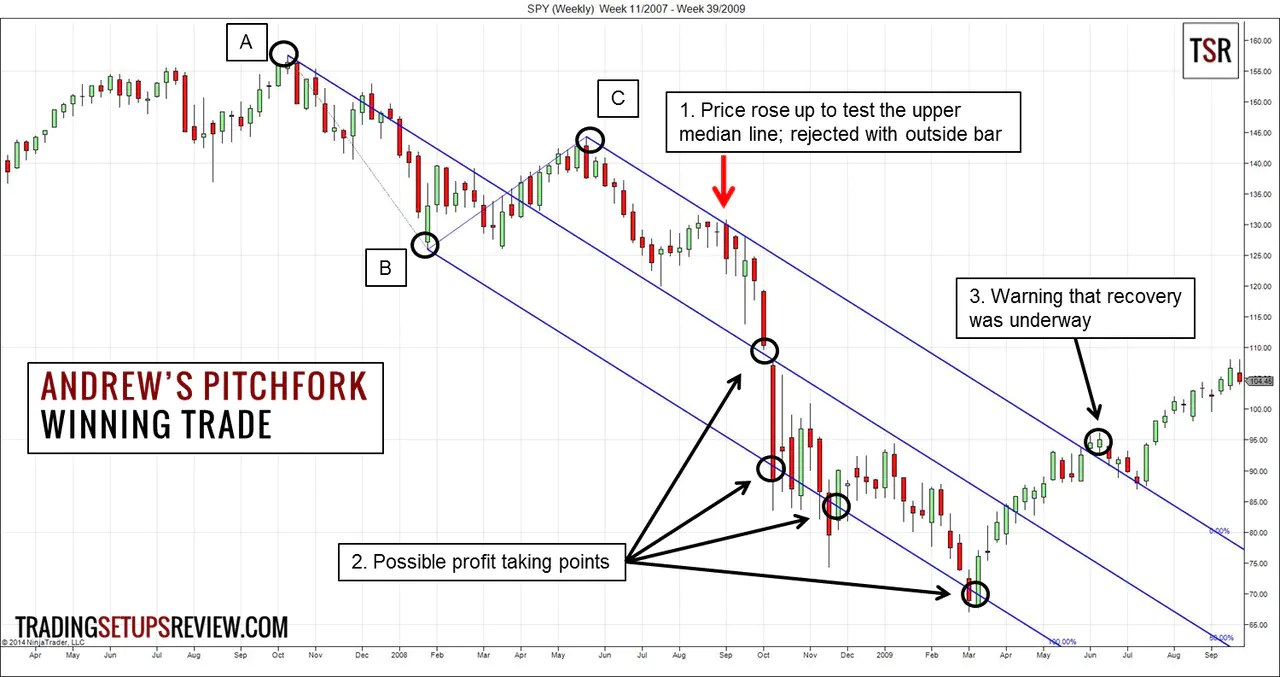
Winning Trade - Short SPY Weekly
This SPY weekly chart shows one of the most impressive Pitchfork in the past decade. After all, it caught a huge chunk of the market plunge in 2008/2009.
- After making a new low in the downwards trend, the market bounced up to test the upper median line. The resistance was clear as a bearish outside bar formed at the line. This bar was also our signal to go short.
- These four points are possible targets for the bear market. In fact, the last target caught the exact bottom of the crisis.
- Price rose strongly and broke out of the upper median line. This break-out warned us that the market was not simply having a rest in a down trend. A recovery was underway.
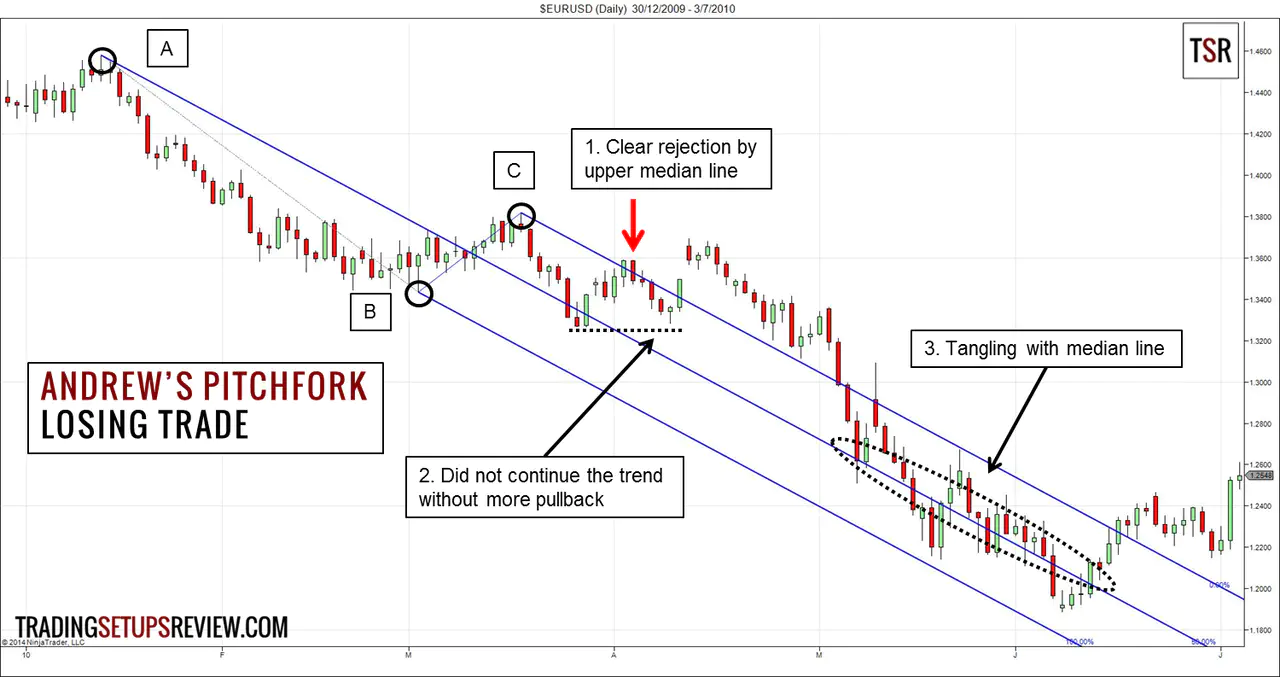
Losing Trade - Short EUR/USD Daily
This EUR/USD daily chart shows another bearish Pitchfork.
- Price fell and found resistance at the median line. It bounced up to the upper median line which resisted it. We entered short with the first bearish bar that overlapped with the line.
- Although the trade achieved more than 1:1 reward to risk ratio, we consider this trade as a failure because it was a trend continuation trade. Hence, the most conservative target was the last extreme of the down trend. Price rose up above our pattern stop at the high of our signal bar before hitting this conservative target.
- After the trend resumed, prices tangled with the median line, showing that this centerpiece was significant.
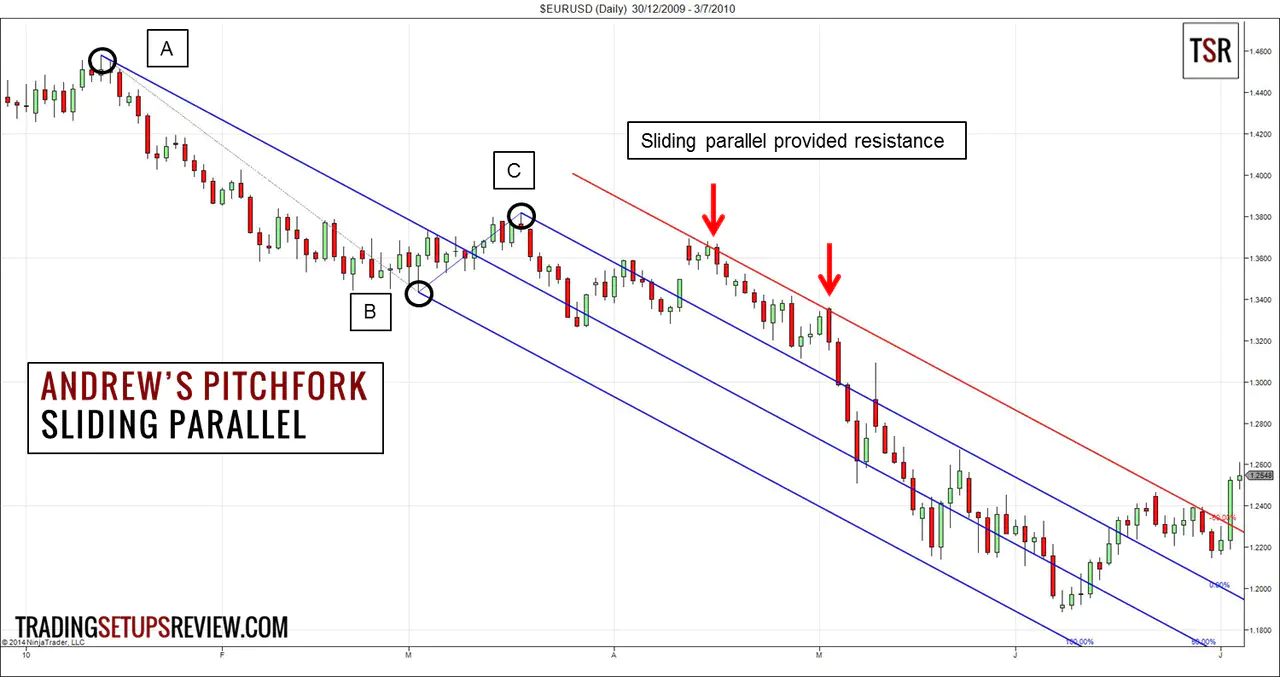
The timing of this trade was not perfect, but it was not a bad trade. In fact, this chart gives us a great opportunity to introduce sliding parallels.
Sliding parallels are added parallel lines which also act as channel lines. The first sliding parallel provided excellent resistance in this down trend.
This is a textbook example. In ongoing chart analysis, you will have many sliding parallels. (Just keep pushing them to the right by the same distance.)
It is not always clear which sliding parallel will be effective. Moreover, if you have too many sliding parallels, you might miss signals of a reversal.
Review - Andrew’s Pitchfork Trading Strategy
Andrew’s Pitchfork is a unique and reliable tool. The median line provides a different market geometry perspective. The trick lies in picking the right pivots.
Pick the major pivots. Ensure that the resulting channel is wide. Wide channels do better and offers a healthier reward to risk ratio.
When drawing Pitchforks, there are two common pitfalls.
The first is selecting the last pivot (point C) too soon. Exercise patience and let price action confirms the pivot as a major swing point before including it in your Pitchfork. If not, expect more false signals.
The second problem is with the person with too many Pitchforks. Some traders are so excited with this new toy that they draw Pitchforks all over the chart. It’s confusing and not helpful.
The basic Pitchfork we used is just a part of a massive trading approach that includes sliding parallels, trigger lines, multiple Pitchforks, and variants like Schiff. Most online materials only cover the basic Pitchfork.
Fortunately, there are several books that discuss Pitchfork analysis in detail. Take your pick.


(Alan Andrew based his method on Roger Babson’s findings.)


