Instantly Improve Your Trading Strategy with Support and Resistance
By Galen Woods ‐ 6 min read
Learn how to improve any trading strategy with support and resistance based on demand and supply. Find reliable S/R levels for the best trading setups.
What is the best way to improve your trading strategy? Use support and resistance concepts in your trading strategy.
Learn how to use support and resistance levels in your trading strategy to improve your trading results.
What are Support and Resistance levels?
Before you learn about support and resistance, you must first understand basic demand and supply.
Demand and supply are the underlying forces of price movements. Market turns up when demand overwhelms supply and turns down when supply overcomes demand.
(Technical analysis studies recurring price patterns that result from demand and supply changes. Fundamental analysis drills into the determinants of demand and supply.)
Prices move up when demand is stronger than supply. Buyers are more eager to buy than sellers are willing to sell. So buyers will offer a higher price to entice sellers. Price rises.
Prices drop when supply is stronger than demand. Sellers are more eager to sell than buyers are willing to buy. In this case, sellers will lower their asking price until buyers are willing to buy. Prices fall.
At support levels, we expect demand to overwhelm supply. When demand is stronger than supply, price will rise. Or at least, price will stop falling at the support level.
At resistance levels, as supply overcomes demand, we expect the price to stop rising and fall.
Take note that support and resistance are not clear-cut price levels. They occur over a range of prices. However, for convenience and clarity, many technical analysts draw lines to mark out support and resistance.
Drawing lines to represent support and resistance is acceptable as long as you understand that the lines actually represent zones where the demand and supply imbalance switches.
How to find support and resistance levels?
Swing Highs and Swing Lows
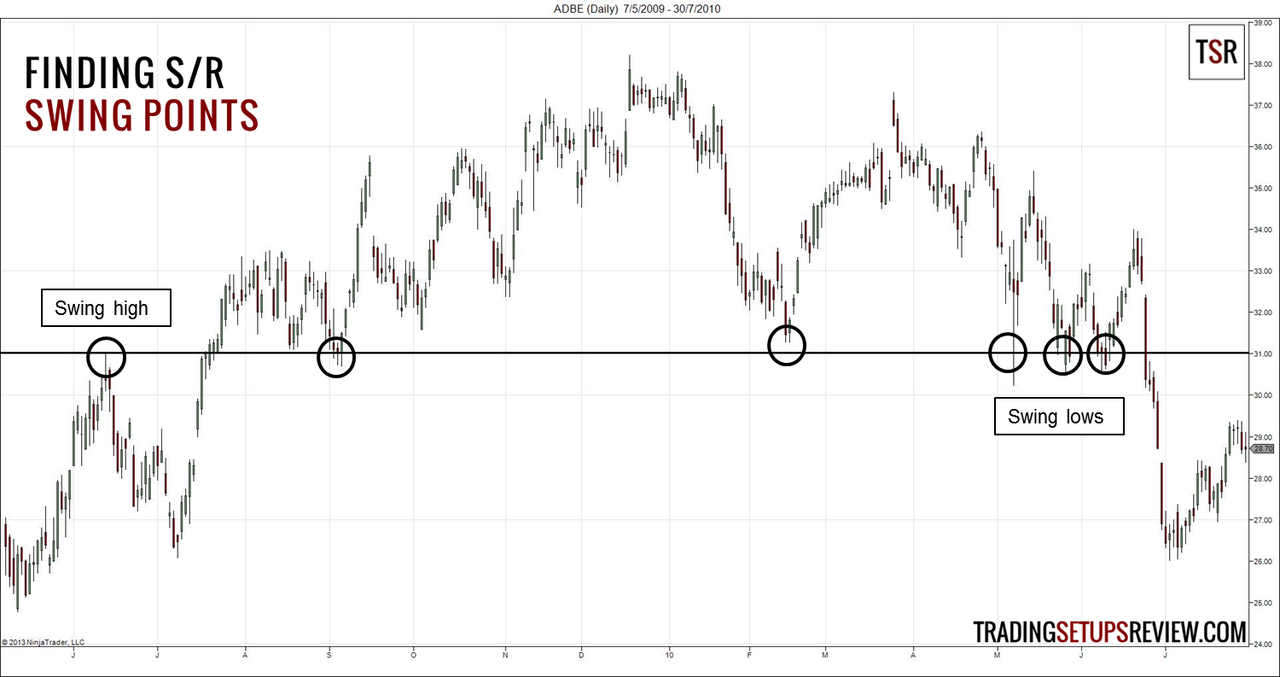
Swing highs and swing lows are earlier market turning points. Hence, they are natural choices for projecting support and resistance levels.
Every swing point is a potential support or resistance level. However, for effective trading, focus on major swing highs and lows.
Learn: Find Powerful Anchor Zones for High Probability Trades
Congestion Areas
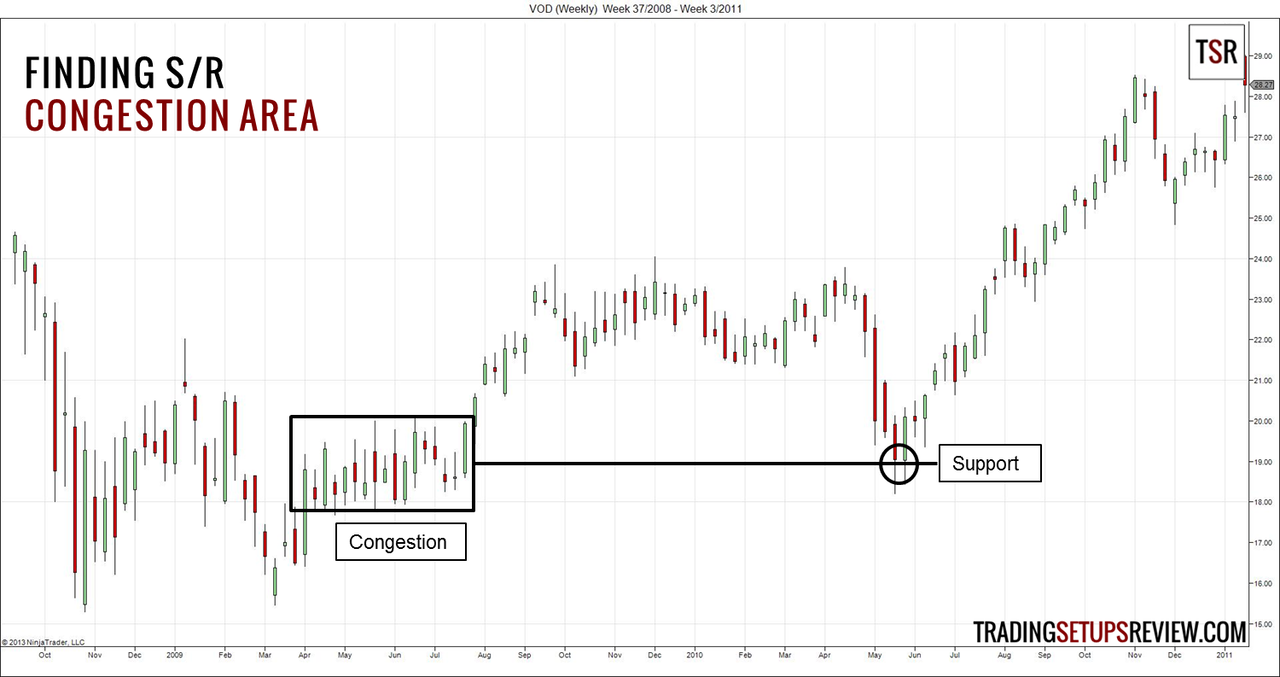
Market participants have spent a prolonged time in congestion areas. It is likely that they have formed psychological attachment or have established actual trading interest within that price range. Hence, earlier market congestion areas are reliable support and resistance levels.
Congestion areas reinforces the idea that support and resistance are zones, and not a specific price level.
If you need help finding congestion areas, price by volume charts might help.
Psychological Numbers
Humans attach significance to certain numbers.
Round numbers are the best examples. Round numbers always make financial headlines. The Natural Number Trading Strategy derives its trading edge from round numbers.
The 52-week high and low price of a security is another example of a psychologically important number.
Calculated Support/Resistance
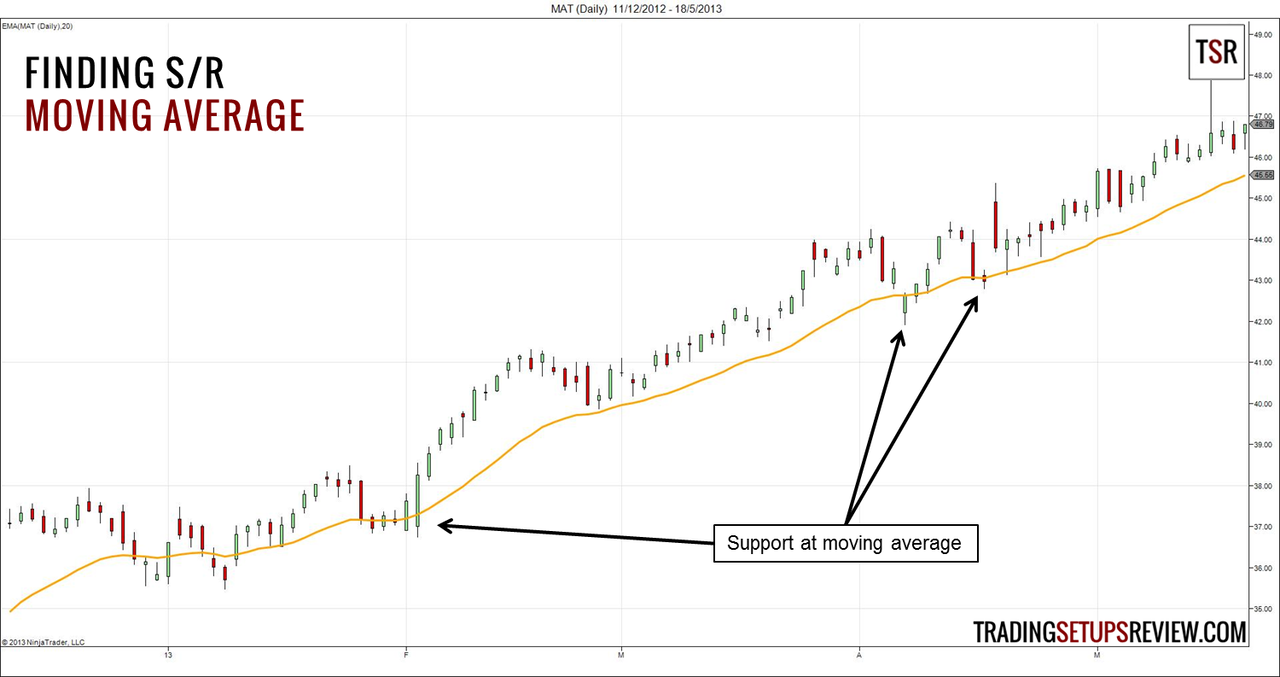
You can also derive support and resistance from calculated values like the moving average. They work best in trending markets.
Combining candlestick patterns with a moving average is a reliable trading method that uses moving average as support/resistance.
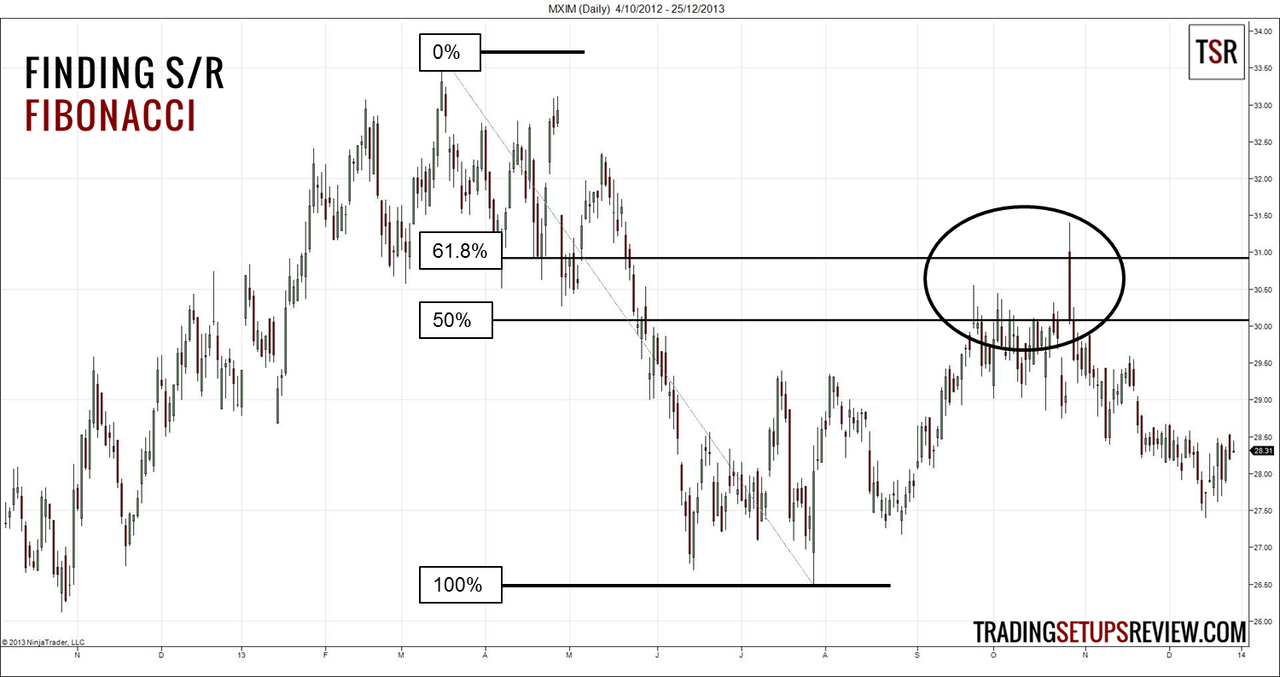
Fibonacci retracement is another popular method for projecting support and resistance by calculation. With a decent charting package, we can mark out retracement levels easily without manual calculation.
Identify major market swings and focus on retracement of the move by a Fibonacci ratio.
Fibonacci ratios include 23.6%, 38.2%, 50%, 61.8% and 100%. A 100% retracement is the same as using a swing high/low as resistance/support.
The intraday trend trading strategy we reviewed uses Fibonacci retracements to find the best trades.
Flipping of Support/Resistance
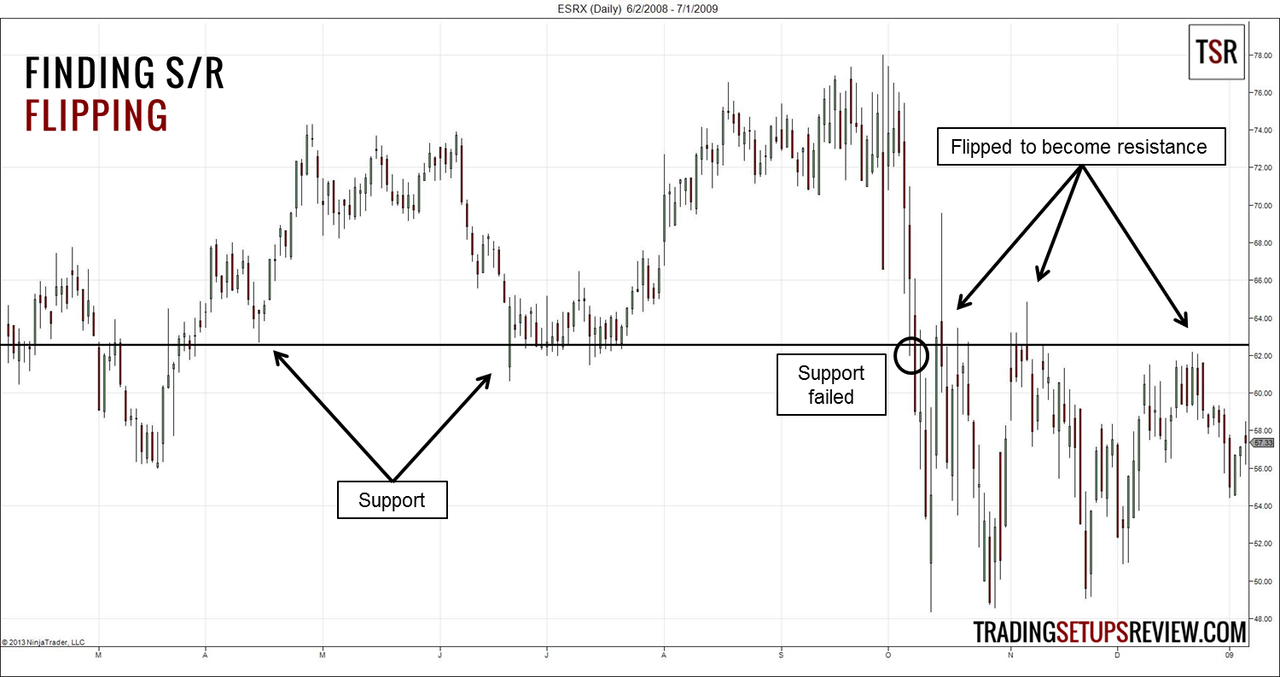
Flipping is an important concept for support and resistance. It refers to the phenomenon of support turning into resistance or resistance turning into support.
When price breaks through a support level, it shows a shift of power from buyers to sellers. The support level then becomes a resistance level that sellers are confident of defending. The reverse is true for price breaking through resistance.
This concept is applicable regardless of the method you use to find support and resistance levels.
Support/Resistance from Higher Time-frame
To focus on major support and resistance levels, you can find them on higher time-frames before applying them to your trading time-frame for analysis.
For instance, you can note down the support and resistance levels from the weekly chart. Then, plot them on the daily chart to find trading opportunities.
This method keeps you focused on important support and resistance levels instead of flooding your chart with dozens of potential support and resistance levels.
How to use support and resistance levels in your trading strategy?
Trading Direction
In up trends, support levels are likely to hold. In down trends, resistance levels tend to hold.
Hence, if you see that support levels are holding up, you might consider taking only long trades. The reverse is true if you see resistance levels holding up.
Paying attention to price levels is a simple way to find a clear market bias.
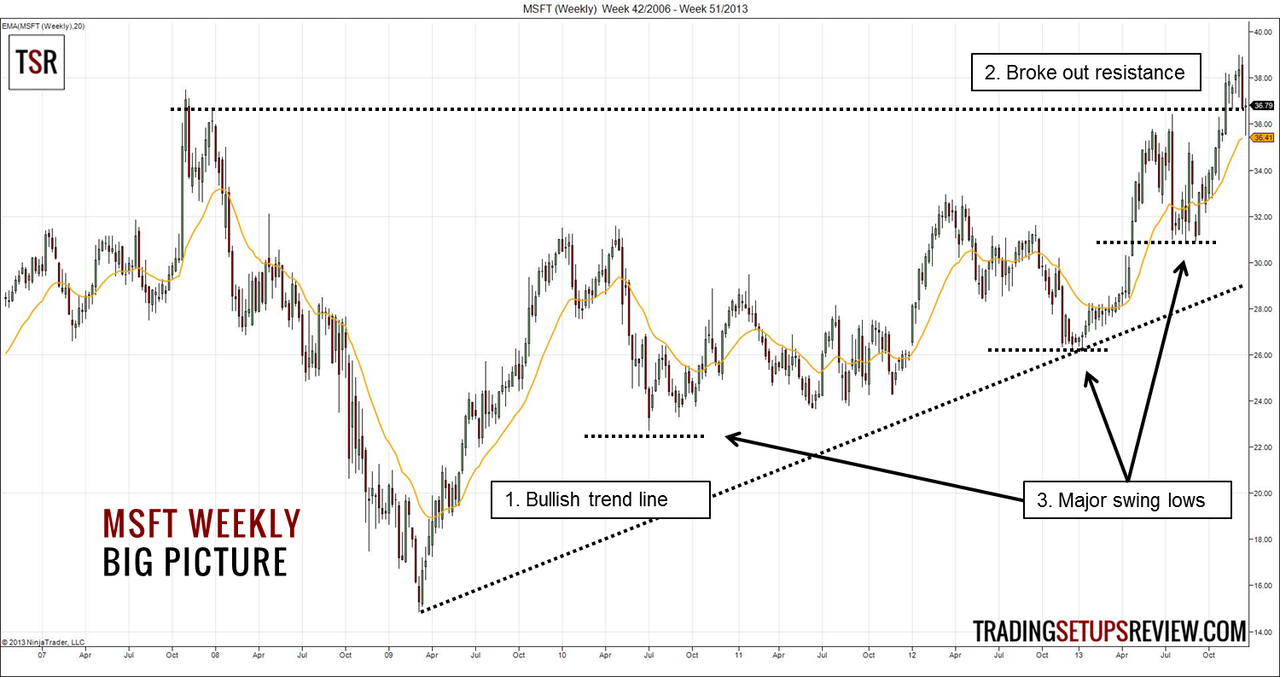
This example shows major swing lows that are holding up as support, which is a sign of a bullish market.
Filter Bad Trades
Your trading strategy might have its own way of determining market bias. In that case, do not confuse your analysis with support and resistance. Rely on your trading strategy for a primary bias.
However, you can use support and resistance analysis to augment your trading strategy.
For instance, if your trading strategy dictates a buy, but price is right below a major resistance level, you might want to wait for a clear break-out of the resistance before entering on pullbacks.
By waiting for more price action to unfold near support and resistance levels, you can avoid low-quality trades.
Trade Entries
Look for bullish signals at support levels and bearish signals at resistance levels. This is the key to finding the best trades in any trading strategy.
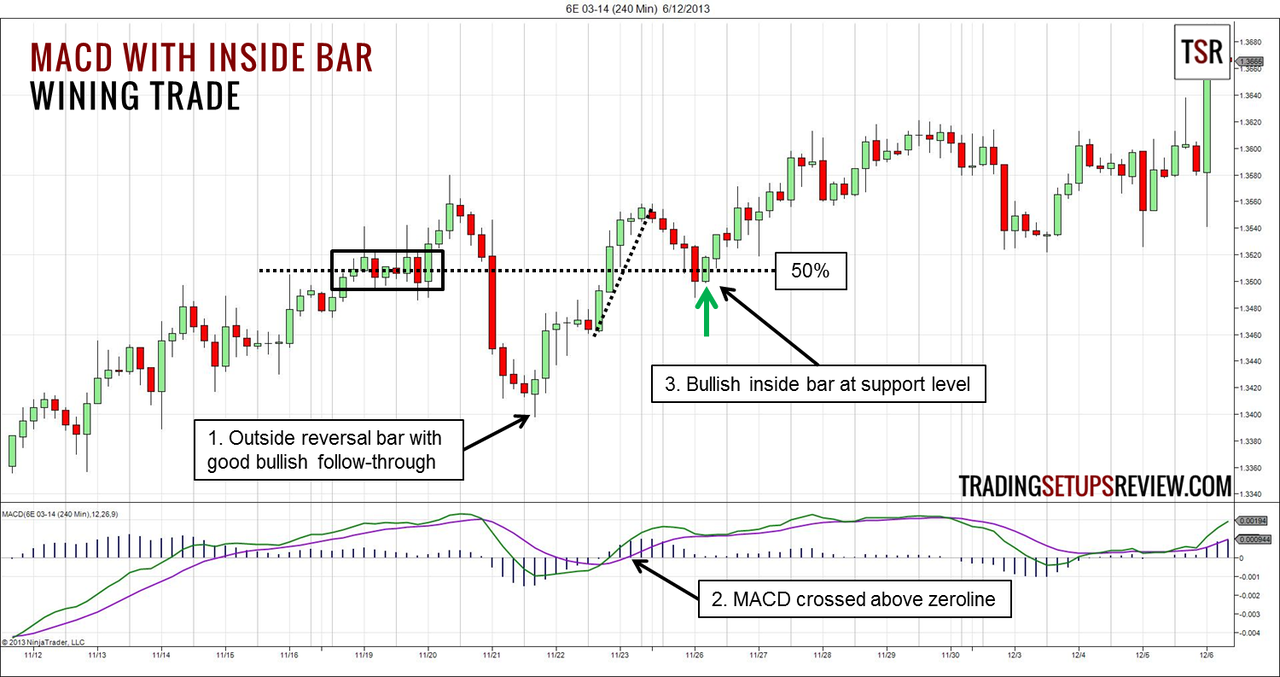
This chart shows a trade from the MACD with inside bar trading strategy. The bullish inside bar was a result of support at an area of earlier price congestion. It had the makings of a high-quality trade.
Trade Exits
Support and resistance, even the minor ones, are effective as price targets and stops.
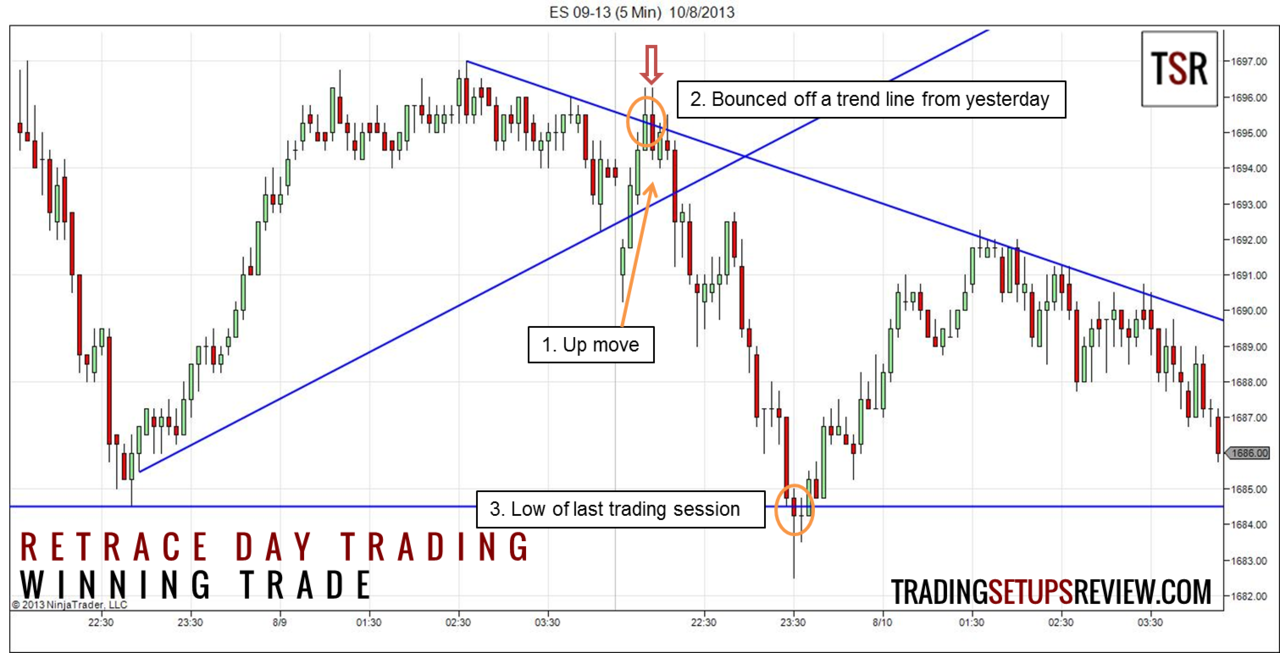
For day traders, the high and low of the previous trading session are important support and resistance levels. This example (retrace day trading setup) shows that the low of the previous session was the perfect price target for this trade.
Support & Resistance - Essential & Effective
Support and resistance are essential features of the price landscape. Do not navigate prices without them.
Before considering any trade, mark out the support and resistance levels. These potential zones of demand and supply will help you understand the market.
Use this understanding in your trading strategy to your instant advantage.