Quick Trade Using Linear Regression Channel For Trading Options
By Galen Woods ‐ 8 min read
Learn two powerful trading strategies that use a linear regression channel as a trading tool. Trading options is a great way to capitalize on this setup.
Quick Trade Using Linear Regression Channel is a trading method from Bernie Schaeffer’s book - “The Option Advisor: Wealth-Building Techniques Using Equity & Index Options.” As this trading strategy is designed for trading options, it aims to find a quick trade that does not drag beyond a week. This trading style is suitable for any trader who wants to limit their time exposure to the market.
This trading strategy uses linear regression channels (or standard deviation channels) to identify trends that are poised to accelerate.
Hence, you need to have a basic understanding of linear regression channels. If you’re not familiar with linear regression, don’t fret. The next section contains a short primer on linear regression channels.
Other than the quick trade approach, we will also cover a more conservative setup that uses regression channels for pullback trading. Comparing similar trading strategies is a great way to glean more insights about the trading tools we employ.
Read: Four Ways To Trade Using A Channel.
What is a Linear Regression Channel?
Linear Regression Line
The basis of a linear regression channel is the linear regression line.
The linear regression line is a line drawn according to the least-squares method. This statistical technique produces a best-fit line that cuts through the middle of price action.
It does so by minimizing the vertical distance between prices and the best-fit line. The chart below shows a linear regression line.
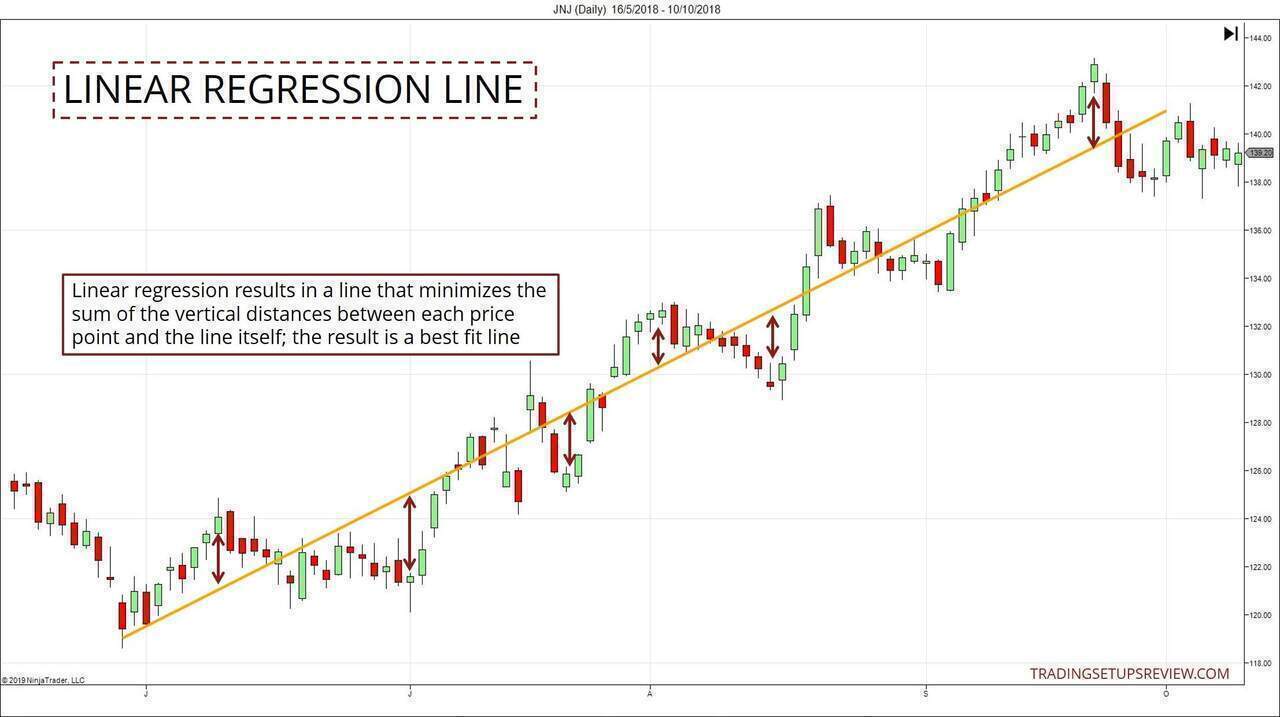
As you can see from the chart above, the linear regression line offers an elegant method to track price trends using price action.
For best results, start and end a linear regression line at key swing pivots.
To learn the exact workings behind linear regression, you can refer to this tutorial at onlinestatbook. Understanding the statistical origins of linear regression is the key to grasping its strengths and weaknesses.
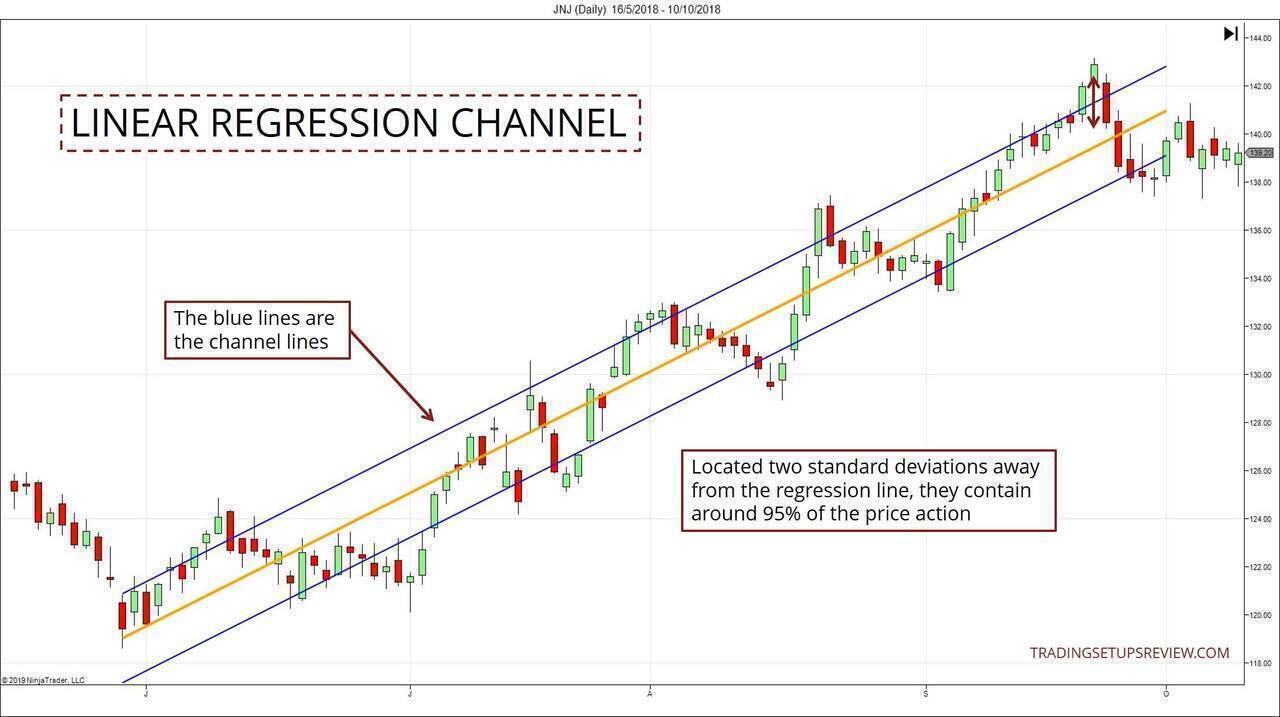
Linear Regression Channel
Once you know what the linear regression line is, you are just one step away from getting a linear regression channel on your chart.
To get a linear regression channel:
- Draw a linear regression line connecting two swing points
- Extend the channel lines two standard deviations away from each side of the line
As the regression channel is formed using standard deviation as a volatility measure, you’ll find some traders referring to it a standard deviation channel.
In most technical analysis charting software, you’ll find a linear regression channel drawing tool.
These tools will project the channel lines for you automatically.
You just need to select the two pivots as anchors for the channel. The calculation for the linear regression will account for all price action data between the two anchor points.
Linear Regression Charting Tools
You’ll want to explore your own charts as you go through the strategy below.
In case your charting platform does not have a regression tool, here are some charting platforms to consider:
- TradingView - You will find it under Trend Line Tools > Regression Line.
- NinjaTrader 7 - You will find it under Drawing Tools > Regression Channel (or Ctrl + F10)
- Thinkorswim (TOS) - You will find it under Drawings > Drawing Tools > Regression Channel
Trading Rules - Linear Regression Channel

In his book, Bernie Schaeffer recommended the time exit rule of 7 days. This rule is pivotal to this setup being a quick trade.
The central idea is that the trend should accelerate quickly. And if it does not, you should act decisively and flatten the position.
While this trading strategy is designed for trading options, as with most technical analysis concepts, you can use it for other instruments as well.
Rules For Long Trade
- Draw a linear regression channel connecting two significant swing lows
- Prices close above the channel for two consecutive days
- Buy with a limit order upon a retest of the top channel line
- Exit in 7 days
Rules For Short Trade
- Draw a linear regression channel connecting two significant swing highs
- Prices close below the channel for two consecutive days
- Sell with a limit order upon a retest of the bottom channel line
- Exit in 7 days
From rule #3, you can tell that this setup relies on the concept of flipping. It requires the broken channel line (top or bottom) to flip from resistance to support or vice versa.
Trading Examples - Linear Regression Channel
Winning Trade Example
This example comes from the daily chart of IBM. It is an optionable stock so you can make use of call options for a Quick Trade.
According to the Quick Trade rules, we would have entered the market as prices fell back to the top channel line as shown by the green arrow.
Exiting the position in 7 days (red arrow) would have given a healthy ROI to a well-selected call option position.
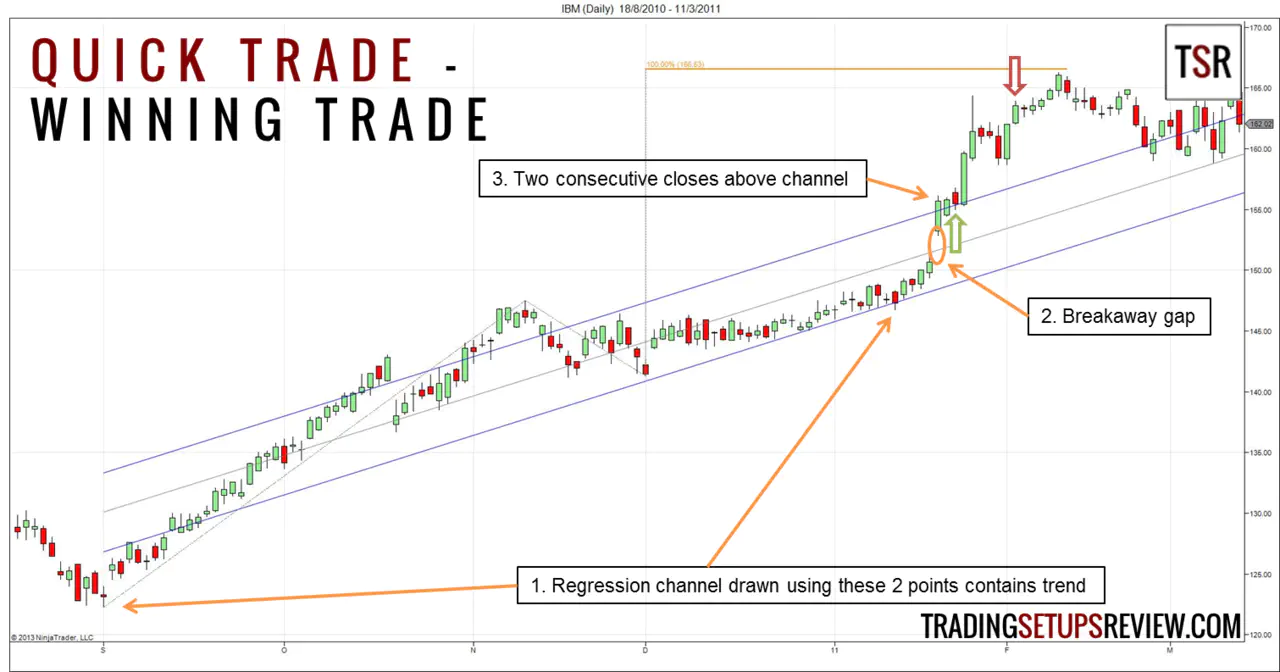
Let’s take a closer look at this trading example.
- For the linear regression channel, we chose a significant swing low as the starting point. Then, we adjusted the ending point of the channel as new swing lows formed. Hence, the linear regression channel changed as price action unfolded, making this strategy a dynamic one.
- In the rise up toward the top of the channel, a runaway gap formed. It gave us one more reason to take on a long position.
- These two consecutive closes above the channel is an essential filter for avoiding false breakouts.
Losing Trade Example
In this daily chart, Altera Corp. (ALTR) reversed into an upward trend.
Using the turning point to anchor our linear regression channel, we got a Quick Trade signal as shown by the green arrow. However, seven days later, the trade was closed with a loss.
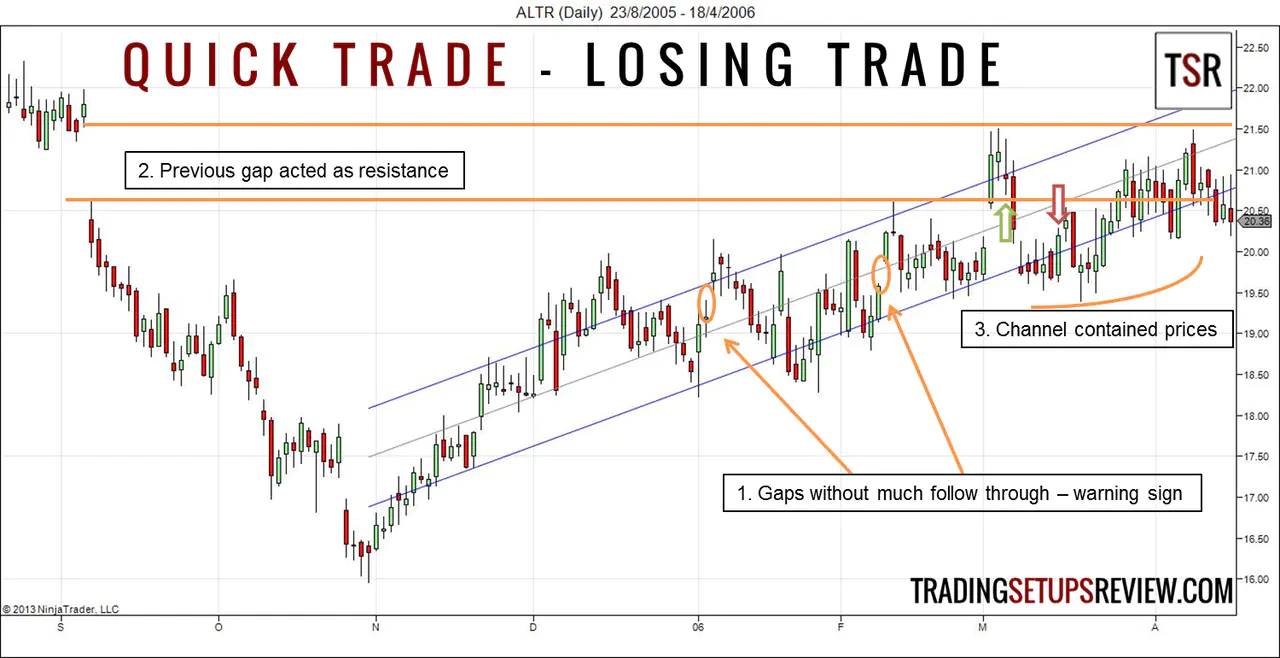
The previous price action gave warning signs against taking this Quick Trade.
- Each time, prices gapped up but stalled, showing that the bulls were not eager to get into the market.
- The market broke out of the linear regression channel into a resistance zone projected from a breakaway gap. It was a factor against the long Quick Trade signal.
- Despite the trade failure, our channel was well-drawn as it contained most of the price action.
We could have relied on the bounce up from the lower channel line to exit at a better price. But we must respect our time stop rule of 7 days when trading options. Never forget that options value decay with time.
Linear Regression Channel Pullback - A Simpler and Safer Trading Strategy
The Quick Trade setup has a clear objective. It takes advantage of accelerating trends that move quickly within a short period.
However, this approach requires you to enter the market as it pushes to a new trend extreme. Hence, it is an aggressive trading strategy. It requires you to buy an overbought market or sell an oversold one.
If you’re like me, you might be uncomfortable with its bold approach.
But do not write off the linear regression channel because of that. A regression channel is a versatile tool that lends itself well to a variety of trading approaches.
An Alternative Trading Strategy With Regression Channels: Pullback Trades
Let’s see how it works in a simple trend pullback trade.
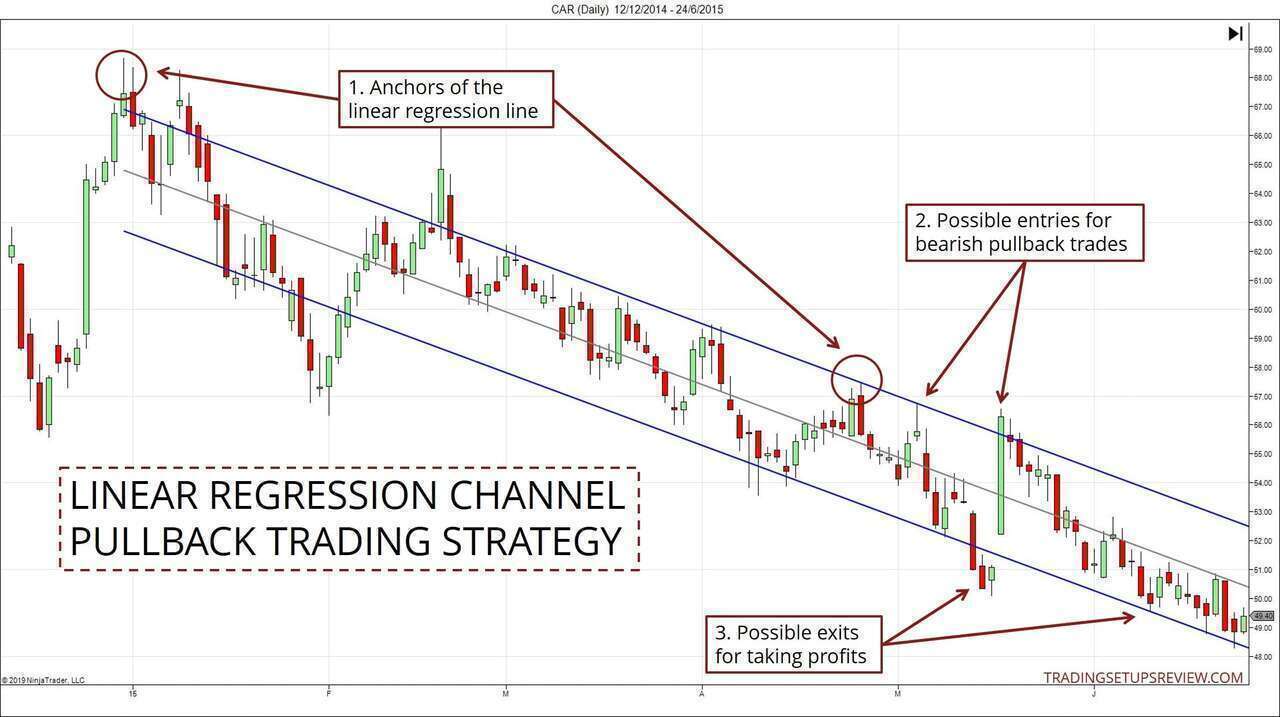
- These are the anchors for the linear regression channel. We then project the channel to the right for our analysis.
- These two pullbacks to the upper channel line were potential short entries.
- The lower channel line served as profit-taking points.
The pullback trades here moved quickly in our favor. This example shows that a pullback approach has the potential to offer quick trades as well.
Review - Trading With Linear Regression Channel
Trading strategies with the linear regression channel combine the following:
- Mechanical implementation of best-fit lines
- Discretion of the trader in choosing the swing points
How you draw your linear regression channels impact your probability of success. Choose a major swing low/high to start the channel so that it contains the prevailing trend.
As a regression channel is a statistical tool, traders tend to underestimate the discretion involved in its usage.
A regression channel produces very different signals depending on the anchor points you choose. Furthermore, you have the option of adjusting the second pivot to update the channel as price action evolves.
While adjusting the channel is a great way to keep up with the latest price action, you need to decide on the frequency of these adjustments. This consideration adds another layer of complexity to using the regression channel.
Overall, the Quick Trade setup is a reasonable trading approach, but opportunities are limited. Moreover, due to the discretion you need to choose swing points, it is not easy to set up automatic scans for Quick Trade setups.
Be patient and wait for the best trade. Given the leverage in options trading, the wait is worth it.
The idea of having a time stop for an options trading strategy is excellent. Although buying options limits your exposure to your initial outlay, you should not hold on to your position if its edge has already eroded.
The Quick Trade is one of the many ways to trade with the linear regression channel. Like we discussed in the second part of the article, a more conservative approach is to use it as a way to track price trends and trade pullbacks.
Resources For Further Studies
If you’re fascinated by the regression techniques, you’ll be excited to learn that it is a common feature in trading and investing strategies.
Check these out:
- Polynomial Regression Channel Trading Strategy - Unlike the regression line above, these polynomial regression lines are allowed to curve.
- Linear Regression Curve For Trading - Uses regression concepts to produce plots that work like moving averages.
Channels like the linear regression channel are great for making sense of price action as they do not create a separate plot. Instead, they overlay the price chart itself.
If you like trading with channels, check out these tutorials:
- Moving Average Channel Day Trading Strategy
- Reading Price Action With Keltner Channels
- Reading Price Action With Bollinger Bands
The article was first published on 17 June 2013 and updated on 13 September 2019.